Petri Net Modeling of Application Server Performance for Web Services
M. Rahmani, A. Azadmanesh, H. Siy
College of Information Science & TechnologyUniversity of Nebraska-Omaha Omaha, NE 68106. Tel: +1(402) 554-2084 {crahmani, azad, hsiy}@unomaha.edu
Abstract—A study of failure rates of a web service that is
deployed in a service-oriented architecture is presented. The study focuses on the HTTP requests that are rejected by the application server. The rejections may be caused by system overloading or mismanagement of configuration parameters. An analytical model and a Stochastic Activity Network (SAN) model are developed to predict the number of such failures. The performance of the models is compared against the experimental results in a LAN environment that is used as a test-bed. The models utilize the parameters extracted from the empirical testing such as the average response time and arrival rate of the web service requests. The accuracy of the SAN model suggests that the model can be beneficial to predict the rejection rate of web services and to better understand the application server performance for those cases that are difficult to replicate in a field study.
Keywords- Application Server; Simulation Model; Service Oriented Architecture; Web Service; Petri Net; Load Testing
I. INTRODUCTION AND RELATED WORK
Web services, such as electronic shopping, online auction, and banking services, have permeated our daily lives due to the ease of use, flexibility and reduction of cost in providing the services [1]. They are generically seen by many as applications that can be accessed over the Internet. A more precise definition of web services, provided by the World Wide Web Consortium (W3C) [2], defines it as a software system designed to support interoperable machine-to-machine interaction over a network. Web services are generally enabled through an application server software that communicates with a web server and a database server.
With the prevalence of web services in real-time and critical software domains, high level of reliability and performance are expected from them. As such, a number of approaches to reliability prediction and performance evaluations have been attempted. These approaches are often not new and have been applied to reliability and performance analysis of component-based software systems. Some of the most common approaches are based on Markov Chains, Tree-based, and Petri net models [3,4,5,6,7]. The majority of research works is theoretical with less emphasis on experimental analysis to support the theoretical results [4,8,9,10,11]. For example, Zhong and Qi [8] propose a Petri net model of performance and dependability of web service composition. However, the
paper emphasizes on theoretical aspect of research and does not include any experimental analysis. In [9], authors presented a simulation-based model for performance analysis and evaluation of application servers using Petri nets. However, the numerical illustration of the presented simulation model is based on hypothetical input and not real experiments.
Some of the studies that use a combination of theoretical and experimental analyses include [12,13,14,15,16]. Xiao and Dohi [12] focused on the relationship between the Apache server error rate and system’s performance and developed a probability model to describe this relationship. In [13], authors focused on a performance evaluation model of a web server system, which is based on a queuing model and evaluated the effectiveness of the model through the experiments in the lab environment. In [14], the authors proposed another queuing model to evaluate the performance parameters of a web server such as the response time and the blocking probability. The authors in [15] evaluate the response time and throughput of web services by collecting and analyzing large sets of data from geographically distributed locations. Goseva et al. [16] presented an empirical as well as theoretical study of architecture-based software reliability on a large open source application with 350,000 lines of C code. They emphasized on theoretical and experimental results on a large scale field study to test and analyze the architecture-based software reliability.
This paper is focused on the performance modeling of the JBoss application server [17] with respect to response time, throughput, and rejection (blocking) rate of web service requests. The study 1) introduces an analytical method to measure the rejection rate, 2) establishes an experimental environment to collect data by generating controlled loads of web service requests to JBoss, and 3) injects the experimental results into a Petri net model that simulates the JBoss performance behavior. In general, the main contribution of the paper is the measurement and comparison of web service rejection rate from analytical, empirical and simulation (Petri net) points of view. Other than the experimental and theoretical approaches, this study is different from many other relevant research works in that the focus is geared toward understanding the effect of configuration parameters such as the maximum HTTP thread pool and the queue size in the application server. Petri nets are chosen for this study because of the
flexibility they provide to model systems with multi-threaded executions. In comparison, analytical approaches such as Markov models are difficult to express multi-threaded systems, at least because of the state-space explosion problem, as each Petri net marking becomes a single state in the Markov model. As Markov models can be seen as a finite state machine, they are more suitable for single-threaded systems.
The paper is organized as follows. Section II presents a) the description of experiments, b) an analytical model, and c) the Petri net model for HTTP request rejection rate in JBoss. Section III focuses on experimental and analytical results. Section IV offers some possible directions to the future research and finally section V contains some concluding remarks.
II. DESCRIPTION OF EXPERIMENT
A. Experimental Environment
The experimental environment consists of two hosts (client and server) remotely located from each other in a LAN environment. The host server on which JBoss is running is excluded from running other tasks to ensure the consistency of data sets collected. The Duke’s Bank application [18] is transformed into a web service and deployed on JBoss. JBoss uses the Apache Tomcat as its default web server. The client host generates service requests to JBoss. The bandwidth of the LAN is shared with other users not relevant to this experiment. Tools like Wireshark [19] and Ping are used to measure the round trip delay (RTD), excluding the time spent in the hosts. In comparison to the time spent in the server, the RTD is observed to be so negligible that it is ignored in the experimental analyses. The system structure is illustrated in Fig. 1.
Figure 1. The experimental setup.
SoapUI [20] is used to generate controlled service request loads to the server. SoapUI is an open source testing tool solution for service-oriented architectures. With a graphical user interface, SoapUI is capable of generating and mocking service requests in SOAP format. There are two main parameters in SoapUI load testing tool that can be set to control the workload of the
application server: number of threads representing the virtual users, and the number of requests (runs) generated per thread. For example, if the number of threads is set to 20 and number of runs per thread is set to 10, then there are 20 clients, each sending 10 SOAP requests for a total of 200 requests. SoapUI measures several performance parameters such as the average response time, avg, transactions per second, tps, and the number of transaction requests failed in the process, which is denoted as err. Avg is the average time difference between the times a request is sent out until the response is received.
Tps, also called arrival rate, is the average number of requests generated by the clients per second.
The experiments have been conducted with sixteen different load configurations. For each load test, SoapUI returns the values for avg, tps, and err. Each test is repeated 5 times and the average of the returned values are calculated. The total time T for each load test configuration is computed as follows:
where cnt is the total number of requests for each test. Consequently, the error and success rates for each load are computed by:
The error reports generated by SoapUI consist of all types of potential errors that are generated by the network, application server, and web service itself. However, this study considers only the errors that are generated by JBoss when the HTTP requests are rejected. Therefore, is treated as .
B. The Analytical Model
The actual rate of requests rejected can be obtained from (2). This rate can be estimated in a different way. Recall that avg is the average response time for one request. Therefore, the service rate is 1/avg. In order for JBoss not to reject any incoming request, it should be able to use enough threads to keep up with the arrival rate. Thus, JBoss will reject no requests if the following holds:
0 1 1 threads tps avg tps threads avg
Otherwise some requests will be rejected. Thus, number of requests rejected per unit of time, i.e. ,
will be:
)
Consequently, the total number of requests rejected is: (4)
Client Server
OS Windows 7 Windows Vista
Processor 1.67 GHz 2.66 GHz
RAM 1.00 GB 2.00 GB
Software SoapUI (3.6.1) JBoss AS (4.2.2) SOAP- Http Request SOAP- Http Response WS client SoapUI JBoss AS Banking WS
The accuracy of (4) depends on threads, which will be referred to as threshold. This is because any value higher than the threshold value underestimates and any value lower than the threshold overestimates the number of rejections. Thus, the following will be used instead of (4).
(
) (5) Threshold is computed from the experimental analyses. Theoretically, when the configuration parameters maxThread and acceptCount in server.xml file are set to 250 and 100 respectively, it is expected that JBoss handle 350 requests (250 in the thread pool and 100 in the queuing system). However, in real world experiments, there are many factors such as memory, processor and type of operating system that may affect the actual number of threads that can be devoted to requests. More importantly, the response time evaluated by SoapUI includes the time spent in the queuing system and the time actually spent on servicing the request. With this experiment setup in the lab and by running different tests,
threshold is estimated to be around 315. This is the threshold number of threads in JBoss that leads to performance results from the test cases performed on SoapUI.
It is expected that the response time, avg, to increase as the number of requests increases. Fig. 2 shows the avg
numbers for different virtual users in the real experiments, where each user sends 10 requests. The figure exhibits that the response time increases up to a point, levels-off for a moderate range of requests, and then increases again.
Figure 2. Average response time based on number of virtual users.
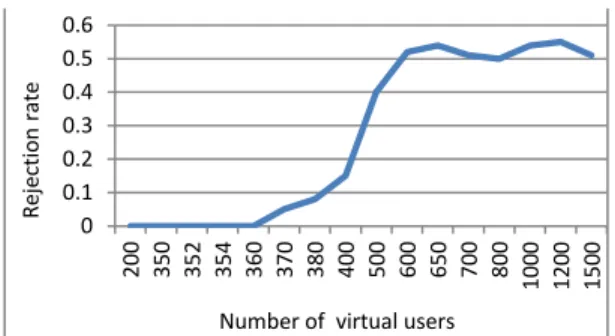
The reduction in response time beyond 370 up to around 500 users is counterintuitive because as there are more requests the response time ought to increase instead. During this period, Fig. 3 indicates that the rejection rate is increased. Toward the end, Fig. 2 further shows sharp increase in the average response time while the rejection rate on average in Fig. 3 stays the same. This paradoxical behavior has two reasons. The first reason is that SoapUI uses the total requests in calculating the average response time, regardless of whether a request is successful or rejected. It is for this reason that the average response
time of 15.11 in Fig. 2 can be interpreted as the true response time because at about 370 users the number of rejections is low or almost nonexistent. The second reason is contributed to JBoss, which can be explained as follows. From 370 to around 500 users, the server is using the resources that are already setup and activated, so the system can reallocate them to other requests, such as the thread resources. Beyond 500 users, the server overhead, such as the time taken to reject the requests, accumulates as the rejection rate increases.
Since SoapUI includes the rejection count in the evaluation of average response time, one way to find a good estimate of the actual response time is to use a packet capture tool such as Wireshark and evaluate the response time for each successful request from the time the request is received by the server until the response is sent back to SoapUI. This requires filtering the blocked requests and evaluating the response time for each individual successful request, which seems to be infeasible. The other approach is to use 15.11 as the estimate of the actual response time for loads more than 370, where the rejections really start. This value shows the peak of response time when the system utilizes all the resources for high level loads without being biased by the rejected requests. Therefore, in this study avg = 15.11 is used as the closest approximation of average response time for high level loads.
Figure 3. Request rejection rate based on number of virtual users.
C. The Stochastic Activity Network Model
Petri nets are a graphical model for the formal specification and analysis of concurrent and discrete-event systems. Since the introduction of classic Petri nets, a number of variants have been introduced. Stochastic Petri Nets (SPN) is a subsidiary of timed Petri nets that adds non-deterministic time through randomness of transitions. Generalized Stochastic Petri Nets (GSPN) is a SPN performance analysis tool that uses the exponential random distribution, and thus conversion to Markov Chains is automated. Stochastic Activity Network (SAN) [21] is a structurally extended version of GSPN with many features such as the ability of creating complex enabling functions, probabilistic choices upon completion of activities, and reward functions. In the world of SANs, transitions (actions) are referred to as activities, which can be of two kinds: timed and instantaneous. The firing (activation) time of timed activities are exponentially distributed. Once enabled, instantaneous activities 0 5 10 15 20 25 30 35 200 350 352 354 360 370 380 400 500 600 650 700 800 100 0 120 0 150 0
Number of virtual users
Av er age r es p o n se t im e 15.11 0 0.1 0.2 0.3 0.4 0.5 0.6 200 350 352 354 360 370 380 400 500 600 650 700 800 100 0 120 0 150 0 R eje ct io n rat e
complete in zero-time, and thus have priority over timed activities. Reward functions are used to measure performance or dependability related issues.
The SAN model describing the behavior of the web service system is constructed using Mobius [22]. Mobius can solve SAN models, either mathematically or by simulation. Because of the types of reward rates used we have found it easier and less time consuming to work with the simulation solver. Fig. 4 provides a SAN model for the service requests that arrive at the server (JBoss) side. Recall that Duke’s Bank web service is used in this experiment. This web service receives customer ID and returns all account numbers of the customer.
Figure 4. The Petri net model of JBoss serving the requests.
In the figure, the timed and instantaneous activities are shown by thick and thin bars, respectively. Each flat dot represents a probabilistic choice that leads to taking a different path in the model once the activity completes. The place called Request is initialized to cnt, the number of total HTTP requests for each test case. The rate of the
Tarrival activity gives the rate of arrivals per unit of time, which is equal to tps. The HTTP thread instance pool in JBoss is represented by the Threadpool place, which is initialized to maxThread extracted from the configuration file named server.xml. Once Tarrival completes, the token generated, through the output gate OG, shown as a solid triangle, will be deposited in either Start or
Blockedrequest. OG represents the conditions for rejecting HTTP requests. For instance, if Start has reached its maximum capacity, OG will redirect the token to
Blockedrequest; otherwise the token is added to Start. The rejected requests are accumulated in Down via T03
activity. Activity TJW, which represents the service rate of the application server, is enabled only if Threadpool
and Start are not empty. When TJW is activated, a token in Threadpool representing an available thread in JBoss is allocated to a request in Start. Once the request is serviced, the thread, through T01, is released to
Threadpool to be used by a next request. In case the server fails to service the request (lower case of TJW), the allocated thread is returned to Threadpool via T02. The failure probability (lower case) of T01 is the probability that the service request is failed by means other than failures caused by the application server, such as a failure in the network or unregistered service. These failure
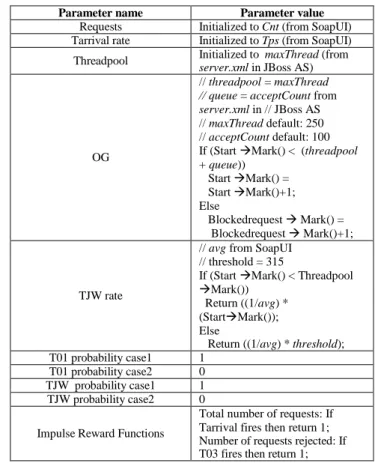
probabilities are set to zero but can be set to non-zero values. Table I shows the parameters and their values used in the SAN model. The impulse reward functions count the number of activities that complete. The number of activations at Tarrival shows the total number of requests that has entered the Petri net model. Similarly, the number of activation completions at T03 represents the number of requests rejected. Let be the number of
these rejections, i.e. the number of T03 activations.
TABLE I. SAN MODEL PARAMETERS
Parameter name Parameter value
Requests Initialized to Cnt (from SoapUI)
Tarrival rate Initialized to Tps (from SoapUI)
Threadpool Initialized to maxThread (from
server.xml in JBoss AS)
OG
// threadpool = maxThread // queue = acceptCount from server.xml in // JBoss AS // maxThread default: 250 // acceptCount default: 100
If (Start Mark() < (threadpool
+ queue)) Start Mark() = Start Mark()+1; Else Blockedrequest Mark() = Blockedrequest Mark()+1; TJW rate
// avg from SoapUI
// threshold = 315
If (Start Mark() < Threadpool
Mark())
Return ((1/avg) *
(StartMark());
Else
Return ((1/avg) * threshold);
T01 probability case1 1
T01 probability case2 0
TJW probability case1 1
TJW probability case2 0
Impulse Reward Functions
Total number of requests: If Tarrival fires then return 1; Number of requests rejected: If T03 fires then return 1;
Since the threads in JBoss are executed in parallel, the if-clause of the TJW rate in the table ensures that there are enough threads to be allocated to the requests. The else-clause, however, is not intuitive enough. The else-clause should be looked at with the OG condition in mind. JBoss allows a maximum of queue requests to be queued. In other words, if Threadpool is empty, there can be at most
queue tokens in Start. Consequently, if there are x <
threadpool tokens in Threadpool, the maximum number of tokens in Start is (queue + x). Since the value of x
changes depending on the available threads, the maximum tokens in Start, i.e. (queue + x), continuously changes as well. This causes threshold that represents the speed at which the SAN model services the requests to be dynamic. In other words, threshold needs to be throttled each time x changes. This makes it difficult to predict an appropriate threshold value that meets the rejection rate observed by the experiments performed using SoapUI. Thus, the maximum value of Start is set at the fixed value (threadpool+ queue). This in turn makes threshold to be a fixed value. As it will be shown shortly, this approach
Request Tarrival OG Start TJW Threadpool Response Webservicedown Blockedrequest T01 T02 T03 Down
has shown that performance of the SAN model is very close to that of the rejection rate reported by SoapUI.
III. RESULTS
Sixteen tests have been conducted on the banking web service. Each test is run five times and the average of extracted data is considered as experimental data. Table II shows a sample data extracted from SoapUI. For each of the 16 different loads, avg and tps values returned by SoapUI are used in the SAN model (see Table I) and (5). Table III shows the results for the 16 tests obtained from SoapUI, the theoretical equation (5), and from running the SAN model. As it is shown in the table, the worst rejection rate happens when there are 380 users, which is 0.13 – 0.08 = 0.05, and 0.14 – 0.08 = 0.06 for the theoretical and the SAN model, respectively.
TABLE II. SAMPLE DATA EXTRACTED FROM SOAPUI
Users (threads ) Runs per threa d Cnt Avg (sec) Tps Total time (sec) Numbe r of request s rejected Request rejectio n rate 200 10 200 0 7.46 24.6 8 82.55 0 350 10 350 0 13.7 6 22.9 2 153.2 5 0 0 352 10 352 0 13.8 3 22.2 5 158.2 1 0.5 0 354 10 354 0 13.6 9 22.6 1 156.5 8 5 0.001 360 10 360 0 14.5 4 22.1 5 162.6 7 24.2 0.006 370 10 370 0 15.1 1 21.7 8 170.4 6 185.4 0.05 380 10 380 0 13.7 1 24.1 3 157.6 4 332 0.08
TABLE III. REQUEST REJECTION RATE FOR ALL SIXTEEN TESTS
Number of simultaneous users Request rejection rate (SoapUI) Request rejection rate (rejectionest /cnt) Request rejection rate (rejectionSRN /cnt) 200 0 0 0.01 350 0 0 0.04 352 0 0 0.03 354 0.001 0 0.03 360 0.006 0.02 0.04 370 0.05 0.04 0.05 380 0.08 0.13 0.14 400 0.15 0.17 0.17 500 0.4 0.4 0.4 600 0.52 0.5 0.49 650 0.54 0.52 0.52 700 0.51 0.52 0.52 800 0.5 0.54 0.53 1000 0.54 0.51 0.51 1200 0.55 0.52 0.52 1500 0.51 0.5 0.49
Fig. 5 displays graphically the request rejection rate for the three different models shown in Table III. The figure shows that the rejection rate of the analytical and the SAN models closely match the ones provided by SoapUI. Another interesting result from the experimental analysis is the throughput. Throughput is computed by:
(6)
Fig. 6 shows the throughput as a function of users. As expected, the throughput decreases as the users are increased. The tps range reported by SoapUI is from 21 to 45 for an average of about 33, with a standard deviation of about 10. The average throughput is about 22.5, which means on average, 30% of the requests are rejected.
Figure 5. HTTP rejection rate.
Figure 6. Throughput based on virtual users (extracted
from soapUI).
Figure 7. Web services rate not serviced using SAN model.
The close approximate behavior of the SAN model, as shown in Fig. 5, allows for cases that are more difficult to replicate in real world, e.g. inducing failures in the application server (TJW activity in Fig.4). As an example, consider Fig.7 that shows the rate of failures due to HTTP rejections and web service failures. This
0 0.1 0.2 0.3 0.4 0.5 0.6 200 352 360 380 500 650 800 1200 Experimental model Analytical model
Number of virtual users
R eje ct io n rat e 0 5 10 15 20 25 30 200 350 352 354 360 370 380 400 500 600 650 700 800 1000 1200 1500
Number of simultanous users
Th ro u gh p u t 0 0.1 0.2 0.3 0.4 0.5 0.6 0 0.0 1 0.0 4 0.0 8 0.1 2 0.1 6 0.2 0.24 0.28 0.32 0.36 0.4 0.44 0.48 0.52 Failure rate
Total unsuccessful rate (HTTP rejections + failures) HTTP rejection rate
Web service failure probability
R at e o f we b se rv ic es no t s er vi ce d
figure assumes the experiment with 354 simultaneous users with the same arrival rate and average response time shown in Table II. Rrunning the SAN model with different web service failure probabilities produces the rejection rate of about 3%. But the rate of successful web services is greatly impacted if the web service failure probability is greater than 4%. These probabilities are set by changing case 2 of TJW activity (see Table 1). Although TJW is the activity rate of the web services deployed, we are assuming the application server might fail to service some accepted requests but those web services do not cause the server to fail. Otherwise a failure in the server would require the removal of all requests from Start and restart of the server.
IV. FUTURE WORK
This study has concentrated on estimation of HTTP rejections. The research treated the application server software as a black box and showed that the SAN simulation model closely matches the experiment results. The current research is investigating a white-box approach (Fig. 8) in that a hierarchical SAN model is being created with submodels for the web server (Tomcat), the application server (JBoss), the database, and the web service itself. Since the correctness of the black-box approach has been verified through real test cases, the black-box results can be used to validate the hierarchical approach in that the white-box strategy ought to produce performance similar to those shown in this research. The white-box approach allows for finer granularity of analysis such as the impact of sensitive components on the overall reliability of the system that is otherwise not possible in the black-box approach.
Figure 8. Architecture of JBoss, showing the interaction between
layers and shared resource.
V. CONCLUSION
This study has emphasized on the combination of load testing and simulation modeling to predict rejections of HTTP requests in a banking web service deployed in JBoss. The analytical and the SAN models developed utilize the parameters extracted from the load tests, such as average response time and arrival rate in order to predict the rejection rate of HTTP requests. The accuracy
of the models is validated by comparing the results of the models against those of the experimental ones.
ACKNOWLEDGMENT
This research is funded in part by Department of Defense (DoD)/Air Force Office of Scientific Research (AFOSR), NSF Award Number FA9550-07-1-0499, under the title “High Assurance Software”.
REFERENCES
[1] M.N. Huhns, “Service-oriented computing: Key concepts and
principles”, IEEE Internet Computing, pp. 75-81, Jan-Feb 2005.
[2] World Wide Web Consortium, http://www.w3.org/.
[3] S. S. Gokhale, P. J. Vandal, J. Lu, “Performance and reliability
analysis of web server software architectures”, 12th Pacific Rim
Int’l Symp on Dependable Computing , 2006.
[4] R. C. Cheung, “A user-oriented software reliability model”, IEEE
Trans on Soft Eng, vol. 6, no. 2, pp. 118–125, 1980.
[5] K. Goˇseva–Popstojanova, K. Trivedi, “Architecture–based
approach to reliability assessment of software systems”, Performance Evaluation, vol. 45, pp.179-204, 2001.
[6] M. Rahmani, A. Azadmanesh, H. Siy, “Architecture-based
reliability analysis of web services in multilayer environment”,
PESOS workshop, 33rd Int’l Conf on Soft Eng, 2011.
[7] B. Zhou, K. Yin, S. Zhang, H. Jian, A.J. Kavs, “A tree-based
reliability model for composite web service with common-cause failures”, R.S. Chang et. al (Eds.), LNCS 6104, pp. 418-429, 2010.
[8] D. Zhong and Zhichang Qi, “A Petri net based approach for
reliability prediction of web services”, LNCS 4277, pp. 116-125, 2006.
[9] F. Souza, R. Arteiror, N. Rosa, P. Maciel, “Using stochastic Petri
nets for performance modelling of application servers”, Proc of
5th Int’l Work. on Performance Modeling, Evaluation and
Optimization of Parallel and Distributed Systems, IEEE IPDPS, pp. 1-8, 2006.
[10] H. Singh, V. Cortellessa, B. Cukic, E. Guntel, and V. Bharadwaj,
“A bayesian approach to reliability prediction and assessment of component based systems”, Proc. 12th Int’l Symp on Software Reliability Engineering, pp. 12–21, 2001.
[11] A. Filieri, C. Ghezzi, G. Tamburrelli, “Run-time efficient
probabilistic model checking”, Int’l Conf Soft Eng, pp. 21–28, 2011.
[12] X. Xiao, T. Dohi, “Estimating the error rate in an Apache web
server system”, Int’l J of Soft Eng and Its Applications, vol. 4, no. 3, 2010.
[13] R. D. van der Mei, R. Hariharan, P. K. Reeser, “Web server
performance modeling,” Telecommunication Systems, vol. 16, no. 3/4, pp. 361-378, 2001.
[14] J. Cao, M. Andersson, C. Nyberg, M. Kihl, “Web server
performance modeling using an M/G/1/K*PS queue”, Proc of 10th Int’l Conf on Telecommunications , pp. 1501- 1506, 2003.
[15] Z. Zheng, M. R. Lyu, “Collaborative reliability prediction of
service-oriented systems”, Proc of 32rd Int’l Conf in Soft Eng, 2010.
[16] K. Goseva-Popstojanova, M. Hamill, and R. Perugupalli, “Large
empirical case study of architecture-based software reliability,” Proc Int’l Symp Software Reliability Eng, pp. 43-52, 2005.
[17] JBoss Application Server, http://www.jboss.org/jbossas/.
[18] The Duke’s Bank Application, http://download.oracle.com/
javaee/1.4/tutorial/doc/Ebank.html.
[19] Wireshark, http://www.wireshark.org/.
[20] SoapUI, http://www.soapui.org/.
[21] W.H. Sanders, J.F. Meyer, “Stochastic activity network: Formal
definition and concept”, LNCS, vol. 2090, pp. 314-343, 2001.
[22] Mobius, https://www.mobius.illinois.edu/.
Web
Server Application Server Web service DB SOAP/HTTP Request Configuration parameters SOAP/HTTP Response
Resource release Resource allocation Http thread pool EJB pool DB connection pool