Winners and Losers from World Agricultural Trade Liberalisation
25
0
0
Full text
(2)
(3) EUROPEAN UNIVERSITY INSTITUTE, FLORENCE ROBERT SCHUMAN CENTRE FOR ADVANCED STUDIES. Winners and Losers from World Agricultural Trade Liberalisation SUSAN SENIOR NELLO. EUI Working Paper RSCAS 2007/18.
(4) This text may be downloaded only for personal research purposes. Additional reproduction for other purposes, whether in hard copies or electronically, requires the consent of the author(s), editor(s). Requests should be addressed directly to the author(s). If cited or quoted, reference should be made to the full name of the author(s), editor(s), the title, the working paper, or other series, the year and the publisher. The author(s)/editor(s) should inform the Robert Schuman Centre for Advanced Studies at the EUI if the paper will be published elsewhere and also take responsibility for any consequential obligation(s).. ISSN 1028-3625. © 2007 Susan Senior Nello Printed in Italy European University Institute Badia Fiesolana I – 50014 San Domenico di Fiesole (FI) Italy http://www.eui.eu/RSCAS/Publications/ http://cadmus.eui.eu.
(5) Robert Schuman Centre for Advanced Studies The Robert Schuman Centre for Advanced Studies (RSCAS), directed by Stefano Bartolini since September 2006, is home to a large post-doctoral programme. Created in 1992, it aims to develop inter-disciplinary and comparative research and to promote work on the major issues facing the process of integration and European society. The Centre hosts major research programmes and projects, and a range of working groups and ad hoc initiatives. The research agenda is organised around a set of core themes and is continuously evolving, reflecting the changing agenda of European integration and the expanding membership of the European Union. Details of this and the other research of the Centre can be found on: http://www.eui.eu/RSCAS/Research/ Research publications take the form of Working Papers, Policy Papers, Distinguished Lectures and books. Most of these are also available on the RSCAS website: http://www.eui.eu/RSCAS/Publications/ The EUI and the RSCAS are not responsible for the opinion expressed by the author(s)..
(6)
(7) Abstract This paper aims at showing the role of agriculture in determining many of the controversies and problems of the current phase of globalisation. This first entails presenting key statistics indicating the main developments in world agricultural trade, illustrating how there has been a relative deterioration of the export performance of developing countries. The Doha Development Agenda of the World Trade Organisation (WTO) is then analysed, indicating the positions of the main actors involved as this illustrates the perceived vulnerabilities and opportunities arising from agricultural trade liberalisation. The final part of the article provides a survey of the main estimates of the impact of agricultural trade liberalisation, and tackles the issue of those countries, sectors and households that might be adversely affected by the process. In particular, the paper will attempt to illustrate how the possible negative consequences of the failure of the Doha Round could be overcome.. Keywords world agricultural trade; agricultural trade liberalisation; The CAP and WTO; Doha Development Agenda.
(8)
(9) Introduction* During the past few decades agriculture has followed the general pattern of rapid integration of the world economy, with global trade in agriculture rising far faster than world agricultural production. Over this period the structure of world agricultural trade has changed, with the share of developed countries in global agricultural exports increasing, while that of developing countries has declined. In contrast the percentage of developing countries in world imports of agricultural products rose over the past four decades.1 This relative deterioration in the agricultural export performance of the developing world is frequently attributed to the protectionism of developed countries. The suspension of the Doha Development Agenda (DDA) of World Trade Organisation (WTO) negotiations in July 2006 was, therefore, said to be of particular concern to the least developed countries (LDCs). Though negotiations were resumed in February 2007, the prospect of reaching consensus is far from being a foregone conclusion. As its name suggests, at least in theory, the Doha ‘Development’ Agenda was intended to further the interests of developing countries. As will be shown here, many empirical studies of world trade show that a successful outcome to the Round would have a positive impact on overall economic welfare, including that of most developing countries. The results of these studies vary considerably, but each shows that in all countries there will be some sectors and households that gain and others that lose. The aim here is discuss the issue of winners and losers from agricultural trade liberalisation. This will first entail presenting key statistics indicating the main developments in world agricultural production and trade. Then follows a brief description of the agriculture negotiations in the Doha Round indicating the positions of the main actors (including the various groupings of developing countries) as this illustrates the perceived vulnerabilities and opportunities arising from agricultural trade liberalisation. A third and final part of the article will provide a survey of the main estimates of the impact of agricultural trade liberalisation, and will tackle the issue of those sectors and households that might be adversely affected by the process. In particular, the paper will attempt to illustrate how the possible negative consequences of the failure of the Doha Development Agenda could be overcome.. Trends in Agriculture and Trade Though the link between trade, poverty and food security is complex,2 and beyond the scope of the present discussion, agriculture is often the economic driving force in many LDCs, with agricultural. *. This paper was written during the author’s time as a Visiting Fellow at the Robert Schuman Centre for Advanced Studies, EUI, from September to December 2006. The author would like to thank the members of their Centre for their support during that time. She would also like to thank Pompeo della Posta, Alberto Chilosi, Mario Nuti and various participants at the Conference, ‘Interpreting Globalization: European Perspectives’, European University Institute, 6-7 October 2006 for comments on an earlier version of this paper. The usual disclaimer, of course, applies.. 1. FAO (2006) classifies some 165 countries as ‘developing’.. 2. Trade liberalisation may affect development through various channels including the price and availability of goods, factor prices, government transfers, incentives for innovation and investment, the terms of trade and short-term risk (Winters, McCulloch and McKay, 2004). FAO (2006) provides an example of the complexity of the trade-poverty-food security nexus. A first linkage occurs at the border with the effect of trade liberalisation on prices. A second linkage relates to how the changes in prices are transmitted from the border to producers, consumers and households in general in local markets. The degree of price transmission can vary considerably even within a single country. The first round of price effects may subsequently be altered substantially as production, consumption and employment of factors is adapted to the changing relative prices. As a result, the extent to which trade affects poverty and food security will depend on the specific characteristics of the country.. EUI-WP RSCAS 2007/18 © 2007 Susan Senior Nello.
(10) Susan Senior Nello. growth providing the key to poverty reduction. The economic importance of agriculture in world trade and GDP has been declining, but in developing countries agriculture still accounts for about a quarter of output (Primo Braga and Brokhaug, 2006). While in developed countries only 6 per cent of the economically active population was in agriculture in 2004, in developing countries the share was 53 per cent, rising to over 80 per cent in some countries. 3 According to FAO (2006), over the past four decades the share of developed countries in global agricultural exports has increased. The EU is responsible for most of this increase with its share of total agricultural exports increasing from slightly more of 20 per cent of agricultural exports in the early 1960s to more than 40 per cent in 2003. A large part of this increase was accounted for by intraEU trade, which now amounts to about 30 per cent of world agricultural trade. The share of developing countries in world agricultural exports fell from 40 per cent in the early 1960s to 25 per cent in the early 1990s before increasing to about 30 per cent now. Most worrying is what the FAO (2006), describes as ‘the gradual marginalisation’ of Sub-Saharan Africa on international agricultural export markets with the region’s share of global agricultural exports declining gradually from almost 10 percent four decades ago to some 3 percent today. On the import side all developing country regions have seen their share in world agricultural imports increase over the past four decades, with Sub-Saharan Africa being the only exception. As a whole, developing countries have moved from a positive net agricultural trade position to a situation in which agricultural exports and imports have roughly balanced. Exports of processed agricultural products have been expanding and now account for almost half of global agricultural trade (FAO, 2006). For the LDCs the share of processed products in total agricultural trade was lower than for the rest of the world and until the second half of the 1990s this share was declining (FAO, 2006). Table 1 indicates the main agricultural exporters and importers in the world.4 The main EU exports include alcoholic beverages, wine, food preparations, beer, pork and cheeses, which helps to explain the concern of the EU with international recognition of geographical indications. US exports remain concentrated in bulk commodity products such as soybeans, maize, wheat and cotton, and these products obtain 90% of US agricultural commodity support. China moved from being a net exporter of agricultural products in 2002 to a situation of rough balance in 2003 and net imports in 2004, largely as a result of the rapid increase in imports of raw cotton. India is a relatively small net importer of agricultural products, with exports of tropical and specialised products, and imports of basic necessities and cotton. Australia, Brazil, Argentina and New Zealand are net exporters, with Australia probably being the most active advocate of free trade.. (Contd.) Assessment of the extent to which trade liberalisation can alleviate poverty, therefore, either requires detailed data on households in developing countries (see, for example, Tangermann and Ash, 2006), or makes use of poverty elasticities. However, as Bouet (2006) explains, poverty elasticities are based on weak assumptions and generally present the relation between trade and poverty in an over-simplistic way. For example, trade liberalisation is likely to increase prices, stimulate production and raise unskilled wages. Typically in the calculation of poverty elasticities the higher unskilled wages are assumed to lead to an automatic and proportional reduction in the number of poor people. This type of approach fails to take account of the contrasting effects of trade liberalisation on different households and countries also described in the paper here. 3. For example, in Malawi, Ethiopia, Guinea, Mozambique, Burkina Faso, Burundi, Rwanda and Niger. This data is taken from FAO (2006).. 4. The statistics in this section are taken from European Commission (2006).. 2. EUI-WP RSCAS 2007/18 © 2007 Susan Senior Nello.
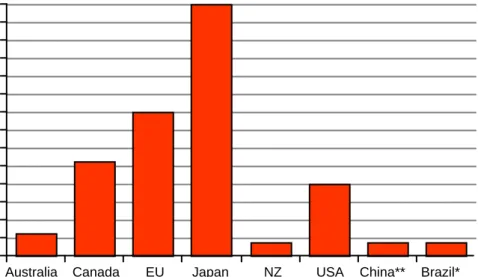
(11) Winners and Losers from World Agricultural Trade Liberalisation. Table 1: Leading exporters and importers of agricultural products Exporters. 1980. 1990. 2004. Importers. 1980. 1990. 2004. EU (25). 44.0. EU (25). 44.6. extra-EU (25) exports. 10.0. extra-EU (25). 12.9. United States. 17.0. 14.3. 10.2. United States. 8.7. 9.0. 10.5. Canada. 5.0. 5.4. 6.3. Japan. 9.6. 11.5. 10.4. Brazil. 3.4. 2.4. 3.9. China. 2.1. 1.8. 5.1. China. 1.5. 2.4. 3.1. Canada b. 1.8. 2.0. 2.3. Australia. 3.3. 2.8. 2.8. Russian Federation a. Thailand a. 1.2. 1.9. 2.1. Korea, Republic of. 1.5. 2.2. 1.9. 1.8. Mexico a, b. 1.2. 1.2. 1.8. Russian Federation a. 1.9. Malaysia. 2.0. 1.8. 1.7. Hong Kong, China, retained imports. 1.0. 1.0. 0.8. Indonesia. 1.6. 1.0. 1.6. Taipei, Chinese. 1.1. 1.4. 1.1. New Zealand. 1.3. 1.4. 1.6. Switzerland. 1.2. 1.3. 0.9. Mexico a. 0.8. 0.8. 1.5. India a. 0.5. 0.4. 0.9. Chile. 0.4. 0.7. 1.2. Malaysia. 0.5. 0.5. 0.8. India a. 1.0. 0.8. 1.1. Indonesia. 0.6. 0.5. 0.8. Thailand. 0.3. 0.7. 0.8. Notes: a Includes Secretariat estimates. b Imports are valued f.o.b. Source: www.WTO.org. A central issue in agricultural trade negotiations is the need to compare levels of support to farmers. A widely accepted measure of the level of public support for agriculture is the Producer Support Estimate or PSE. The PSE sums up the monetary value of government interventions that result in financial transfers from consumers and taxpayers to support agricultural producers. When expressed as a percentage of total farm receipts the PSE allows comparisons of the extent of support across countries and commodities. Each year the OECD publishes estimates of PSEs for its member states, selected third countries and by commodity. In 2005 the provisional estimated PSE amounted to 32 per cent of total farm receipts for the EU, 16 per cent for the US, 56 per cent for Japan and 5 per cent for Australia (see also Figure 1).. EUI-WP RSCAS 2007/18 © 2007 Susan Senior Nello. 3.
(12) Susan Senior Nello. Figure 1: Producer Support estimate by selected country Transfers to farmers as a per cent of value of gross farm receipts Provisional data for 2005.. 56 52 48 44 40 36 32 28 24 20 16 12 8 4 0 Australia. Canada. EU. Japan. NZ. USA. China**. Brazil*. Notes: *2004 **2003 Source: OECD (2006). The Doha Development Round The GATT (General Agreement on Tariffs and Trade) came into operation in 1948 with the aim of providing a framework for international trade negotiations, and attempts to regulate world trade. The WTO replaced the GATT from 1995,5 and by 2007 it had 150 members. Typically, GATT/WTO efforts to liberalise world trade proceed in successive ‘rounds’ of negotiations. The Uruguay Round (1986-94) was the eighth such round to be completed. Following the failure at Seattle in 1999, the Doha Round was launched in 2001 with a mandate for negotiations on a range of subjects, including agriculture. In 2003 at Cancún in Mexico negotiations on the Doha Round were suspended. Though there were differences over agriculture, the reason for the deadlock was differences over the so-called Singapore Issues (investment rules, competition, trade facilitation, and transparency in government procurement). Antagonism arose between developing and developed countries, and though the former have differing interests, they remained relatively united in their attacks on developed countries for the use of export subsidies (mainly the EU) and subsidies to farmers. After Cancún formal negotiations were ‘discontinued’ for a few months. Thanks also to the work of the chairman for agricultural negotiations, Tim Groser, in July 2004 consensus was reached on a framework agreement for continuing negotiations. At Hong Kong in December 2005 a further attempt was made to narrow differences, and a timetable was set with the goal of completing negotiations by the end of 2006. In June/July 2006 the timetable envisaged consensus being reached on ‘modalities’ or template agreements setting out the rules and procedures for liberalising trade. This should then have opened the path for agreeing on ‘schedules’ or the detailed commitments to which countries pledge themselves.. 5 4. See Senior Nello (2005) for a description of the differences in function between the GATT and WTO.. EUI-WP RSCAS 2007/18 © 2007 Susan Senior Nello.
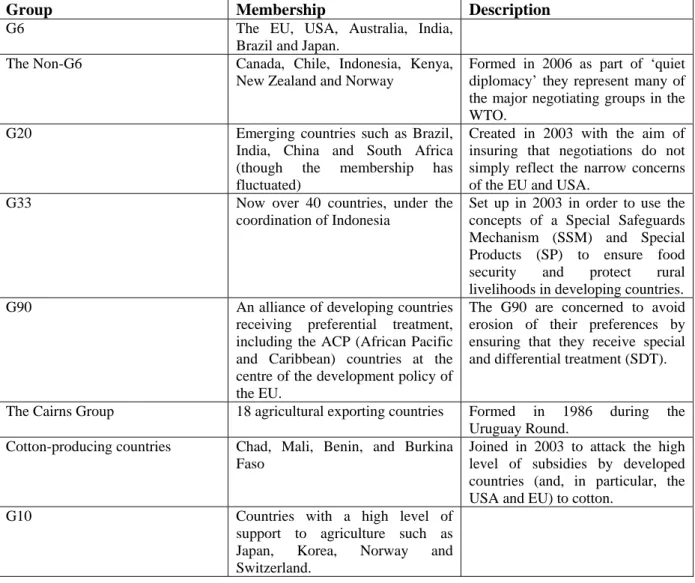
(13) Winners and Losers from World Agricultural Trade Liberalisation. One of the threats hanging over the Doha Round is that Fast Track, or the Trade Promotion Authority of President Bush expires in June 2007. Fast Track binds Congress to voting on trade agreements without amendment, and is considered necessary to prevent the agreement becoming subsequently unravelled.. Actors in the Doha Round The Doha Round differed from the Uruguay Round in the more active participation of developing countries, and the emergence of various more-or-less formal alliances of groups of countries.6 These groups reflect the differing interests and vulnerabilities of WTO members, and Table 2 sets out some of the main groups. Table 2: The Actors in the Doha Round: Some of the Main Groups of Country Group. Membership. G6. The EU, USA, Australia, India, Brazil and Japan. Canada, Chile, Indonesia, Kenya, New Zealand and Norway. The Non-G6. G20. G33. G90. The Cairns Group. Emerging countries such as Brazil, India, China and South Africa (though the membership has fluctuated) Now over 40 countries, under the coordination of Indonesia. An alliance of developing countries receiving preferential treatment, including the ACP (African Pacific and Caribbean) countries at the centre of the development policy of the EU. 18 agricultural exporting countries. Cotton-producing countries. Chad, Mali, Benin, and Burkina Faso. G10. Countries with a high level of support to agriculture such as Japan, Korea, Norway and Switzerland.. 6. Description Formed in 2006 as part of ‘quiet diplomacy’ they represent many of the major negotiating groups in the WTO. Created in 2003 with the aim of insuring that negotiations do not simply reflect the narrow concerns of the EU and USA. Set up in 2003 in order to use the concepts of a Special Safeguards Mechanism (SSM) and Special Products (SP) to ensure food security and protect rural livelihoods in developing countries. The G90 are concerned to avoid erosion of their preferences by ensuring that they receive special and differential treatment (SDT).. Formed in 1986 during the Uruguay Round. Joined in 2003 to attack the high level of subsidies by developed countries (and, in particular, the USA and EU) to cotton.. For lists of the members of these various groups see the WTO website, www.wto.org.. EUI-WP RSCAS 2007/18 © 2007 Susan Senior Nello. 5.
(14) Susan Senior Nello. The suspension of the Doha Round Before the Uruguay Round, largely at US request, agriculture had never been included in GATT/WTO negotiations in more than a marginal way. The agricultural negotiations of the Uruguay Round, and subsequently of the Doha Round, were centred on three main pillars: •. market access,. •. domestic support, and. •. export competition policies.. Special and Differential Treatment (SDT) for developing countries was to be an integral part of the negotiations. The EU, backed by countries such as Japan and South Korea, had been arguing that the agricultural negotiations should take account of the ‘multifunctional’ role of farmers in protecting the environment and countryside, and in promoting food quality and safety, rural development and animal welfare. As a result, in the Doha Round it was agreed to take note of such ‘non-trade concerns’. During the Doha Round other questions were raised in the agricultural negotiations such as the cotton issue (see Table 2), and whether geographical indications should be protected at an international level, but the three pillars were to prove the real stumbling block. Until agreement was reached on this ‘triangle’ it was generally agreed that no progress could be made on other issues such as non-agricultural market access (NAMA). Although for a long time the main obstacle to reaching agreement appeared to be the reluctance of the EU to improve its offer on market access, many agree that the major cause for the collapse of negotiations in July 2006 was US resistance to cuts in its farm subsidies. Large emerging countries such as India and Brazil pushed for reductions in farm tariffs and subsidies in developed countries, but failed to meet the corresponding requests for improved access to their markets for services and industrial goods. In June 2006 with a view to reaching agreement the Director General of the WTO, Pascal Lamy, launched the famous slogan 20/20/20. This called for the USA to cap its subsidies to agriculture at $20 billion, for emerging countries such as India and Brazil to place a ceiling of 20 per cent on industrial tariffs, and for the EU to accept the proposal of the G-20 with regards to reductions in agricultural tariffs (an average cut in tariffs by 54 per cent). Crawford Falconer, who chaired the farm negotiations, presented a draft proposal for a potential agreement, but the 74-page document contained 760 square brackets indicating points on which consensus had yet to be reached. Differences in EU and US policies are behind their contrasting approaches in the WTO agricultural negotiations, so a brief description of the agricultural policies of these two major actors is therefore useful before discussing some of the main differences between the parties on the ‘triangle’ of agricultural trade negotiations. The difficulty of both the EU and USA in improving their offers in the agricultural negotiations reflects the strength of the farm lobbies and biases in the political systems in favour of agricultural interests on both sides of the Atlantic. Though beyond the present scope, a large literature has developed explaining this phenomenon, and is reviewed, for instance, in Senior Nello (1997), or Swinnen and van der Zee (1993).. EU and US Agricultural Policies The traditional Common Agricultural Policy (CAP) of the EU relied heavily on a system of price support. The high and stable prices encouraged surpluses that either had to be held in public storage or sold on world markets with export subsidies. For many years the high EU agricultural prices were. 6. EUI-WP RSCAS 2007/18 © 2007 Susan Senior Nello.
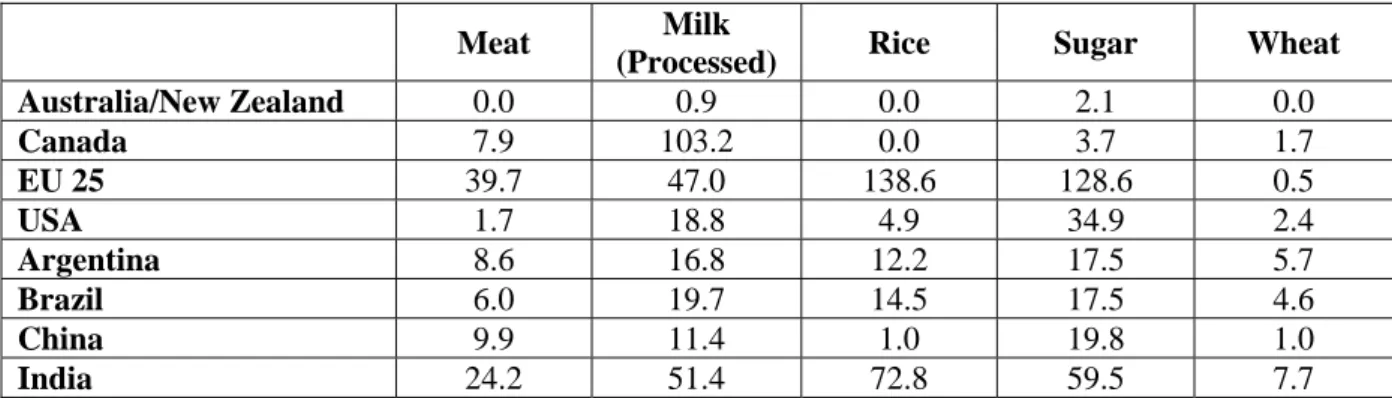
(15) Winners and Losers from World Agricultural Trade Liberalisation. isolated from world prices by variable import levies,7 but as a result of the Uruguay Round Agreement these were converted into tariffs from 1995. The system of price support weighed heavily on the EU budget; caused huge transfers from consumers to farmers; encouraged intensive production methods with negative implications for the environment, and favoured larger farmers. From the early 1990s the need to reform the CAP became more urgent with the prospect of EU enlargement, and the need to reach agreement in the Uruguay Round and subsequently Doha Round. Reforms of the CAP were therefore introduced in 1992, 1999 and 2003. The general direction of these reforms consisted in a reduction of price support, and the introduction of direct aids to farmers in the form of payments per hectare or per animal. Receipt of these direct aids was rendered increasingly conditional on realising environmental, food-safety and animal-welfare objectives, and, in the 2003 reform, on the requirement to keep all farmland in good agricultural and environmental condition. By 2004 direct aids accounted for 62 per cent of EU agricultural spending. The 2003 reform envisages the introduction of a single farm payment to most EU farmers that would be independent (i.e. decoupled) from production. In other words farmers would receive this payment whether they continued to produce or not. In its simplest form this payment would be based on a reference amount of the annual average of what the farmer received during the 2000-2002 period. Member states wanting to reduce the risks of abandonment of production could continue to pay limited per hectare payments for production of certain arable crops, and some premia per head of animal (partial decoupling). The single payments would be introduced from 2005, but if necessary member states could delay their introduction to 2007. Decoupled support is considered to have the advantage of causing less distortion of international trade.8 Despite these reforms, as Table 3 shows, EU agricultural tariffs remain relatively high, also when compared with those of the USA. Table 3 Average tariffs applied on selected major agricultural products (per cent), 2005 Meat Australia/New Zealand Canada EU 25 USA Argentina Brazil China India. 0.0 7.9 39.7 1.7 8.6 6.0 9.9 24.2. Milk (Processed) 0.9 103.2 47.0 18.8 16.8 19.7 11.4 51.4. Rice. Sugar. Wheat. 0.0 0.0 138.6 4.9 12.2 14.5 1.0 72.8. 2.1 3.7 128.6 34.9 17.5 17.5 19.8 59.5. 0.0 1.7 0.5 2.4 5.7 4.6 1.0 7.7. Source: Bouët (2006b). In the USA the 1996 FAIR (Federal Agriculture Improvement and Reform) Act introduced mechanisms similar to those of the CAP reforms in an attempt to increase the market orientation of US agriculture and reduce trade distortion. A system of production flexibility contract payments was introduced. These were decoupled from the current market situation and based on the amount of commodity support farmers had received in the past. The Act envisaged these payments as being fixed. 7. See Senior Nello (2005) for a description of this system.. 8. In contrast traditional EU price support was ‘coupled’ to the level of production, and required restricted market access and export subsidies to dispose of surpluses. There is, however, much debate about how far in practice decoupled support in fact influences production decisions (see FAO, 2006, p.32).. EUI-WP RSCAS 2007/18 © 2007 Susan Senior Nello. 7.
(16) Susan Senior Nello. and declining over time. As in the CAP reforms the aim of the 1996 FAIR Act was to move from price to income support for farmers. In practice the implementation of the FAIR Act was very different from initially foreseen as a result of the operation of its safety net clause. The Act entailed that special relief/emergency measures could be given to farmers if the agricultural sector encountered economic difficulties. At the time world prices were at record levels and the significance of the safety net was underestimated. Two years later world agricultural prices had fallen and the first of the relief/emergency packages was introduced. Safety-net measures were implemented in the four successive years so soon became the norm. The reduction in farm spending over 7 years envisaged by the FAIR Act was not realised. In 2002 the Farm Security and Rural Investment Act (FSRIA) rendered permanent many of the emergency measures available under the FAIR Act and increased support to US farmers by an estimated 70 per cent over 10 years.9 Observers such as the European Commission accused the reform of backtracking on the attempt of the FAIR Act to introduce more decoupled forms of support. The FSRIA envisaged a complex array of agricultural policy instruments, but essentially the effect of many of these mechanisms was to increase government support to farmers when prices fell.10 Support was counter-cyclical in the sense that when agricultural prices fell, government payments to farmers increased. As a result, the 2002 reform meant that the production decisions of US farmers were based more on policy guarantees rather than market decisions. A new US farm bill has to be agreed in 2007, and the initial proposal entailed a shift in agricultural spending towards income support, limits on payments to large farmers and a roughly 20 per cent reduction in farm spending over the following five years. The suggested reforms met the immediate criticism of the US farm lobby and the Democratic majority in Congress.. The Three Pillars of Agricultural Trade Negotiations At the outset of the Doha Round, the reduction or elimination of export subsidies appeared one of the most difficult points on which to reach agreement. The EU accounted for 90 per cent of the value of export subsidies notified to the WTO over the 1995-2001 period (FAO, 2006). However, the CAP reforms of 1992, 1999 and 2003 reduced the need for EU export subsidies to dispose of surpluses. At the Hong Kong Ministerial Conference of December 2005 WTO members reached agreement on complete elimination of agricultural export subsidies by 2013. This also entailed the phasing out of covert forms of export competition such as certain aspects of the US foreign food aid programme, and of the Canadian and Australian foreign agricultural state-trade monopolies. On market access, as a result of the Uruguay Round almost all agricultural tariffs were bound (i.e. countries agreed not to increase tariffs above a specified rate). Non-tariff barriers in developed countries were converted into tariffs through a process known as ‘tariffication’, which had the benefit of increasing transparency. Tariff rate quotas allowed a specified quantity of imports at a lower tariff. Developed countries were committed to lowering their tariffs by 36 per cent over five years, with a minimum of 15 per cent, while developing countries agreed smaller reductions over a longer time period or set a maximum tariff level. A substantial shortcoming of the Uruguay Round was that the bound tariffs emerging from the agreement were high, and were often more than 100 per cent of the value of the product. While the. 9. www.europa.eu.int:comm/agriculture/external/wto/usfarm bill. The US Farm Bill – Questions and Answers.. 10 The measures include the Counter-Cyclical Payments to cover the difference between low commodity prices and target prices, the Milk Income Loss Contract operating on a similar basis, Loan Deficiency Payments that cover the difference between loan rates and market prices allowing farmers to sell at lower prices. The US government subsidises the cost of farm insurance against falls in prices or yields, generally on a crop-specific basis. There are also fixed direct payments similar to the decoupled payments of the EU.. 8. EUI-WP RSCAS 2007/18 © 2007 Susan Senior Nello.
(17) Winners and Losers from World Agricultural Trade Liberalisation. average tariff worldwide on industrial goods is 5 per cent that on agricultural products is 60 per cent.11 There also seems evidence of tariff escalation, or higher tariffs after processing for certain agricultural products such as sugar, rice and milk products (Bouët, 2006b). Typically countries actually apply tariffs that are well below the negotiated maximums (see Table 4). To drain the ‘water’ from bound tariffs and effectively improve market access, the tariff cuts agreed in the Doha Round would have to be substantial. Table 4 The difference between average and bound agricultural tariffs 2000-2002. EU USA Japan China Argentina Brazil All East Asia and Pacific developing countries All Latin American and developing countries South Asia developing countries Sub-Saharan Africa. Simple average applied tariff 19.8 5.0 24.2 15.7 12.1 12.2 17.0. Simple average bound tariff 22.5 6.6 48.4 15.8 32.3 35.5 48.6. 13.4. 59.2. 23.0. 100.9. 17.5. 74.6. Source:FAO (2006). The debate about the method and extent of cuts in agricultural tariffs was protracted, but it was agreed that tariff reductions should follow a ‘tiered’ or banded formula with products characterised by the height of initial tariff, and those in the higher tiers or bands experiencing the largest cuts. Agreement on the number of bands and amount of tariff reduction in each band still had to be reached as can be seen from Table 5, which sets out the draft proposal presented in June 2006 by the Chairman for the agricultural negotiations, Crawford Falconer. Table 5 Reductions in tariffs proposed by the Chairman for the agricultural negotiations, Crawford Falconer, in June 2006 Tariff reduction for developed countries Tariff reduction for developing countries Tariff ceiling Tariff ceiling for developing countries Sensitive products. Size of tariff. From 0 to 2030%. Reduction Size of tariff. 20-65% From 0 to 2050%. reduction 75-100% 150%. 15-65%. From 20-30% to 40-60% 30-75% From 20-50% to 40-100% 20-75%. From 40-60% to 60-90% 35-85% From 40-100% to 60-150% 25-85%. Over 60-90% 42-90% Over 60-150% 75-100%. 1-15% of tariff lines. 11 Opening address of Pascal Lamy, Twelfth Session of the Steering Committee, Parliamentary Conference on the WTO, 22 June 2006.. EUI-WP RSCAS 2007/18 © 2007 Susan Senior Nello. 9.
(18) Susan Senior Nello. In June 2006, as described above, Pascal Lamy suggested as an average reduction the 54 per cent proposed by the G20 emerging countries. The USA held out for an average reduction of 66 per cent. Peter Mandelson stated that the EU was prepared to improve on its previous formal offer of 39 per cent and that the member states had given him a license to offer a tariff cut only slightly below 54 per cent (51 per cent was mentioned unofficially). Certain member states, and notably France, subsequently denied this. For instance, at the St Petersburg G-8 Summit of July 2006 the President of the European Commission, Barroso, promised to hand EU negotiators a stronger bargaining mandate, but President Chirac maintained that Barroso had no power to dictate the terms of the WTO talks.12 A related question was how many exemptions should be allowed to the proposed tariff cuts through the particular arrangements for ‘sensitive’ and ‘special’ products, and the Special Safeguards Mechanism (which permits a block on surge of imports). The ‘special product’ category aimed at ensuring food security, livelihood security and rural development in developing countries. The G-33 emerging nations called for 20 per cent of products to be considered as ‘special’ (compared with the 5 per cent proposed by the USA), and on some calculations this world have permitted certain developing countries to exclude some 90 per cent of their agricultural imports from the obligation to improve market access. The EU wanted apply the category of sensitive product to exclude 8 per cent of all product lines (about 160 goods) from the obligation to improve market access, while the USA pushed for 1 per cent and the G10 more industrialised countries were in favour of 15 per cent. The US Trade Representative, Susan Schwab, referred to the concepts of sensitive and special products, and a Special Safeguard Mechanism as a ‘black box’ to minimise the effects of tariff cuts, and argued that no agreement was preferable to a ‘Doha lite’. The US farm lobby was adamant about receiving adequate improvements in market access for their exports in exchange for any US concessions in the agricultural negotiations. With regard to domestic support, policies are distinguished according to their potential to distort trade. The WTO classification of policies follows a traffic-light analogy: red measures must be stopped (but no agricultural policies are included in this category), amber box policies should slow down (by means of reduction), while green measures can go ahead. The amber box covers policies permitted within the limits agreed in international negotiations (such as export subsidies). Green box measures are said to be ‘decoupled’ from production, as they have a minimal effect on production and trade, and include training, research, environmental measures, payment for natural calamities and so on. Blue box measures refer just to agriculture, and are those temporarily allowed as a result of a EUUS deal during the Uruguay Round. They include support under ‘production-limiting schemes’ on the basis of acreage or animal numbers, and were initially designed to cover the EU direct payments to farmers following the 1992 CAP reform and the US deficiency payments. As a result of the Uruguay Round, countries pledged to reduce an Aggregate Measure of Support (AMS) that distorted trade and production (amber box),13 but the green and blue boxes were exempt from this obligation, as was support below a de minimis level.14 Most developing countries declared their agricultural support programmes under the de minimis category. One of the main difficulties in the Doha Round was the need to clarify what programmes and maximum support amounts could be covered by each of these exceptions. As a result of the CAP. 12 Dow Jones Newswires of 23/7/2006. 13 The AMS differs from the PSE described above in that it is calculated on the basis of a fixed world reference price while the PSE is calculated on the basis of actual producer and border prices. The PSE covers all transfers to farmers from agricultural policies while the AMS covers only amber box policies. 14 According to the de minimis rule, a developed country is not required to reduce product-specific support where support does not exceed five per cent of the total value of production of that product, or non-product specific support where such support is below 5 per cent of the total value of production. The equivalent percentages for developing countries are 10 per cent.. 10. EUI-WP RSCAS 2007/18 © 2007 Susan Senior Nello.
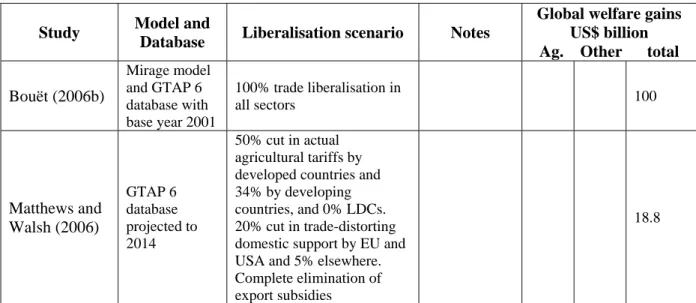
(19) Winners and Losers from World Agricultural Trade Liberalisation. reforms, many of the direct payments of the EU fall into the blue and green boxes. Many of the US measures introduced with the 2002 Farm Bill would be directly affected by tighter blue box and de minimis limits, so the USA seems likely to change the forms of support used with the 2007 Farm Bill. The draft proposal presented in June 2006 by the Chairman for the agricultural negotiations, Crawford Falconer, suggested a three-tiered formula for reduction in trade-distorting (amber box) support (see Table 6).15 Percentage reductions were also proposed for different tiers of total amber box, blue box and de minimis support. To avoid box-shifting, caps on support levels for specific commodities were proposed. The definition of the blue box would be modified and would include counter-cyclical payments of the type used by the USA. Many countries agreed that the blue box support should be below 2.5 per cent of the total value of agricultural production of a country. Green box criteria would be revised to ensure that such policies have minimal effects in distorting trade. Table 6 Reductions in domestic support proposed by the Chairman for the agricultural negotiations, Crawford Falconer, in June 2006 Amber box reduction. 70-83% if > 25 $ billion. Reduction in the amber+blue+de minimis Blue box ceiling de minimis. 70-80% if > 60 $ billion. 60-70% if between $15 and 25bn 57-35% if between $10 e 60bn. 37-60% if < 15 $bn 31-70% if < 10 $bn. 2,5% -50-80%of actual thresholds. The EU and many developing countries agreed that it was largely US intransigence on domestic support that prevented negotiations continuing. Compared with the ceiling of $20 billion in tradedistorting subsidies proposed by Pascal Lamy, the USA held out for a cap of $23 billion (though actual spending was only $19.7 billion). The spending limit of the proposed new Farm Bill presented in 2007 was $17 billion.. The Estimates of the Effects of Liberalising World Agricultural Trade There are various surveys of the impact of the liberalisation of world trade and global agricultural trade on economic welfare (see, for instance, those by Bouët (2006a and 2006b), Tangermann and Ash (2006), and FAO (2006)). The results of some of these studies are presented in Table 6, but the survey here is not intended to be exhaustive. As Bouët (2006a) points out, the estimates of the impact on welfare of the various studies display a considerable divergence (see Table 7). This is also the case for studies of how many people would be lifted out of poverty by total agricultural trade liberalisation, with estimates ranging 72 million (Anderson et al, 2005) to 440 million (Cline, 2004). Bouët (2006b) attributes such divergent results to differences in: •. Data. Though virtually all studies use GTAP (Global Trade Analysis Project)16 there are differences in treatment of, for example, market access and domestic support. For instance, estimates of the effects. 15 The WTO proposal was to reduce support over $25 billion by 70-83 per cent, support between $15-25 billion by 60-70 per cent and support of less than $15 billion by 37-60 per cent. See Draft Possible Modalities on Agriculture of 22 June 2006, www.wto.org. 16 GTAP was established in 1993 as a global network of researchers and policy makers concerned with the quantitative analysis of global economic issues and is based at Purdue University, Australia. The standard model used by the GTAP is. EUI-WP RSCAS 2007/18 © 2007 Susan Senior Nello. 11.
(20) Susan Senior Nello. of tariffs vary depending on the average used (trade-weighted or not); on whether bound or applied tariffs are taken into account (see Table 4 above), and on how far preferential schemes are considered. Most of the more recent studies use version 6 of GTAP, which includes more countries and regions, uses a base year of 2001, and takes account of preferential trade arrangements. •. Liberalisation scenarios. Studies vary according to whether liberalisation relates to all sectors, or simply agriculture (see column 3 of Table 7); whether the liberalisation refers to all distortions or just border measures; which countries liberalise and by how much etc. For instance, of the studies shown in the Table, Tangermann and Ash (2006) and Matthews and Walsh (2006) consider less radical liberalisation scenarios. The relatively low welfare gain resulting from the USDA (2001) simulation reflects the fact that only then WTO members were considered (and not China), the liberalisation is only for agriculture, and direct payments to agriculture are assumed to be decoupled. •. Behavioural parameters. Different elasticities are used, in particular, of price elasticities of exports and of Armington elasticities that measure the degree of substitutability between domestic goods and imported goods. •. Model structure. For instance, differences arise over assumptions of perfect or imperfect competition, the degree of factor mobility and the treatment of dynamic effects (and, in particular, of the link between openness and factor productivity, and the role of technology transfer). For example, Francois et al (2003) find relatively high welfare gains as they take into account increasing returns to scale. Similarly, the World Bank (2003) study indicates a substantial welfare increase as the improvement in allocation of resources is assumed to lead to investment in productivity-enhancing technology.17 Table 7 Results obtained in computable general equilibrium (CGE) studies of trade liberalisation Global welfare gains US$ billion Ag. Other total. Study. Model and Database. Bouët (2006b). Mirage model and GTAP 6 database with base year 2001. 100% trade liberalisation in all sectors. 100. GTAP 6 database projected to 2014. 50% cut in actual agricultural tariffs by developed countries and 34% by developing countries, and 0% LDCs. 20% cut in trade-distorting domestic support by EU and USA and 5% elsewhere. Complete elimination of export subsidies. 18.8. Matthews and Walsh (2006). Liberalisation scenario. Notes. (Contd.) a multi-region, multi-sector, computable general equilibrium model using the neoclassical assumptions of perfect competition, constant returns to scale and full employment (see Hertel (1997) and the GTAP web site www.gtap.agecon.purdue.edu). 17 However, Bouët (2006b) warns of the conceptual and empirical difficulties of econometric studies attempting to take into account the links between trade openness and the transmission of technology and factor productivity.. 12. EUI-WP RSCAS 2007/18 © 2007 Susan Senior Nello.
(21) Winners and Losers from World Agricultural Trade Liberalisation. Study Tangermann and Ash (2006) Anderson et al. (2005). Beghin et al. (2002). Model and Database GTAPEM GTAP database 2001 base year LINKAGE, dynamic GTAP database 2001 base year data LINKAGE, dynamic GTAP database 1997 base year data. Liberalisation scenario. Notes. 50% cut in domestic agricultural support and 50% cut in applied tariffs - all sectors and regions Elimination of domestic agricultural support and trade protection in all sectors. Dynamic version. Elimination of agriculture support and protection in high-income OECD countries. François et al. (2003). GTAP 1997 base year data. Hertel and Keeney (2005). GTAP 2001 base year data. OECD (2003). GTAP 1997 base year data. Tokarick (2005). GTAP 1997 base year data. UNCTAD (2003). GTAP 1997 base year data. 50% cut in applied agricultural tariffs. USDA (2001). CGE, dynamic. Elimination of domestic agricultural support and tariffs, all sectors. World Bank (2003). LINKAGE, dynamic 1997 base year data. Near 100% reduction in domestic agricultural support and applied tariffs. Elimination of tariffs, all sectors, all regions. increasing returns to scale, med. run increasing returns to scale, long run. Elimination of domestic agricultural support and tariffs — all sectors and regions Elimination of trade protection, all sectors Elimination of domestic agricultural support and trade protection Incorporates tariff preferences Static version Dynamic, productivity gains Static version Dynamic version#. Global welfare gains US$ billion Ag. Other total 26. 18. 44. 173. 105. 278. 108. n/a. n/a. 109. 107. *367.1 *670. 56. 28. 84. 34. 63. **174. 128. n/a. n/a. 20. n/a. n/a. 31 56. n/a n/a. n/a n/a. 193 358. 98 156. 291 518. *Includes gains from services liberalisation. ** Includes gains from trade facilitation. # takes account of investment in productivity-increasing technology Source: Tangermann and Ash (2006) updated to take account of more recent simulations. A similar table is presented in FAO (2006). Despite difficulties in comparison, certain general observations can be derived from these studies: World agricultural trade liberalisation entails the elimination of tariffs and of production and export subsidies. This removes distortions and leads to an improvement in the global allocation of resources.18 At the same time it reduces supply and increases the demand for agricultural products so raising world agricultural prices for many products.. 18 Typically these gains are expressed as an‘equivalent variation’, or the change in income that would be equivalent to the proposed policy change. The equivalent variation measures the potential change in welfare at the national level, but it does not consider distributive effects.. EUI-WP RSCAS 2007/18 © 2007 Susan Senior Nello. 13.
(22) Susan Senior Nello. Tariffs and subsidies are often higher in agriculture than in other sectors, so all studies indicate liberalisation of agricultural trade as a major contributor to the global welfare gains from overall trade liberalisation.19 Net food importing countries would experience a loss if the higher price for imports were not matched by an increase in their export prices. The picture is complicated by the fact that even within the agricultural sector distortions vary considerably according to product. World price rises from agricultural trade liberalisation are expected to be highest for wheat, meat, rice and sugar Bouët (2006b), and dairy products (Tangermann and Ash, 2006). According to Bouët (2006b), negative terms-of-trade effects would be experienced by some Middle East and North African countries, Mexico, Bangladesh, and China. Most studies suggest that tariffs are more harmful than subsidies for developing countries (see, for example, Tangermann and Ash, 2006), but the erosion of preferences means than tariff reduction would not benefit some of the poorest countries. Many of these have preferential access to the EU through the Cotonou Agreement and the Everything-but-Arms (EBA) initiative, and to the USA through the AGOA (Africa Growth and Opportunity Act) and the Caribbean Basin Initiative. Bureau et al. (2006) argue that these preferences are rather well used. Bouët (2006b) finds that with multilateral trade liberalisation preferences would be eroded for part of Sub-Saharan Africa, Mexico, Tunisia and Bangladesh, and that countries such as Australia or Brazil would be able to replace the preferential exports of Africa, the Caribbean or Andean countries. The benefit of elimination of export subsidies for developing countries may also be overestimated. According to Gallezot and Bernard (2004), EU export subsidies vary by product and destination and tend to be aimed at countries that are dependent on imports and represent a benefit to consumers in those countries. Some NGOs stress the impact of unfair competition for LDC producers, but, as Bureau et al (2006) argue, empirical studies suggest this is limited to certain products such as sugar, beef (for West Africa) and milk (India and Jamaica). The largest absolute gains from agricultural trade liberalisation would go to developed countries where markets are most distorted (FAO, 2006). However, most studies show that world trade liberalisation would be development-friendly with the share of gain to developing countries being well above their percentage of global GDP (Anderson and Martin, 2005). Some of the models (see, for example, Bouët, 2006b) assume imperfect competition and product differentiation and find that increased specialisation in agriculture by some countries as a result of trade reform may have a cost as there are less opportunities for economies of scale. According to Bouët (2006b), as a result of this mechanism, Argentina will lose from trade liberalisation, while Australia, New Zealand and Brazil will be negatively affected, but to a lesser extent. With liberalisation net economic returns to land, labour and capital in agriculture would fall in most developed countries with high initial levels of support, but increase in some developed and developing countries where support is low (Tangermann and Ash, 2006). As economic theory suggests, trade liberalisation can play a role in raising the wages of the unskilled and low skilled in developing countries, though the ability to take advantage of such opportunities depends on the policy environment created by their governments (FAO, 2006). Liberalisation can involve adjustment costs and increase short-term risk owing to competition from imports and reallocation of production factors. In developed countries safety nets are largely in place to compensate such developments, and care must be take not to slow down the adjustment process excessively. In developing countries additional mechanisms may be necessary to compensate the. 19 The study by Francois et al (2003) differs from the others in the high share of the total welfare gain coming from the liberalisation of non-agricultural sectors, but this can be explained by the more detailed treatment of these sectors (and, in particular, of services and trade facilitation), and the assumption of increasing returns to scale.. 14. EUI-WP RSCAS 2007/18 © 2007 Susan Senior Nello.
(23) Winners and Losers from World Agricultural Trade Liberalisation. losers. However, wide-scale recourse to ‘Special and Differential Treatment’ with high levels of protection for special products does not seem an answer as all studies indicate that a large share of the benefits would come from the liberalisation of developing-country markets (Anderson and Martin, 2005). According to many authors (see, for example, Bureau et al., 2006) the main reason for the poor agricultural trade performance of developing countries is not so much tariffs and the agricultural subsidies of developed countries, but rather sanitary and phytosanitary standards, and poor infrastructure. For instance, the tightening of EU regulations with regard to traceability, responsibility, and tighter hygiene procedures could render exporting from developing countries more difficult. Foreign direct investment may represent a means of improving food safety and quality, but is often not attracted to LDCs. The ‘Aid for Trade’, and trade facilitation initiatives recently announced in the WTO and EU frameworks could play a role here.20 Among the possible consequences of a collapse of the Doha Round is that the authority of the WTO would be undermined. The WTO might lose some of its legitimacy, and there would be a resort to regionalism with the further proliferation of regional and bilateral trade deals. These could reach about 400 by 2010, according to Lamy.21 Such regionalism is likely to lead to trade diversion,22 and is characterised by what Bhagwati (1994) termed the spaghetti-bowl phenomenon, caused by the overlapping of complex systems of trade concessions. According to Lamy, 23 a growing number of WTO members are party to 10 or more regional trade arrangements, most of which entail rules of origin to ensure that preferential treatment is given to partners and not to third countries. Businesses are required to adapt their products to satisfy the rules of origin of different markets, while customs officials have to assess the same product differently according to its origin. The result is complexity, administrative uncertainty, lack of transparency, and an addition to the costs of trade. Increased regionalism would also alter the power balance in the international arena. Typically regional organisations follow a hub-and-spoke pattern and so would tend to reinforce the authority of the largest players such as the EU and USA. As Baldwin (2006) argues, regionalism is here to stay and dealing with it could provide a means for the WTO to reinvent its role. As explained above, one of the main negative implications of regionalism is the proliferation of different rules of origin, though these are less important for the primary sector. The WTO could provide research and information of the likely consequences, and create a negotiating forum for the coordination and harmonisation of rules of origin. Though the WTO has begun work on this task, so far little progress has been made.24 In December 2005 it was agreed that the WTO should be notified on a voluntary basis of all new bilateral trade agreements. In consultation with the relevant parties, the WTO Secretariat would then prepare a systematic review of the agreement, including its implications for trade liberalisation and regulatory systems. In order to correct a possible increase in power asymmetry in a hub-and-spoke system of regional blocs, the WTO could also provide a forum for the smaller and/or economically weaker spoke countries to coordinate their positions and increase their bargaining power. In this way the WTO could continue working towards the multilateralisation of regionalism.. 20 See, for example, the recommendations of the WTO task force of 27 July, 2006. 21 Speech of 17/1/2007, Bangalore, India, www.wto.org. 22 See Senior Nello (2005) for an explanation of this effect. 23 Speech of 17/1/2007, Bangalore, India, www.wto.org. 24 Speech of Pascal Lamy of 17/1/2007, Bangalore, India, www.wto.org.. EUI-WP RSCAS 2007/18 © 2007 Susan Senior Nello. 15.
(24) Susan Senior Nello. References Anderson, K., W. Martin and D. van der Mensbrugghe (2005) ‘Market and Welfare Implications of Doha Reform Scenarios’ in Anderson, K. and Martin. W. eds. Anderson, K. and Martin. W. eds (2005) Agricultural Trade reform and the Doha Development Agenda, Washington, D.C., OUTP and the World Bank. Baldwin, R (2006) Multilateralising regionalism:Spaghetti bowls as building blocks on the path to global free trade, Centre for Economic Policy Research Discussion Paper No.5775, www.CEPR.org Beghin, J. C., Roland-Holst, D. and van der Mensbrugghe, D. (2002) ‘Global Agricultural Trade and the Doha Round: What are the Implications for North and South?’, Iowa State University Department of Economics, Staff General Research Papers 4080, http://www.econ.iastate.edu/research/webpapers/paper_4080 Bhagwati J. (1994) ‘Regionalism and multilateralism: An overview’, in de Melo, 1. and Panagariya, A. eds., New Dimensions in Regional Integration, Cambridge University Press, Cambridge. Bouët, A., Bureau, J.C., Decreux Y and Jean, S. (2004) Multilateral Agricultural Trade Liberalization: The contrasting fortunes of developing countries in the Doha Round, Working Paper, CEPII (Centre d’Etudes Prospectives et d’Informations Internationales, Paris. Bouët, A. (2006a) How Much Will Trade Liberalization Help the Poor? Comparing Global Trade Models, International Food Policy Research Institute IFPRI Research Paper 5, www.ifpri.org. Bouët, A. (2006b) What can the poor expect from trade liberalization? Opening the black box. MTID Discussion Paper No. 93. IFPRI, Washington, DC. Bureau, J.C., Jean, S and Matthews, A. (2005) Agricultural trade liberalisation: Assessing the consequences for the developing countries, paper presented at the XIth European Association of Agricultural Economists, Copenhagen, Denmark, August 24-27. Cline, W. R. (2004) Trade policy and global poverty, Institute for International Economics, Washington, DC. European Commission (2006) The agricultural trade developments of major WTO players, Monitoring Agri-trade Policy, No. 01/01, June. FAO (2006) The State of Food and Agriculture 2005, FAO, Rome, www.fao.org. Francois, J.F., van Meijl, H. and van Tongeren, F.W. (2003) Economic Benefits of the Doha Round for the Netherlands, report submitted to the Ministry of Economic Affairs, Directorate-General for Foreign Economic Relations, Netherlands. Gallezot, J. and Bernard, F. (2004) EU export subsidies on agricultural and agri-food products to Africa, The World Bank, www.worldbank.org. Hertel, T.W. and Keeney, R. (2005) ‘What’s at stake: the relative importance of import barriers, export subsidies and domestic support’, in Agricultural Trade reform and the Doha Development Agenda, K. Anderson and W. Martin eds. Matthews, A. and Walsh, K. (2006) The Doha Development Round: Mixed prospects for developing countries, IIIS Discussion Paper No. 157, June 2006, Department of Economics and Institute for International Integration Studies, Trinity College Dublin. OECD (2003) Doha Development Agenda: Welfare Gains from Further Multilateral Trade Liberalisation with Respect to Tariffs, TD/TC/WP(2003)10/FINAL.. 16. EUI-WP RSCAS 2007/18 © 2007 Susan Senior Nello.
(25) Winners and Losers from World Agricultural Trade Liberalisation. Primo Braga, C.A. and Brokhaug, K. (2006) Agriculture and the Doha Development Round, www.worldbank.org. Senior Nello (1997) Applying the New Political Economy Approach to Agricultural Policy Formation in the European Union, EUI Working Paper RSC No 97/21. European University Institute, Florence. Senior Nello, S. M. (2005) The European Union: Economics, Policies and History, McGraw Hill, Maidenhead, UK. Swinnen, J. and van der Zee, F.A. (1993) ‘The political economy of agricultural policies: A survey’, European Review of Agricultural Economics 20, pp 261-290. Tangermann, S. and Ash, K.(2006) Agricultural Policy and Trade Reform Potential Effects at Global, National and Household Levels, OECD, Paris, www.oecd.org. Tokarick, S. (2005) ‘Who Bears the Cost of Agricultural Support in OECD Countries?’, The World Economy, 28:4 573. UNCTAD (2003) Back to Basics: Market Access Issues in the Doha Agenda, United Nations, Geneva. US Department of Agriculture (USDA) (2001) The Road Ahead: Agricultural Policy Reform in the WTO, Summary Report, Agriculture Economic Report No. 797, Washington, DC: Economic Research Service, January. Winters, L.A. McCulloch, N. and McKay, A. (2004) ‘Trade liberalisation and poverty: The evidence so far’, Journal of Economic Literature 42, March. World Bank (2003) Global Economic Prospects: Realizing the Development Promise of the Doha Agenda, Washington, DC, www.worldbank.org.. Susan Senior Nello DEPFID, Facoltà di Economia “Richard Goodwin” Piazza San Francesco 7 53100 Siena Fax: +39 0577 232661 e-mail: senior@unisi.it. EUI-WP RSCAS 2007/18 © 2007 Susan Senior Nello. 17.
(26)
Figure

+4


Related documents
Anderson, K., 1998, Domestic agricultural policy objectives and trade liberalisation: synergies and trade-offs, COM/AGR/CA/TD/WS(98)101, in Proceedings of the OECD Workshop on
In this work trade liberalization is decompose into macroeconomic variables as thus agricultural degree of openness, agricultural capital formation, agricultural
Since the 1950s world agriculture has been characterised by the persistence of high agricultural protection in developed countries, by anti-agricultural and anti-trade policies
OECD (2003), Doha Development Agenda: Welfare gains from further multilateral trade liberalisation with respect to tariffs , OECD, Paris. Panaghariya (2004),
The long run effect of domestic agriculture trade liberalisation through tariff elimination on agriculture imports show that growth accelerates in the long run as total
Figure 4 illustrates the welfare effects of energy market reforms in the FSU in the case where internal production taxes and subsidies are removed, while trade barriers (import
Under a fixed exchange rate system, E*=O, the balance of trade changes in response to changes in protection in the agriculture and nonagriculture sectors and
This has varied e¤ects on sector productivity growth: in the case of restricted entry, a common trade liberalisation policy may induce a reduction in productivity growth in
