C
riminal
J
ustice
S
tatistical
A
nalysis
C
enter
Establishing the “Statistical Accuracy”
Establishing the “Statistical Accuracy”
Establishing the “Statistical Accuracy”
Establishing the “Statistical Accuracy”
Establishing the “Statistical Accuracy”
of Uniform Crime Reports (UCR) in
of Uniform Crime Reports (UCR) in
of Uniform Crime Reports (UCR) in
of Uniform Crime Reports (UCR) in
of Uniform Crime Reports (UCR) in
West Virginia
West Virginia
West Virginia
West Virginia
West Virginia
James Nolan, Ph.D. - West Virginia University
Stephen M. Haas, Ph.D. - Criminal Justice Statistical Analysis Center
Theresa K. Lester, M.A. - Criminal Justice Statistical Analysis Center
Jeri Kirby, M.A. - West Virginia University
Carly Jira, B.A. - West Virginia University
State of West Virginia
Department of Military Affairs & Public Safety Division of Criminal Justice Services
July 2006
Report Highlights
Report Highlights
Report Highlights
Report Highlights
Report Highlights
• The methodology introduced in this report offers a valid approach for assessing the statistical accuracy of UCR crime statistics in WV and the nation.
• Of the 31,084 reported crimes in the population, 1,297 were estimated to contain a classification error. • An estimated 4.17%of all records reported for the population of 12 law enforcement agencies in this study were misclassified.
• The UCR Part I crimes of aggravated assault, burglary, larceny, and robbery contained a statistically significant amount of classification error.
• A significant level of error was found for nonindex crimes such as simple assault/intimidation, unfounded offenses, and general incidents. • A great deal of overlap in classification error was found between some individual crimes such as aggravated-simple assaults and larceny-burglary offenses.
• Both the Violent Crime and Index totals for the state were significantly undercounted in reported UCR statistics.
• The Violent Crime Total for WV was undercounted by 22.49% compared to the Index Total at 2.35%. • The Property Crime Total for the state did not contain a significant amount of classification error at 0.18%.
• The differentiation between aggravated and simple assault crimes accounted for a disproportionate amount of classification error in reported UCR statistics in WV. • The inclusion of simple assault into Violent Crime and Index Totals reduced classification error for these categories to nonsignificant levels.
The Uniform Crime Reporting (UCR) Program is a national initiative involving more than 17,000 city, county, and state law enforcement agencies which voluntarily report crime data to the FBI (FBI, 2004).1 The main objective of the UCR Program is to generate a valid set of crime statistics for use in law enforcement administration, operation, and management.
Over the years, however, the information gathered and reported through the UCR Program has become a social indicator for the nation. The public looks to the statistics generated from the UCR Program for information on fluctuations in the level of crime. Meanwhile, criminologists, sociologists, legislators, municipal planners, the media, and other students of criminal justice use the statistics for varied research and planning purposes (FBI, 2004).
Such widespread use of UCR information has underscored the importance of ensuring its accuracy. While considerable attention has been focused on errors associated with victim reporting and missing data (Hart and Rennison, 2003; Maltz, 1999), few
studies have sought to ascertain the magnitude of error resulting from the erroneous classification of crimes. That is, few studies have assessed the amount of error found in crime totals due to the misclassification of crime types on the part of law enforcement officers and agencies. Classification error (or the misclassification of crime types) and the impact of this error on official UCR statistics provides the basis for this report.
It is anticipated that an understanding of classification error and its consequences for crime reporting will have notable implications for both state and federal UCR Program administrators. The identification of classification error and its sources may provide a basis for the modification of law enforcement training curricula. In addition, such information may lead to more accurate crime reporting as well as provide a means for adjusting future crime data based on known error.
This report seeks to assess the statistical accuracy of crime reporting in West Virginia. In this pursuit, however, a central purpose of this report is to introduce a methodology for
assessing the “statistical accuracy” of crime estimates produced by the UCR Program. Currently, no uniform method exists for identifying and assessing the impact of classification error in WV or the nation. Thus, this report applies an original methodology designed to examine classification error which may in turn influence how such assessments are conducted in other states and the nation.
In an effort to illustrate the merit of this methodology, this report utilizes a random sample of crimes reported to the UCR Program in WV. An analysis was conducted to identify the under- and overreporting of incidents across various crime types. Both the sources of classification error and the most common reasons for misclassifications are discussed. To begin, this report provides a brief overview of classification error and its impact on the accuracy of official crime statistics.
Assessing the Accuracy of
Assessing the Accuracy of
Assessing the Accuracy of
Assessing the Accuracy of
Assessing the Accuracy of
Crime Statistics
Crime Statistics
Crime Statistics
Crime Statistics
Crime Statistics
Since the inception of the UCR Program more than 70 years ago, police records have been the primary source of data in these national crime statistics. Although the quality of police records has often come into question, UCR has been found to be a valid indicator of the “index” crimes (Gove, Hughes, & Geerken, 1985).
It is well known, however, in the fields of criminology and criminal justice that UCR is a “statistical program,” meaning that it is not an actual accounting of all crimes. Nevertheless, UCR has been invaluable to police and criminologists alike in their efforts to understand the nature and extent of crime locally and nationally. Therefore, in spite of the fact that UCR is not a
strict accounting of all crimes, it remains a tremendously useful resource for gaining knowledge about crime.
As a result, the value of UCR is not contingent on FBI and state UCR program officials eliminating all errors in reported statistics. Instead, it is more important that the managers of the program understand these errors and make every attempt to measure them. By doing so, program managers will become more cognizant of the limitations in UCR and can begin to engage in efforts to improve the accuracy of crime reporting.
Toward this end, considerable attention in recent years has focused on errors that result from victims deciding not to report crimes and by the police electing not to recordthem (Bachman, 1993; Black, 1974; delFrate and Goryainov, 1994; Gove, Hughes, and Geerken, 1985; Greenberg and Ruback, 1987; Greenberg and Ruback, 1992; Schwind and Zenger, 1992; Shah and Pease, 1992; Skogan, 1976; Warner and Pierce, 1993; Wexler and Marx, 1986; White and Mosher, 1986). For example, in a study based on the 2000 National Crime Victimization Survey (NCVS), Hart and Rennison (2003) found that nearly 4 in 10 property crimes and 6 in 10 violent crimes were never reported to police. Hence, it is clear that not all crimes are reported to law enforcement and not all crimes are accounted for in official reporting. This type of error occurs at the input stage of the process and is due to nonreporting of crimes by victims and law enforcement.
On the other hand, error can also occur at the latter stages of the process. Recently, there has been an investment on the part of the U.S. Department of Justice to learn more about errors at the output stage (Maltz 1999). These errors
occur when state UCR programs and the FBI make decisions about how to deal with problems of missing data at the time of publication and reporting (Maltz, 1999). Multiple methods exist for dealing with problems associated with missing data. For instance, some jurisdictions may choose to not report missing data while others may produce estimates for missing data and adjust crime statistics based on those estimates. Missing information and the handling of such data is a common source for error found in the reporting of statistical data and is not unique to UCR statistics.
However, there have been no true systematic studies of classification errors in the UCR statistics. As a result, little is known about the degree to which classification error influences the statistical accuracy of crime statistics. Moreover, research has not progressed to the point of establishing a single methodology for assessing classification error in UCR data. For these reasons, the current study may not only assist UCR Program administrators in WV, but may have implications for how statistical accuracy is examined on a national basis. To provide a foundation for this study, the following discussion provides a brief description of classification error and why it is often present in crime statistics.
Classification Error:
Classification Error:
Classification Error:
Classification Error:
Classification Error:
Definition and Sources
Definition and Sources
Definition and Sources
Definition and Sources
Definition and Sources
A classification error occurs when the police officers record the facts of an incident correctly, but misclassify the crime type. For example, an “aggravated assault” that involves a weapon is sometimes recorded by the police as a “simple assault” when the victim is not seriously injured. Such a
crime classification may be correct for criminal prosecution, but not for “statistical” purposes. Given that this incident involved a weapon, it should be recorded as an aggravated assault.
Classification errors can occur for multiple reasons. Some of the most common sources of error include the inaccurate interpretation of UCR definitions, purposive actions on the part of law enforcement agencies to downgrade particular crimes, and faulty automation of police records.
First, error can occur when criminal definitions rather than UCR definitions are used by law enforcement officers to classify crimes. In some instances, UCR definitions are slightly different from state and local criminal laws and ordinances. In the absence of regular training to help police recognize these conflicting definitions and purposes (i.e., for “statistical gathering” versus “criminal investigations”), police may sometimes begin to apply criminal definitions when classifying crimes for statistical purposes.
Second, classification error has been found to be a result of conscious decision-making on the part of law enforcement agencies. As a matter of policy or practice, for instance, law enforcement officers may be encouraged to record some crimes as less serious offenses in order to keep the crime rate down. This source of error was discovered recently in the city of Philadelphia. For years, the Philadelphia Police Department had been downgrading certain major crimes to exclude them from official crime statistics. This long-standing practice of “going down with crime,” as referred to by police officers, resulted in that city reporting a much lower crime rate than
it actually had (McCoy, Matza, & Fazlollah, 1998).
Lastly, errors can occur at the point of automation or when automated systems are upgraded or revised. Automated systems are often programmed to allow for the automatic translation of reported crimes to UCR definitions. In these instances, reported crimes are automatically translated from state code to the UCR. These computerized systems can contain programming or algorithm problems that may result in the routine misclassification of reported offenses into erroneous UCR definitions or crime categories.
Regardless of the source, classification error can have a substantial impact on the statistical accuracy and interpretation of UCR crime estimates. To better understand how classification error can impact the accuracy of reported crime, the following discussion offers a description of two basic measures for accuracy in reported crimes.
Record Versus Statistical
Accuracy
Two types of accuracy must be considered when assessing the presence or absence of classification error in UCR statistics: record
accuracy and statistical accuracy. Record accuracy refers to the errors found in a particular record or group of records in a given crime type. This type of accuracy may be defined differently by police agencies for different purposes. In addition, record errors may or may not result in the misclassification of crime.
Consider the following: A review of larceny records for a particular
agency revealed that 3.00% of all larceny records contained a record error. Yet, only a fraction of this 3.00% actually resulted in a reclassification of UCR crime. This is because many of the record errors were discovered to be the result of slight discrepancies in the dollar amounts recorded for theft loss (i.e., incorrectly recorded as $400.00 as opposed to the actual amount of $450.00). Since a mistakenly reported dollar amount for theft loss does not change the fact that a theft was committed, it would not result in changes to UCR estimates for larceny-theft. Instead, this is record error that does not affect UCR statistics.
As it pertains to the accuracy of UCR statistics, record accuracy is of limited use. It only reflects the rate of error in a particular crime type. In the review of simple assault records, for instance, the only classification error that will be discovered are offenses that should have been something else, but were instead reported as simple assaults. As such, it captures only the type of errors that
inflate the crime in a particular crime category. In other words, it is simply the rate at which a crime is overreported.
Statistical accuracy, on the other hand, refers to the errors found in the crime totals after all crime types have been examined and offsetting misclassifications have been considered. Since some of the misclassifications result in overcounting UCR crimes while others result in undercounting them, the correct UCR number can be obtained by considering the canceling effect of the two types of errors—overcounting and undercounting.
To illustrate the concept of statistical accuracy, consider the hypothetical case of a police department that wants to check the accuracy of all its reports for a given year (N = 50,000 records). Due to
Note:Note:Note:Note:Note:
The total number of incidents (31,003) does not include unfounded or general incident reports.
Resident PopulationResident PopulationResident PopulationResident PopulationResident Population Total IncidentsTotal IncidentsTotal IncidentsTotal IncidentsTotal Incidents Arson Aggravated Assault Simple Assault/Intimidation Burglary Murder Other Homicide Larceny Motor Vehicle Thefts Robbery Rape Other Sex Offenses Other Group A Group B
Agency 1 Agency 1Agency 1 Agency 1Agency 1 Agency 2 Agency 2 Agency 2 Agency 2 Agency 2 Agency 3 Agency 3 Agency 3 Agency 3Agency 3 Agency 4 Agency 4 Agency 4 Agency 4Agency 4 Agency 5 Agency 5 Agency 5 Agency 5Agency 5 Agency 6 Agency 6 Agency 6 Agency 6 Agency 6 Agency 7 Agency 7 Agency 7 Agency 7 Agency 7 Agency 8 Agency 8 Agency 8 Agency 8 Agency 8 Agency 9 Agency 9 Agency 9 Agency 9 Agency 9 Agency 10 Agency 10 Agency 10 Agency 10 Agency 10 Agency 12 Agency 12 Agency 12 Agency 12 Agency 12 Agency 11 Agency 11Agency 11 Agency 11Agency 11 T ot a l T oT ot a lt a l T ot a l T ot a l 14,918 2,915 6 55 339 173 0 0 822 76 31 2 17 426 968 51,291 6,539 30 106 913 714 4 0 1,942 31 1 91 43 14 1,581 790 20,338 1,279 3 17 262 82 0 0 280 13 7 4 2 278 331 15,633 1,290 5 33 386 64 0 0 181 18 5 6 10 162 420 53,230 8,984 47 306 1,306 840 7 0 2,650 461 163 27 39 1,786 1,352 13,342 95 0 0 12 9 0 0 27 5 0 0 0 32 10 19,028 1,584 4 29 222 103 1 0 381 46 20 3 7 365 403 1 1,410 1,360 6 26 210 82 2 0 247 21 12 4 6 277 467 25,713 2,552 8 73 228 222 1 0 718 39 20 13 9 886 335 17,193 447 2 4 18 7 0 0 96 5 0 0 0 32 283 32,980 3,338 25 17 494 194 0 0 817 49 16 22 34 688 982 10,822 620 1 7 90 32 0 0 267 12 1 1 4 138 67 285,898 31,003 137 673 4,480 2,522 15 0 8,428 1,056 366 125 142 6,651 6,408
Table 1Table 1Table 1Table 1Table 1
time and resource constraints the department can review no more than 1,500 records. The officers assigned to this project decide that the best way to proceed is to conduct a study that will allow them to make inferences about the error in the population of reports based on the review of a random sample of only 1,500 reports.
The first step taken is to separate all police reports for that year into 15 categories. Some of these categories are single UCR categories, such as robbery, rape, and burglary. Other categories include several types of crimes, such as all sex offenses other than rape.
Once all of the 50,000 records are partitioned into the 15 categories, the officers select a random sample of 100 reports from each category. Upon reviewing the records officers found 5 larceny reports (5.00%) misclassified, which should have been recorded as
burglary. The officers also found 5 burglary reports (5.00%) misclassified, which should have been recorded as larceny. No other errors were found in the entire review of 1,500 records.
At first glance it appears that the 5 misclassifications from each crime category (burglary and larceny) would cancel each other out and the reported number of crimes would be correct. However, determining statistical accuracy for the entire year’s records requires a calculation that estimates the impact of the error found in the sample to the population of records for the year. To perform the calculation, the total number of reports in each category where the errors were found must be determined. In this hypothetical case, there were 5,000 larcenies and 500 burglaries reported for the year. Therefore, the 5.00% error found in each category (5 out of 100 larceny reports and 5 out of 100 burglary reports)
is multiplied by the total number of reports in each category to determine the estimate.
Once the calculation is complete, the estimated number of burglaries for this department is 725 and the estimated number of larcenies is 4,775. The calculations were made as follows:
Burglary
725 = 500 (original number) - 25 (overcounts: burglaries that should have been larceny) + 250 (undercounts: larcenies that should have been burglaries)
Larceny
4,775 = 5,000 (original number) - 250 (overcounts: larcenies that should have been burglaries) + 25 (undercounts: burglaries that should have been larcenies).
Agency 7
Agency 7Agency 7
Agency 7
Agency 7 Agency 9Agency 9Agency 9Agency 9Agency 9
Agency 5 Agency 5 Agency 5 Agency 5
Agency 5 Stratum TotalStratum TotalStratum TotalStratum TotalStratum Total
C r i m e C r i m eC r i m e C r i m eC r i m e Arson Aggravated Assault Simple Assault/Intimidation Burglary Murder Other Homicide Larceny
Motor Vehicle Thefts Robbery
Rape
Other Sex Offenses Other Group A Unfounded General Incidents Group B Total TotalTotal TotalTotal N N N N N nnnnn NNNNN nnnnn NNNNN nnnnn NNNNN nnnnn 4 29 222 103 1 0 381 46 20 3 7 365 unkn 2 403 1,586 1,5861,586 1,586 1,586 4 26 60 43 1 0 61 38 18 3 7 69 0 2 53 385 385 385 385 385 47 306 1,306 840 7 0 2,650 461 163 27 39 1,786 31 48 1,352 9,063 9,0639,063 9,0639,063 47 166 118 226 7 0 375 94 100 16 36 168 31 48 71 1,503 1,503 1,503 1,503 1,503 8 73 228 222 1 0 718 39 20 13 9 886 unkn unkn 335 2,552 2,5522,552 2,5522,552 8 18 127 175 1 0 242 32 17 13 7 62 0 0 99 801 801801 801 801 137 673 4,480 2,522 15 0 8,428 1,056 366 125 142 6,651 31 50 6,408 31,084 31,084 31,084 31,084 31,084 59 210 305 444 9 0 678 164 135 32 50 299 31 50 223 2,689 2,689 2,689 2,689 2,689 Table 2 Table 2 Table 2 Table 2 Table 2
Sample Agencies and Reporting Categories
Sample Agencies and Reporting Categories
Sample Agencies and Reporting Categories
Sample Agencies and Reporting Categories
Sample Agencies and Reporting Categories
Note Note Note Note
Note: : : : The total under “N” in the “Stratum Total” column (31,084) includes both unfounded and general incident reports.: These reports were not included in Table 1.
To illustrate how statistical accuracy was assessed using a sample of records in WV, the following section provides a detailed description of the methodology applied in the present study.
Methodology
Methodology
Methodology
Methodology
Methodology
The methods used to assess classification error and statistical accuracy in the WV UCR statistics involved three distinct stages: 1) pre-sampling, 2) selecting and reviewing sampled records, and 3) analyzing the results.
Pre-Sampling
The pre–sampling stage involved two steps: 1) the partitioning of records and 2) the calculation of the appropriate sample size.
Partitioning of Records. The 12 largest municipal police departments in WV comprised the population for this study. Table 1 describes the resident populations and number of crimes reported within each of these 12 agencies in 2002 (i.e., the largest municipal police departments in WV). The last column labeled “Total” refers to the total number of residents and the total number of reported incidents, excluding the unfounded and general incidents among all 12 agencies (31,003 incidents).
From the group of 12 police departments, 3 were randomly selected to participate. The records in each of these 3 agencies were partitioned into 15 categories.
Table 2 describes these 3 police departments and the 15 categories, including unfounded and general incident reports. The column “N” under each agency describes the total number of crime reports within each of these 3
participating agencies. The “n” column provides the sample sizes by crime category for each of the 3 agencies.
The “N” under the “Stratum Total” column represents the number of reports in each crime category, for all 12 municipal police agencies, representing the total population for this study (31,084 incidents). The “n” under the “Stratum Total” column is the total number from
the 3 participating agencies (2,689 incidents). This was the total desired sample size for this study based on the estimated error in each offense category.
Calculating Sample Size
In order to establish point estimates of statistical accuracy, a sample of records from each of the 15 reporting categories was drawn. Prior to drawing the sample, however, it was necessary to decide on an appropriate level of
confidence and error. First, given the size of the population, a desired level of confidence for the interval estimate had to be established. A 95.00% confidence level was chosen and is reflected in the z score 1.96. Second, the acceptable level of error was established as .03, meaning plus or minus three percent.
Lastly, a proportion of error was estimated based on what was expected to exist in each of the 15 crime categories. These estimates were based on the results of previous record audits.
Once the above information was established, the sample size was calculated according to equation 1:
(1.) n = 2 2 2 NE PQ k NPQ k + , where k = confidence level (1.96 represents 95.00% confidence) Arson Aggravated Assault Simple Assault/Intimidation Burglary Murder Other Homicide Larceny
Motor Vehicle Thefts Robbery
Rape
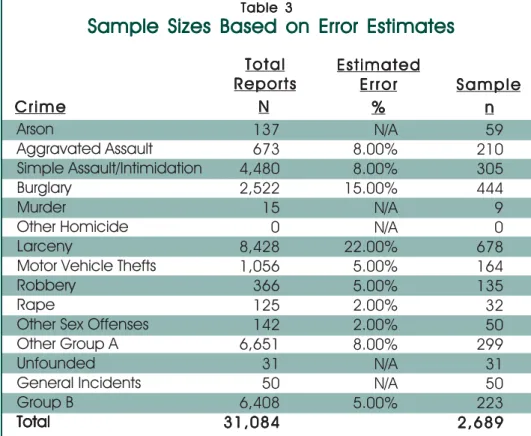
Other Sex Offenses Other Group A Unfounded General Incidents Group B Total Total Total Total Total C r i m e C r i m e C r i m e C r i m e C r i m e NNNNN %%%%% nnnnn Table 3 Table 3Table 3 Table 3 Table 3
Sample Sizes Based on Error Estimates
Sample Sizes Based on Error Estimates
Sample Sizes Based on Error Estimates
Sample Sizes Based on Error Estimates
Sample Sizes Based on Error Estimates
137 673 4,480 2,522 15 0 8,428 1,056 366 125 142 6,651 31 50 6,408 31,084 31,084 31,084 31,084 31,084 Total TotalTotal TotalTotal Reports ReportsReports Reports
Reports EstimatedEstimatedEstimatedEstimatedEstimatedE r r o rE r r o rE r r o rE r r o rE r r o r S a m p l eS a m p l eS a m p l eS a m p l eS a m p l e
N/A 8.00% 8.00% 15.00% N/A N/A 22.00% 5.00% 5.00% 2.00% 2.00% 8.00% N/A N/A 5.00% 59 210 305 444 9 0 678 164 135 32 50 299 31 50 223 2,689 2,689 2,689 2,689 2,689 Note: Note: Note: Note:
Note: There are 12 municipal police agencies with populations over 10,000 that comprise the stratum represented in this table.
P = estimated proportion of the population
Q = (1-P)
E = acceptable error (set at .03 or 3.00%)
The estimated sample size for each reporting category and participating police agency is provided in Table 2. In Table 2, “n” represents the sample size and “N” corresponds to the total number of reports. As previously noted, the desired sample size for the entire study was set at 2,689 records.
Table 3 identifies the desired sample size for each crime category based on the estimate of error expected to be found. The sample “n” was calculated according to equation 1.
Selection and Review of
Sampled Records
An automated random sample generator was used to select the records for the present study. All incident numbers from each report category were entered into the program. A list of selected cases based on incident numbers was generated. With the assistance of agency representatives, hardcopies of all reports identified for the sample were manually pulled and assessed for accuracy.
In reviewing each record, definitions provided by the UCR program officials at the FBI were applied. Prior to reviewing the records, however, a one day training was provided by an official FBI trainer which focused on the proper classification of crimes in the UCR. The FBI provided materials to assist in this process.
A systematic procedure for the assessment of each record was
established to ensure a high level of reliability between reviewers. For each record, a system of verifying the inter-rater agreement among reviewers was constructed by having multiple reviewers examine those records with a suspected classification error.
When a classification error was suspected in a given record, at least 3 members of the research team (including the first author) reviewed the report to either confirm the classification error or reaffirm the accuracy of the original classification.3 If it was difficult to determine whether the report was classified correctly, the record was judged to not contain a classification error. Essentially, this procedure gave the reporting officer the benefit of any doubt in the absence of clear information. Thus, the research team relied on the judgment of the officer on the scene when crime classification was difficult to determine because the narrative was vague.4
Key Terms and Definitions
The UCR definitions for all fifteen crime reporting categories included in this report are provided below. Group A offenses include crimes of arson, aggravated assault, simple assault/ intimidation, burglary, murder, other homicide, larceny, motor vehicle theft, robbery, and rape. These same offenses, excluding simple assault/ intimidation, are also referred to as Part I crimes under the UCR Program. Part I crimes are also referred to as Index offenses in this report.The UCR Program also collects arrest data on 19 other offenses. In National Incident-Based Reporting System (NIBRS) these offenses are referred to as Group B crimes.5 The UCR definitions for each of the offense
categories included in this report are described below.
Arson. To unlawfully and intentionally damage, or attempt to damage, any real or personal property by fire or incendiary device.
Aggravated Assault. An unlawful attack by one person upon another wherein the offender uses a weapon or displays it in a threatening manner, or the victim suffers obvious severe or aggravated bodily injury involving apparent broken bones, loss of teeth, possible internal injury, severe laceration, or loss of consciousness. Simple Assault/Intimidation. Simple assault is the unlawful physical attack by one person upon another where neither the offender displays a weapon, nor the victim suffers obvious severe or aggravated bodily injury. Severe or aggravated bodily injury includes apparent broken bones, loss of teeth, possible internal injury, severe laceration, or loss of consciousness.
Intimidation is to unlawfully place another person in reasonable fear of bodily harm through the use of threatening words and/or other conduct, but without displaying a weapon or subjecting the victim to an actual physical attack.
Burglary. The unlawful entry into a building or other structure with the intent to commit a felony or a theft.
Murder. The willful, nonnegligent killing of one human being by another. Other Homicide. Includes negligent manslaughter, which is the killing of
another person through negligence. Justifiable homicide, defined as the killing of a perpetrator of a serious criminal offense by a peace officer in the line of duty; or the killing, during the commission of a serious criminal offense, of the perpetrator by a private individual, is also included.
Larceny. The unlawful taking, carrying, leading, or riding away of property from the possession or constructive possession of another person.
Motor Vehicle Theft. The theft of a motor vehicle.
Robbery. The taking, or attempting to take, anything of value under confrontational circumstances from the control, custody, or care of another person by force or threat of force or violence and/or by putting the victim in fear of immediate harm.
Rape. The carnal knowledge of a person, forcibly and/or against that person’s will; or not forcibly or against the person’s will where the victim is incapable of giving consent because of his/her temporary or permanent mental or physical incapacity or because of his/ her youth.
Other Sex Offenses. Includes forcible sodomy, sexual assault with an object, forcible fondling, incest, and statutory rape.
Other Group A. Includes the offenses of bribery, counterfeiting, vandalism, drug crimes, gambling, extortion, fraud, kidnapping, prostitution, and weapons offenses.
Unfounded. Crimes that were reported to the police but were subsequently determined by the police to be false or baseless.
General Incidents. These are reports filed by the police for noncriminal matters, such as suspicious person investigations, false burglary alarms, community problems/disputes, and so forth.
Group B. These offenses include bad checks, curfew/loitering/vagrancy violations, disorderly conduct, driving under the influence, drunkenness, nonviolent family offenses, liquor law violations, peeping tom, runaway, trespassing, and all other offenses not considered Group A offenses. These are crimes that are only reported upon an official arrest.
There are also several general as well as statistical terms used frequently in this report. A list of these terms and their definitions are presented below. Confidence Intervals. The interval of values surrounding the point estimate in which researchers can be confident that the true population parameter (e.g., the number of crimes) falls.
Point Estimate. A statistic provided without indicating a range of error. The best guess of the true number of crimes in each crime category in the population under study.
Overcounts. When reports in crime category X are examined, overcounts represent reports that should have actually been in another category such as category Y. These reports are deemed overcounts of category X.
Undercounts. When reports that should have been in category X are found in another category such as Y. The reports result in an undercount of category X. Statistical Definition. The UCR definition for each crime.
Criminal Definition. The criminal definition of crime found in state code.
These offense categories or crimes and statistical terms are referred to throughout the remainder of this report. The following section presents the results of the current study.
Results
Results
Results
Results
Results
The results of this study focus on the statistical accuracy of crimes reported in selected municipal police departments in WV. The analysis begins with a presentation of results based on an assessment of agency records. The findings center on the degree to which overcounts and undercounts were found in the classification of crimes. Emphasis is placed on the nature of classification across crime types.
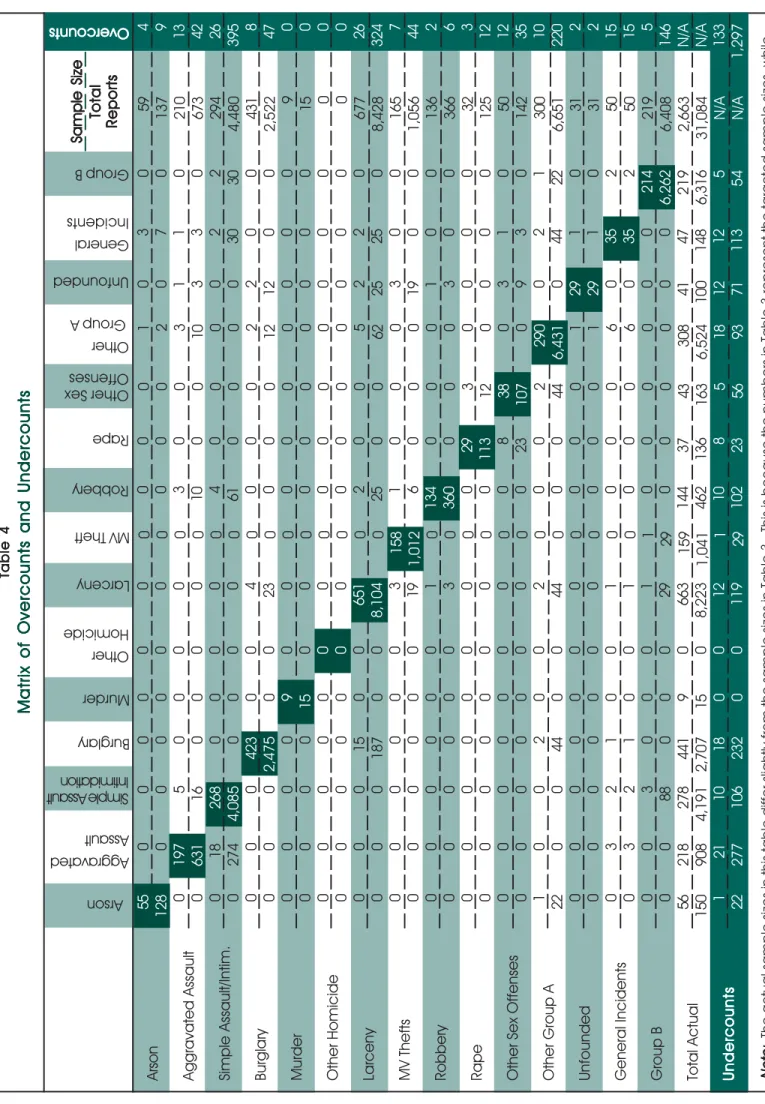
These results are followed by an assessment of classification error found between individual crimes and the associated impact on aggregate crime totals. Based on a review of police records, this discussion is followed by a qualitative description of why many of the errors in classification occurred. This discussion highlights the primary reasons for the presence of classification errors in UCR statistics. This report concludes with a review of the major findings and potential implications for UCR program administrators and officers as well as for future research. The analysis begins with a review of the results presented in Table 4.
Note: Note: Note: Note: Note:
The actual sample sizes in this table differ slightly from the sample sizes in Table 3. This is because the numbers in Table 3
represent the targeted sample sizes, while
Table 4 includes the number of reports in each crime category that were actually obtained and reviewed.
Sample SizeSample SizeSample SizeSample SizeSample Size
TotalTotalTotalTotalTotal ReportsReportsReportsReportsReports
Table 4Table 4Table 4Table 4Table 4
Matrix of Overcounts and UndercountsMatrix of Overcounts and UndercountsMatrix of Overcounts and UndercountsMatrix of Overcounts and UndercountsMatrix of Overcounts and Undercounts
Arson Aggravated Assault Simple Assault/Intim. Burglary Murder Other Homicide Larceny MV Thefts Robbery Rape Other Sex Offenses Other Group A Unfounded General Incidents Group B Total Actual UndercountsUndercountsUndercountsUndercountsUndercounts
Overcounts Overcounts Overcounts Overcounts Overcounts 0 0 5 16 268 4,085 0 0 0 0 0 0 0 0 0 0 0 0 0 0 0 0 0 0 0 0 2 2 3 88 278 4,191 10 106 0 0 0 0 0 0 423 2,475 0 0 0 0 15 187 0 0 0 0 0 0 0 0 2 44 0 0 1 1 0 0 441 2,707 18 232 59 137 210 673 294 4,480 431 2,522 9 15 0 0 677 8,428 165 1,056 136 366 32 125 50 142 300 6,651 31 31 50 50 219 6,408 2,663 31,084 N/A N/A 4 9 13 42 26 395 8 47 0 0 0 0 26 324 7 44 2 6 3 12 12 35 10 220 2 2 15 15 5 146 N/A N/A 133 1,297 55 128 0 0 0 0 0 0 0 0 0 0 0 0 0 0 0 0 0 0 0 0 1 22 0 0 0 0 0 0 56 150 1 22 0 0 197 631 18 274 0 0 0 0 0 0 0 0 0 0 0 0 0 0 0 0 0 0 0 0 3 3 0 0 218 908 21 277 0 0 0 0 0 0 0 0 9 15 0 0 0 0 0 0 0 0 0 0 0 0 0 0 0 0 0 0 0 0 9 15 0 0 0 0 0 0 0 0 0 0 0 0 0 0 0 0 0 0 0 0 0 0 0 0 0 0 0 0 0 0 0 0 0 0 0 0 0 0 0 0 0 0 4 23 0 0 0 0 651 8,104 3 19 1 3 0 0 0 0 2 44 0 0 1 1 1 29 663 8,223 12 119 0 0 0 0 0 0 0 0 0 0 0 0 0 0 158 1,012 0 0 0 0 0 0 0 0 0 0 0 0 1 29 159 1,041 1 29 0 0 3 10 4 61 0 0 0 0 0 0 2 25 1 6 134 360 0 0 0 0 0 0 0 0 0 0 0 0 144 462 10 102 0 0 0 0 0 0 0 0 0 0 0 0 0 0 0 0 0 0 29 113 8 23 0 0 0 0 0 0 0 0 37 136 8 23 0 0 0 0 0 0 0 0 0 0 0 0 0 0 0 0 0 0 3 12 38 107 2 44 0 0 0 0 0 0 43 163 5 56 1 2 3 10 0 0 2 12 0 0 0 0 5 62 0 0 0 0 0 0 0 0 290 6,431 1 1 6 6 0 0 308 6,524 18 93 0 0 1 3 0 0 2 12 0 0 0 0 2 25 3 19 1 3 0 0 3 9 0 0 29 29 0 0 0 0 41 100 12 71 3 7 1 3 2 30 0 0 0 0 0 0 2 25 0 0 0 0 0 0 1 3 2 44 1 1 35 35 0 0 47 148 12 113 0 0 0 0 2 30 0 0 0 0 0 0 0 0 0 0 0 0 0 0 0 0 1 22 0 0 2 2 214 6,262 219 6,316 5 54 Arson Aggravated Assault Simple Assault Intimidation Burglary Murder Other Homicide Larceny MV Theft Robbery Rape Other Sex Offenses Other Group A Unfounded General Incidents Group B
Assessing Overcounts and
Undercounts in Crime
Classification
The results shown in Table 4 are displayed in a matrix of overcounts and undercounts. The rows reflect the initial classification of the reports (that is, by the law enforcement officer), and the columns show the classifications based on the reviewers assessment using UCR crime reporting definitions. Two numbers are presented in the matrix cell. The top number is the sample and the bottom number is population estimate. For example, under arson there are two numbers, 55 and 128. The 55 represents the number of sample reports out of 59 that were initially reported as arson and were confirmed to be arson. The number 128 is the estimate of the number of arsons in the population of reports that were recorded accurately by the police. Following along the top row of Table 4, notice that there is a 1 under “other Group A” offenses. This indicates that 1 incident was originally reported as arson, but was assessed by the reviewers to be an other Group A offense rather than an arson. Below the 1 in this cell is a 2. This indicates that in the population (i.e., all 12 municipal agencies combined) it is estimated that 2 arsons should have actually been classified as other Group A offenses.
Finally, the last column provides the overcounts in the sample and the population estimates of overcounts by offense category. While the bottom row denotes the undercounts in the sample and the population estimates of undercounts for each offense.
As shown in Table 4, there were 133 out of 2,663 records in the sample that contained classification errors
(considering overcounts and undercounts). Based on this sample study, it was estimated that 1,297 classification errors were contained in the population of 31,084 records. Thus, approximately 4.17% of all records reported in the population of 12 agencies were estimated to be misclassified.
Beyond the total number of classification errors found in agency records, an examination of individual crime types suggested a great deal of variation in the number of misclassified offenses. As a result, the misclassification of crimes was more pronounced for some offenses, compared to others. The crime categories that had the highest error estimates include: simple assault/ intimidation (501), larceny (443), aggravated assault (319), other Group A (313), burglary (279), Group B (200), and general incident (128). (The numbers in parentheses represent the combined total of over- and undercounts.)
On the other hand, far less or no classification error was found in other crime types. For instance, the crime of murder contained no misclassified records. Of the records sampled, all were assessed as murders by the reviewers.
The crimes of motor vehicle theft, arson, and rape contained fewer classification errors. In the case of arson for instance, only 31 records were estimated to contain an error. A total of 9 overcounts and 22 undercounts were estimated for arson. As a result, misclassifications associated with the offense of arson did not contribute a great deal to the overall level of classification error in UCR statistics in WV.
Similar to arson, the crime of rape contained few classification errors. It is estimated that a total of 35 records in the population contained an error. Of these 35 instances, all of the misclassifications occurred between the offense of rape and other sex offenses. A total of 12 crimes were originally classified as rape and were subsequently deemed to be other sex offenses. Meanwhile, 23 crimes initially recorded as other sex offenses were assessed by the reviewers as rape cases. This resulted in a net reduction of 11 offenses that were actually rape, but classified otherwise.
In addition, a close examination of Table 4 reveals a general pattern for much of the classification error that occurred between individual crime types. As noted previously, a greater amount of error was found among certain crimes. The crimes with the most error included aggravated assault, simple assault/intimidation, larceny, other Group A, and burglary. However, an assessment of the classification error across these crime types confirmed that much of the error found in larceny tended to overlap with error associated with burglary and vice versa. Similarly, a great deal of the error associated with aggravated assaults tends to overlap with the error related to simple assault/ intimidation. Though the impact was much less in terms of total number of records, this type of pattern was also present in rape and other sex offense cases discussed above.
Consider the case of larceny. A majority of undercounts and overcounts occurred in relation to the offense of burglary (see Table 4). While the crime of larceny contained an estimated 443 classification errors, (324 overcounts and 119 undercounts) 210 of the errors
were estimated to be related to the offense of burglary (187 overcounts and 23 undercounts).
A similar pattern emerges when the magnitude of classification error between the crimes of simple and aggravated assault was examined. Again, a majority of misclassifications in both crimes occurred when trying to distinguish between reporting an incident as a simple versus an aggravated assault. An estimated 274 aggravated assault offenses were misclassified by law enforcement officers as simple assaults/intimidation. Far fewer aggravated assaults were misclassified as simple assaults. Only 16 offenses were initially recorded as aggravated assaults and later assessed
as simple assaults. After the net gains and loses were considered, a total of 258 misclassifications occurred due the difficulty in differentiating between these two crimes. The end result was a considerable downgrading of aggravated assaults to the less serious offense of simple assault.
These results underscore the nature and variability in classification error across crime classifications. While there was considerable variability in the magnitude of error across crime types, a majority of misclassifications tended to occur in a predictable fashion. The following section illustrates the impact of the classification error found among individual crimes on the total population of reported offenses.
Crime Estimates and
Classification Error Across
Crime Types
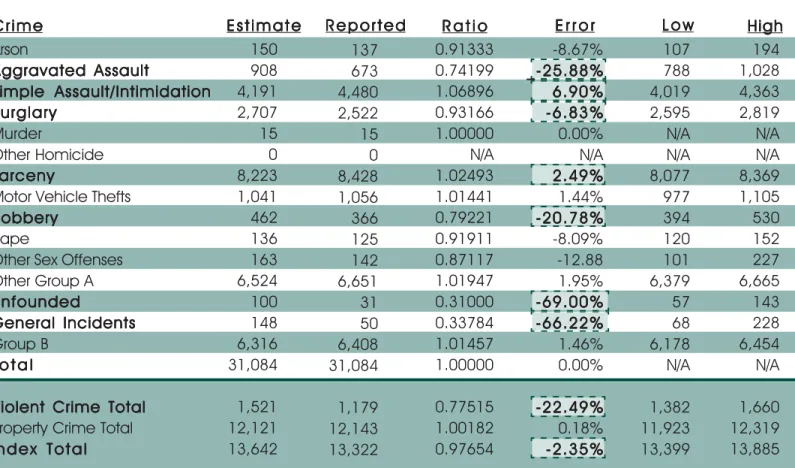
Tables 5 and 6 provide a summary of point estimates, confidence intervals, and statistical error rates for each reported crime category. Both tables also offer an estimate of the total number of Index, violent, and property crimes.
The “Reported” columns in Tables 5 and 6 show the number of reports filed in each category. The “Estimate” columns provide the point estimates of crimes based on the review of the sampled records. The “Ratio” columns compare the point estimates to the number of offenses originally reported. For example, in the arson row in Table
Table 5 Table 5Table 5 Table 5Table 5
Crime Estimates, Error Rates, and Confidence Intervals
Crime Estimates, Error Rates, and Confidence Intervals
Crime Estimates, Error Rates, and Confidence Intervals
Crime Estimates, Error Rates, and Confidence Intervals
Crime Estimates, Error Rates, and Confidence Intervals
Arson
Aggravated Assault
Aggravated AssaultAggravated Assault
Aggravated AssaultAggravated Assault
Simple Assault/Intimidation
Simple Assault/IntimidationSimple Assault/Intimidation
Simple Assault/IntimidationSimple Assault/Intimidation
Burglary BurglaryBurglary BurglaryBurglary Murder Other Homicide Larceny LarcenyLarceny LarcenyLarceny
Motor Vehicle Thefts Robbery
RobberyRobbery
RobberyRobbery
Rape
Other Sex Offenses Other Group A Unfounded
UnfoundedUnfounded
UnfoundedUnfounded
General Incidents
General IncidentsGeneral Incidents
General IncidentsGeneral Incidents
Group B T o t a l
T o t a lT o t a l
T o t a lT o t a l
Violent Crime Total
Violent Crime TotalViolent Crime Total
Violent Crime TotalViolent Crime Total
Property Crime Total I n d e x T o t a l I n d e x T o t a lI n d e x T o t a l I n d e x T o t a lI n d e x T o t a l E s t i m a t e E s t i m a t eE s t i m a t e E s t i m a t e
E s t i m a t e R e p o r t e dR e p o r t e dR e p o r t e dR e p o r t e dR e p o r t e d R a t i oR a t i oR a t i oR a t i oR a t i o HighHighHighHighHigh
137 673 4,480 2,522 15 0 8,428 1,056 366 125 142 6,651 31 50 6,408 31,084 1,179 12,143 13,322 L o w L o wL o w L o wL o w 0.91333 0.74199 1.06896 0.93166 1.00000 N/A 1.02493 1.01441 0.79221 0.91911 0.87117 1.01947 0.31000 0.33784 1.01457 1.00000 0.77515 1.00182 0.97654 107 788 4,019 2,595 N/A N/A 8,077 977 394 120 101 6,379 57 68 6,178 N/A 1,382 11,923 13,399 194 1,028 4,363 2,819 N/A N/A 8,369 1,105 530 152 227 6,665 143 228 6,454 N/A 1,660 12,319 13,885 C r i m e C r i m eC r i m e C r i m eC r i m e E r r o rE r r o rE r r o rE r r o rE r r o r 150 908 4,191 2,707 15 0 8,223 1,041 462 136 163 6,524 100 148 6,316 31,084 1,521 12,121 13,642 Note: Note: Note: Note:
Note: Percentages highlighted in lighter shaded boxes denote statistically significant levels of error. The Violent Crime Total includes: aggravated assault, murder, other homicide, robbery, and rape. The Property Crime Total includes: arson, burglary, larceny, and motor vehicle theft.
-8.67% _-25.88% _-25.88%_-25.88% _-25.88% _-25.88% 6.90% 6.90% 6.90% 6.90% 6.90% -6.83% -6.83%-6.83% -6.83% -6.83% 0.00% N/A 2.49% 2.49% 2.49% 2.49% 2.49% 1.44% -20.78% -20.78%-20.78% -20.78% -20.78% -8.09% -12.88 1.95% -69.00% -69.00%-69.00% -69.00% -69.00% -66.22% -66.22%-66.22% -66.22% -66.22% 1.46% 0.00% -22.49% -22.49%-22.49% -22.49% -22.49% 0.18% -2.35% -2.35%-2.35% -2.35% -2.35%
5, the 0.91333 in the “Ratio” column results from comparing the reported number to the estimate (137 divided by 150).
This statistical error percentage is reported in the “Error” column in both Tables 5 and 6. Negative percent error indicates an undercount of crimes in a given category. Meanwhile, positive percent error is indicative of overcounts in a given crime type. The “low” column in each table reports the lower bounds of the confidence interval, and the “high” column represents the upper bounds.
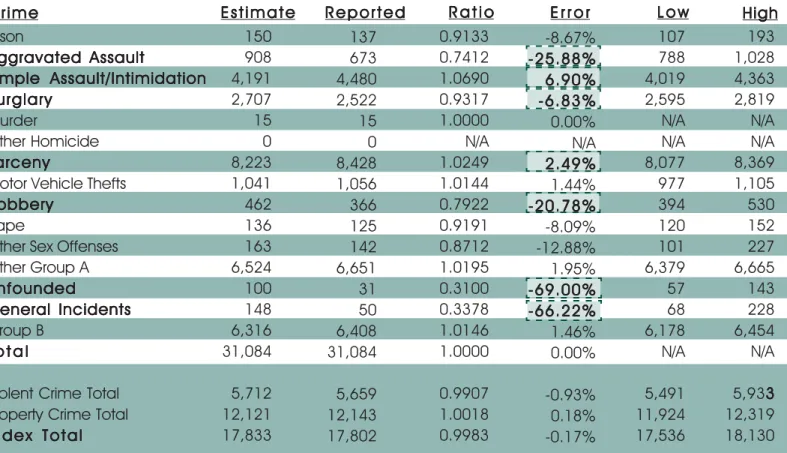
All of the results in Table 5 and 6 are identical, with the exception of the information used to calculate the Violent Crime and Index totals. Table 6 includes simple assault/intimidation as an Index crime. The results and implications for the inclusion of simple assault/intimidation as an Index crime are discussed later in this report. But first, a discussion of the findings shown in Table 5 is provided.
The results displayed in Table 5 illustrate the amount of classification error estimated for each crime type in the population. As shown in the error column, the greatest amount of percent error was observed for unfounded (-69.00%), general incident (-66.22%), aggravated assault (-25.88%), and robbery (-20.78%) offenses.6 All of the error is negative, indicating that these crimes were undercounted in original crime reports.
To a lesser extent, error percentages were reported for burglary (-6.83%), other sex offenses (-12.88%), arson (-8.67%), and rape (-8.09%). Similar to the other crimes, these reports were undercounted in original UCR statistics. It is important to note, however, that large percentages of error do not automatically translate into
statistical significance. Large percentages as well as statistical significance are, to some extent, influenced by sample size.7
To assess where the observed errors in each crime category were statistically significant, a 95.00% confidence interval was calculated for the point estimate. If the reported number did not fall within this confidence interval it was identified as statistically significant at p < .05.
The Part 1 offenses with reported numbers outside the calculated
confidence interval , included aggravated assault, burglary, larceny, and robbery. As expected based on the review of under- and overcounts in Table 4, the crimes of aggravated assault and simple assault contained a significant amount of classification error. Similarly, a significant amount of error was present for larceny and burglary.
In the case of robbery, a total of 366 records were reported by law enforcement during the year under study. Based on a review of a sample of records, it was estimated that 462 robberies should have been reported. The estimated difference of 96 records resulted in a statistically significant level of classification error for robbery.
In addition to Part 1 Index offenses, the error in the number of unfounded and general incident cases reported by law enforcement was significant. Though fewer records involved these offenses, the greatest amount of classification error occurred in these crimes. A total of 31 unfounded and 50 general incident records were reported for the population of 12 agencies in this study. Following the review the actual number of records was estimated to be 100 unfounded and 148 general incidents cases.
The Impact of Classification
Error on Aggregate Crime
Totals
The totals reported at the bottom of Table 5 and 6 provide the amount of error once all offenses were collapsed into Index categories. The Violent Crime Total was comprised of murder, aggravated assault, robbery, and rape. The Property Crime Total consisted of arson, burglary, larceny, and motor vehicle theft. All of the offenses that make up the Violent Crime and Property Crime indices constituted the Index Total.
As shown in Table 5, the offenses that comprised the Violent Crime Total were undercounted by 22.49%. There were 1,179 violent crimes reported by the 12 law enforcement agencies that comprised the population for this study. Based on the study’s findings, however, 1,521 offenses were estimated to have occurred based on the review of sampled records. This undercount in violent crimes was statistically significant at p < .05.
Similar to violent crimes, the undercount in reported cases that comprised the Index Total was also statistically significant. A total of 13,322 Index crimes were reported by law enforcement; however, the number was estimated to actually be 13,642.
Of the Index offenses, only the aggregate measure for property crime failed to reach statistical significance. In the case of property crimes, the number of records reported and estimated on the part of the reviewers was nearly equal, indicating the presence of little classification error. A total of 12,143 property crimes were reported by law enforcement, compared to 12,121 records deemed to be property crimes
by the researchers. As a result, there was only a slight overcount in the number of reported property crimes.
Based on all of the findings presented in Table 5, it appeared that a substantial amount of the error attributed to the Violent Crime Total and Index Total may have resided within the two categories of assault — aggravated and simple assault. This was evidenced by the fact that aggravated assault was undercounted by 25.88%, while simple assault/intimidation was overcounted by 6.90%.
Given the prevalence and nature of the error associated with the assault offenses, it was hypothesized that these
crimes may be contributing to a substantial amount of the error in the Violent Crime Totals and Index Totals. To explore this prospect, simple assault/ intimidation was added to the Violent Crime and Index calculations in Table 6.
As shown in Table 6, once all reported assaults (aggravated and simple) were included in the calculation of the Violent Crime and Index Totals, the amount of classification error was reduced considerably. The Index Total was now undercounted by only 0.17% and the Violent Crime Total was undercounted by less than one percent (0.93%). The aggregation of all assaults
in this manner resulted in undercounts that were no longer considered to be statistically significant.
Such an examination, which aggregates all assaults together, revealed that these offenses were likely being recorded correctly as assaults. However, the high level of error was more likely to be associated with making the finer distinctions between the different types of assault. As a result, this analysis underscored the notion that the impact of classification error on aggregate crime totals may be significantly reduced by limiting the number of misclassifications between these two crimes. To understand why
Table 6 Table 6 Table 6 Table 6 Table 6
Crime Estimates, Error Rates, and Confidence Intervals with Simple Assault
Crime Estimates, Error Rates, and Confidence Intervals with Simple Assault
Crime Estimates, Error Rates, and Confidence Intervals with Simple Assault
Crime Estimates, Error Rates, and Confidence Intervals with Simple Assault
Crime Estimates, Error Rates, and Confidence Intervals with Simple Assault
Considered an Index Crime
Considered an Index Crime
Considered an Index Crime
Considered an Index Crime
Considered an Index Crime
E s t i m a t e E s t i m a t e E s t i m a t e E s t i m a t e
E s t i m a t e R e p o r t e dR e p o r t e dR e p o r t e dR e p o r t e dR e p o r t e d R a t i oR a t i oR a t i oR a t i oR a t i o HighHighHighHighHigh
150 908 4,191 2,707 15 0 8,223 1,041 462 136 163 6,524 100 148 6,316 31,084 5,712 12,121 17,833 137 673 4,480 2,522 15 0 8,428 1,056 366 125 142 6,651 31 50 6,408 31,084 5,659 12,143 17,802 L o w L o wL o w L o wL o w 0.9133 0.7412 1.0690 0.9317 1.0000 N/A 1.0249 1.0144 0.7922 0.9191 0.8712 1.0195 0.3100 0.3378 1.0146 1.0000 0.9907 1.0018 0.9983 107 788 4,019 2,595 N/A N/A 8,077 977 394 120 101 6,379 57 68 6,178 N/A 5,491 11,924 17,536 193 1,028 4,363 2,819 N/A N/A 8,369 1,105 530 152 227 6,665 143 228 6,454 N/A 5,9333333 12,319 18,130 C r i m e C r i m eC r i m e C r i m eC r i m e E r r o rE r r o rE r r o rE r r o rE r r o r Note: Note: Note:
Note: Note: Percentages highlighted in lighter shaded boxes denote statistically significant levels of error. Small differences of plus or minus one may exist in some total figures due to rounding. The crimes of aggravated assault, simple assault/intimidation, murder, other homicide, robbery, and rape comprise the Violent Crime Total. The Property Crime Total is comprised of arson, burglary, larceny, and motor vehicle theft.
-8.67% -25.88% -25.88%-25.88% -25.88%-25.88% 6.90% 6.90%6.90% 6.90%6.90% -6.83% -6.83% -6.83% -6.83% -6.83% 0.00% N/A 2.49% 2.49%2.49% 2.49%2.49% 1.44% -20.78% -20.78%-20.78% -20.78%-20.78% -8.09% -12.88% 1.95% -69.00% -69.00%-69.00% -69.00%-69.00% -66.22% -66.22%-66.22% -66.22%-66.22% 1.46% 0.00% -0.93% 0.18% -0.17% Arson Aggravated Assault
Aggravated AssaultAggravated Assault
Aggravated AssaultAggravated Assault
Simple Assault/Intimidation
Simple Assault/IntimidationSimple Assault/Intimidation
Simple Assault/IntimidationSimple Assault/Intimidation
Burglary BurglaryBurglary BurglaryBurglary Murder Other Homicide Larceny LarcenyLarceny LarcenyLarceny
Motor Vehicle Thefts Robbery
RobberyRobbery
RobberyRobbery
Rape
Other Sex Offenses Other Group A Unfounded
UnfoundedUnfounded
UnfoundedUnfounded
General Incidents
General IncidentsGeneral Incidents
General IncidentsGeneral Incidents
Group B T o t a l
T o t a lT o t a l
T o t a lT o t a l
Violent Crime Total Property Crime Total I n d e x T o t a l
I n d e x T o t a lI n d e x T o t a l
such errors in classification occur, the following section provides a qualitative analysis of police records.
Explanations for the
Misclassification of Crime
Types
The previous sections of this report identified the sources of under- and overcounts in the classification of UCR crimes. The magnitude of classification error by crime type as well as its impact on aggregate crime estimates was also
examined. Using the crimes found to have a significant amount of classification error in this report, this section offers a description for why many of the most common errors occurred. Qualitative information gathered from the review of agency records was used to illustrate the shortcomings in interpretation that occurred in the reporting crimes by law enforcement officers.
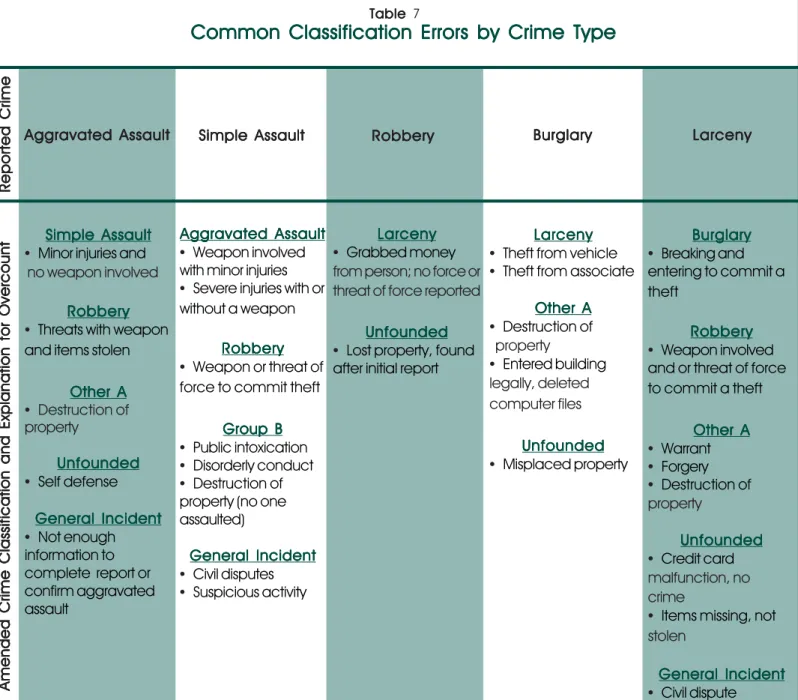
To facilitate the discussion, Table 7 provides a set of selected explanations
for overcounts that ensued in the reporting of 5 crimes. Each of these crimes was found to contain a significant amount of classification error in the previous analysis. The 5 offenses include aggravated assault, simple assault, burglary, robbery, and larceny.8
The original crime classification by law enforcement officers is noted in the row labeled “Reported Crime.” The section labeled “Amended Crime Classification and Explanation for Overcount” lists the crimes that should
Amended Crime Classification and Explanation for OvercountAmended Crime Classification and Explanation for OvercountAmended Crime Classification and Explanation for OvercountAmended Crime Classification and Explanation for OvercountAmended Crime Classification and Explanation for Overcount
Aggravated Assault
Aggravated AssaultAggravated Assault
Aggravated Assault
Aggravated Assault Simple AssaultSimple AssaultSimple AssaultSimple AssaultSimple Assault RobberyRobberyRobberyRobberyRobbery BurglaryBurglaryBurglaryBurglaryBurglary LarcenyLarcenyLarcenyLarcenyLarceny
Table Table Table Table Table 7
Common Classification Errors by Crime Type
Common Classification Errors by Crime Type
Common Classification Errors by Crime Type
Common Classification Errors by Crime Type
Common Classification Errors by Crime Type
Reported CrimeReported CrimeReported CrimeReported CrimeReported Crime
Simple Assault Simple AssaultSimple Assault Simple Assault Simple Assault • Minor injuries and
no weapon involved Robbery Robbery Robbery Robbery Robbery • Threats with weapon
and items stolen
Other A Other A Other A Other A Other A • Destruction of property Unfounded Unfounded Unfounded Unfounded Unfounded • Self defense General Incident General Incident General Incident General Incident General Incident • Not enough information to complete report or confirm aggravated assault Aggravated Assault Aggravated Assault Aggravated Assault Aggravated Assault Aggravated Assault • Weapon involved
with minor injuries
• Severe injuries with or
without a weapon Robbery Robbery Robbery Robbery Robbery • Weapon or threat of
force to commit theft
Group B Group B Group B Group B Group B • Public intoxication • Disorderly conduct • Destruction of
property (no one assaulted) General Incident General Incident General Incident General Incident General Incident • Civil disputes • Suspicious activity Larceny LarcenyLarceny LarcenyLarceny • Grabbed money
from person; no force or threat of force reported
Unfounded Unfounded Unfounded Unfounded Unfounded • Lost property, found
after initial report
Larceny LarcenyLarceny Larceny Larceny • Theft from vehicle • Theft from associate
Other A Other AOther A Other A Other A • Destruction of property • Entered building legally, deleted computer files Unfounded UnfoundedUnfounded Unfounded Unfounded • Misplaced property Burglary Burglary Burglary Burglary Burglary • Breaking and entering to commit a theft Robbery Robbery Robbery Robbery Robbery • Weapon involved
and or threat of force to commit a theft Other A Other A Other A Other A Other A • Warrant • Forgery • Destruction of property Unfounded Unfounded Unfounded Unfounded Unfounded • Credit card malfunction, no crime
• Items missing, not
stolen General Incident General Incident General Incident General Incident General Incident • Civil dispute
have been reported based on UCR definitions. The short descriptions identified by an bullet offer a brief explanation for why each of the 5 offenses were misclassified; thereby, resulting in an overcount.
The first column in Table 7 shows the sources for overcounts in aggravated assaults. A total of 5 different crimes were originally reported as aggravated assault, but later assessed to be another crime. These crimes include simple assault, robbery, other A, unfounded, and general incident.
The classification error associated with the reporting of aggravated assault occurred most often in relation to simple assault. For a crime to be classified as aggravated assault, an offender must have used a weapon or displayed the weapon in a threatening manner, or the victim must have suffered severe or aggravated bodily injury. In the absence of a weapon or such injury, a crime is typically classified as a simple assault.
As shown in Table 7, crimes of simple assault were in fact reported as aggravated assault in some instances. When misclassifications occurred, they were most often due to either no mention of a weapon being involved in the incident or the absence of severe bodily injury. Instead of serious injury, these reports tended to describe such injuries as a “knot on the head,” “redness to eyes,” “bruises,” and other “minor abrasions.” No weapons were reported as being involved in these incidents.
Other aggravated assault overcounts were more accurately classified as robbery and other A offenses such as destruction of property. In the case of robbery, reports completed by law enforcement officers often described acts of “shoplifting with a knife” or breaking “into a home with a
gun and [taking] a DVD player.” On the other hand, other police reports described incidents that were more closely related to destruction of property. For instance, 2 police records noted that a “dog was shot” or “windows were shot out” with no mention of bodily injury to the victims nor mention that the victims were in danger of being injured.
As shown in the second column of Table 7, many simple assaults were in turn reported as aggravated assaults. Of the 26 overcounts for simple assault, more than two-thirds of these errors were more appropriately classified as aggravated assault.
Most of these crimes, as reported by law enforcement officers, either involved a weapon or described severe bodily injuries to the victim(s). Various reports described the use of a weapon such as a beer or glass bottle or club. Other nonweapon-use examples involved incidents in which a victim suffered “a broken nose and slight concussion” or statements noting severe injury such as “lacerated the victim’s finger.” Aggravated assault was the correct classification for these crimes due to the presence of a weapon(s) and/ or severe injury to the victim(s).
To a lesser extent, some crimes were classified as simple assaults when they were in fact robberies. Robbery is defined in the UCR as the taking, or attempting to take, anything of value...by force or threat of force or violence and/ or putting the victim in fear of immediate harm. In most instances where a robbery was mistakenly classified as a simple assault, police records described acts in which force was used to take or attempt to take something of value from another person.
For instance, police reports of simple assaults sometimes included statements
such as “took cigarettes and beat up person,” “stole items from store and beat up store employee,” and “shoplifted and then attempted to strike employee with his car.” Since these incidents involved the taking of something by force and/or by putting the victim in fear of immediate harm, they were most appropriately classified as robberies.
In other instances, however, robbery was overcounted by the inclusion of acts of larceny, aggravated assault, and unfounded incidents. In one case, a crime originally classified as a robbery only described that the perpetrator “stabbed [a] guy with a razorblade, very serious injury, victim life-flighted to hospital.” This incident, as recorded by the police officer, contained no indication that this act was in pursuit of taking, or attempting to take, anything of value. Therefore, this incident should have been classified as an aggravated assault.
Another major source of classification error in UCR statistics reported in this study involved the relationship between burglary and larceny. In many instances, burglary was overcounted by the misclassification of larceny offenses and vice versa. Burglary simply involves the unlawful entry into a building or other structure with the intent to commit a felony or theft. Since burglary often involves larceny, these crimes were found to be more prone to misclassification by officers.
Most reported cases that produced an overcount of burglary offenses involved the taking of items from a car. The UCR definition for burglary pertains solely to entry into a building or other structure with the intent to commit a felony. According to the FBI, a building or other structure does not include a car or personal vehicle. Instead, these
offenses are to be reported as larceny/ theft offenses or, more specifically, theft from a motor vehicle. Over half of all overcounts for burglary involved the misclassification of larceny offenses.
Larceny offenses, on the other hand, involve the unlawful taking, carrying, leading, or riding away of property from the possession, or constructive possession, of another person. Similar to burglary offenses, a large proportion of overcounts in larceny crimes were due to the misclassification of burglary offenses.
Of the burglary offenses erroneously reported as larceny, most involved the simple breaking into a house, apartment, or storage garage. Officer reports included such statements as “broke into house through window and stole items,” “entered building after it was closed and stole items,” and “storage lock broken, entered building and stole $2,000 worth of items.” Since these incidents involved illegal entry into a building to commit the larceny, they were more accurately classified as burglary offenses.
In addition to the misclassification of burglary offenses as larcenies, other crimes such as robberies, other A’s, unfounded offenses, and general incidents were also counted as larceny. Instead of being classified as robbery, offenses that involved threats to “cut a victim’s throat” and a shop employee being “shoved, pushed, and punched” during a shoplifting incident were originally classified as larceny offenses. Likewise, some other A offense including forgery, embezzlement, and destruction of property were incorrectly reported as larceny crimes.
Given the inherent difficulty in making the fine distinctions necessary for classifying crimes, it is hoped that
these qualitative accounts of cases may help UCR administrators pinpoint where particular difficulties in interpretation may reside among officers. This information may further lead to efforts on the part of UCR administrators and police agencies to work at better preparing officers at making more precise distinctions between crimes for UCR reporting purposes.
The following section provides a brief review of the findings and a discussion of plausible implications of this study for UCR administrators, law enforcement training curricula, as well as future research.
Summary and
Summary and
Summary and
Summary and
Summary and
Conclusions
Conclusions
Conclusions
Conclusions
Conclusions
This report sought to assess the statistical accuracy of crime reporting in West Virginia. The population for the study consisted of the 12 largest municipal police agencies in the state of WV. From the group of 12 police departments, 3 were randomly selected to participate in the study. A total of 2,663 reports were randomly selected from the 3 participating agencies. The records in each of the participant agencies were partitioned into the 15 crime categories which served as a focal point for this study.
The results underscored the importance of assessing the impact of classification error on crime statistics. Of the 31,084 offenses reported by the 12 agencies that comprised the population for this study, a total of 1,297 records were estimated to have been misclassified. As a result, approximately 4.17% of all records reported by law enforcement were estimated to contain a classification error.
Several Part I and other crime categories were found to contain
significant levels of classification error in WV, such as aggravated assault, burglary, larceny, and robbery. With the exception of larceny, which was overreported by law enforcement officers, all Part I offenses were significantly underestimated in official UCR statistics. Likewise, 3 nonindex offenses contained a significant level of error. These included simple assault/ intimidation, unfounded offenses, and general incidents.
The classification error in Part I crimes was determined to have a profound impact on aggregate crime totals. When individual crimes were aggregated into Violent Crime and Index totals, this study found a significant undercounting of these offenses. The Violent Crime and Index totals for the population were estimated to have been undercounted by 22.49% and 2.35%, respectively. Meanwhile, the Property Crime Total for the state was slightly overcounted, however this error was not found to be statistically significant.
This study also found a substantial amount of overlap in classification error between the individual crimes. Thus, it appears many misclassifications tend to occur in a rather predictable fashion. For instance, much of the error associated with the crime of larceny occurred in relation to burglary and vice versa. A similar pattern emerged between the crimes of aggravated and simple assault. These findings suggest that, perhaps, law enforcement officers have some difficulty in making the fine distinctions that are necessary for accurately classifying crimes that are conceptually close in nature. Thus, while officers were often correct in determining that an assault had occurred in this study, the error occurred when making the decision of whether the