BIS RESEARCH PAPER NUMBER 253
Small Business Survey:
Linking 2006 and 2007 waves to
the IDBR
Contents
Authors ... 3
Acknowledgements ... 3
1. Overview ... 4
2. Previous Linking of the Small Business Surveys ... 6
Summary ... 6
Review of the SBS 2010 Linking ... 6
Review of the SBS 2012 Linking ... 7
3. Linking SBS 2006 and 2007 to the IDBR ... 9
Linking Approach ... 10
Linking to Companies House (Live and Historic) ... 11
Linking to the IDBR ... 12
4. Assessing Quality of Linking and Potential Sources of Bias ... 14
Summary ... 14
Location of Linked Businesses ... 14
Clerical Linking as a Quality Check ... 16
Potential bias: Linking Rates and Business Characteristics ... 17
5. Analysing the Reliability of SBS Self-reported Values ... 19
Summary ... 19
Comparing BSD Employment Estimates with Linked Survey Responses ... 19
Influence of BSD Time Lags ... 22
Influence of BSD Employment Source ... 24
Business Expectations to Growth ... 25
6. Dynamics of Small and Medium Enterprises: 2006-2013 ... 28
Demographic Change in Businesses Responding to SBS 2006 and 2007 ... 28
Analysis of Firm Survival and Employment Growth ... 29
Discussion ... 37
7. Conclusion ... 38
Lessons Learnt... 40
Recommendations for Future Work ... 40
8. References ... 42
ANNEX A: 2010 SBS Linking Review ... 43
ANNEX B: Additional Tables ... 45
ANNEX C: Strengths and weaknesses of linking approaches ... 58
Authors:
Jonas Meldgaard and Dr Prabhat Vaze, Belmana James Derbyshire, University of Middlesex
Ben Davies, IFF Research
Acknowledgements:
We acknowledge helpful comments throughout this study from the BIS project group, particularly Chris Wright, James Phipps, David Bonfield, Steve Dempsey and Andrew Ledger.
This work contains statistical data from ONS which is Crown Copyright. The use of the ONS statistical data in this work does not imply the endorsement of the ONS in relation to the interpretation or analysis of the statistical data. This work uses research datasets which may not exactly reproduce National Statistics aggregates.
1. Overview
This report describes work to link two waves of the Small Business Survey (SBS) to the Inter-Departmental Business Register (IDBR)1. The first is the Annual Small Business Survey 2006/07, hereafter SBS 2006; the second is the survey for 2007/8, hereafter SBS 2007. The linking work has been undertaken by Belmana and Middlesex University; IFF Research conducted both surveys and has overseen this work.
The focus of this research was to understand the strengths and weaknesses of different methods of linking and then develop an approach for application to the 2006 and 2007 waves of the survey. A particular difficulty, as older waves of SBS are linked to the IDBR, is the changes to businesses that would have occurred since the survey. This work has taken steps to reduce the effect of the age of the survey on the quality of the data linking, by linking to historic vintages of the IDBR and the Companies House register.
The report also reviews earlier work by the Office for National Statistics (ONS) linking the 2010 and 2012 SBS surveys to the IDBR. The project draws on insights from this, but introduces new linking methods that improve link rates. Various quality checks have been undertaken and, given the surveys were conducted almost a decade ago, the ability to link a higher proportion of respondents to the IDBR than achieved for the 2010 survey
indicates the linking of SBS can be undertaken even for relatively old waves. Some preliminary analysis of the linked survey data suggests that there is potential for
understanding the more long-term outcomes for businesses and correlating these with SBS responses.
The report is structured to cover:
1. Review of the SBS 2010 and 2012 Linking: This reviews the two waves of the
Small Business Survey that are already accessible for researchers within the ONS Virtual Data Lab (VML), focusing on the 2010 wave that was linked to the IDBR by ONS. The results of this data linking exercise are briefly described.
2. Linking the 2006 and 2007 SBS to the IDBR presents the results of the current
project. It describes the fuzzy linking that has been used to link the surveys to the Companies House register and to the IDBR.
3. The quality of the data linking is then assessed through both quantitative and qualitative tests. Three approaches to quality are taken, a first checks whether the areas where linking rates are low are consistent with expectations. Then, the section looks at the results of some manual checking of samples of records that were not linked and a sample where linking was successful. Lastly, a quality measure is derived, which uses the distance between IDBR and survey postcodes as validation. Potential bias, derived from differential linking rates across key variables such as business age, size and sector, is assessed and the probability of being successfully linked to the IDBR is modelled.
1
The matched datasets are now available in the VML.
4. Comparing SBS responses to ONS data uses the linked data to compare business responses to survey questions to comparable variables found in the IDBR data. The focus is on differences between employment levels recorded in the ONS Business Structures Database and in the survey waves, as well as the reliability of self-reported expectations regarding employment growth. Some analysis of turnover is also reported.
5. Analysis of business demography and growth drivers uses the Business
Structures Database to analyse what has happened to businesses that were surveyed in SBS 2006 and 2007. As expected, the recession led to a number of business closures and the section models possible drivers for this at a firm level. The section also looks at the relationship between respondents’ answers to questions about productivity drivers – such as innovation activity – and firm growth.
2. Previous Linking of the Small
Business Surveys
Summary
The approach used to link SBS 2006 and SBS 2007 builds on recent ONS work linking the 2010 and 2012 Small Business Surveys to the Inter-Departmental Business Register (IDBR). The ONS work was conducted in the last few years and so benefitted from being undertaken relatively soon after the survey. For SBS 2010, the linking used the ONS business register in a comprehensive manner, applying powerful name and address linking algorithms, so that a high linking rate was possible. However, the 2012 linking used a relatively crude linking strategy and so the number of survey responses satisfactorily linked to the IDBR was modest.
From 2014 onwards, the SBS has been using the IDBR as a sampling frame. This means that future waves of the survey will be easily and accurately linked with ONS datasets.
Review of the SBS 2010 Linking
BIS commissioned IFF Research to conduct the SBS 2010. The purpose was primarily to monitor the characteristics and perceptions of small business owners and managers, and how these have changed in comparison to previous surveys. The survey was conducted between 2 July and 7 September 2010.
BIS commissioned 4,000 computer assisted telephone interviews (CATI) for SBS 2010, which were selected in proportion to UK regions. In addition, the Welsh Assembly
Government (WAG) commissioned a further 580 interviews as a boost, making a total of 4,580 interviews. There were also boosts for women-led businesses and ethnic minority led businesses. Samples were drawn from the Dun and Bradstreet (D&B) database. Within each of the four UK countries (England, Wales, Scotland and Northern Ireland) strata targets were set according to size of business. Approximately one sixth of interviews in each country were conducted with enterprises with no employees; one-third with micro businesses (one to nine employees); one-third with small businesses (10-49 employees); and one-sixth with medium-sized businesses (50-249 employees). No other targets were set, e.g. by sector. The sample was then randomly drawn across all commercial sectors and legal structures of the UK economy, from the Dun & Bradstreet database.
Respondents to the Small Business Survey 2010 were asked the following question (Q202a):
Would it be possible for BIS to match your responses to other information that you have provided previously to the Government? By this data matching, we can reduce the burden of our surveys on your business and can improve the evidence that we use.
Data will only be used to inform research on businesses in aggregate - we will never release information that identifies any individual business - and your survey responses remain strictly confidential. Do you give your consent for us to do this?
4,006 respondents (87 per cent) said they would be willing to have their responses linked to other data. In instances where individuals indicated they would allow data linking ONS attempted to links the enterprise information held by IFF for SBS 2010 respondents and the enterprise information held by ONS on the IDBR. Where links were found ONS
appended IDBR reference numbers to the SBS 2010 database. ONS links by constructing a standardised version of business names, postcode and a trade style indicator (sole proprietor/limited company). Names are cleaned, removing unnecessary punctuation, harmonising to capitals and removing some very common words or standardising the spelling.
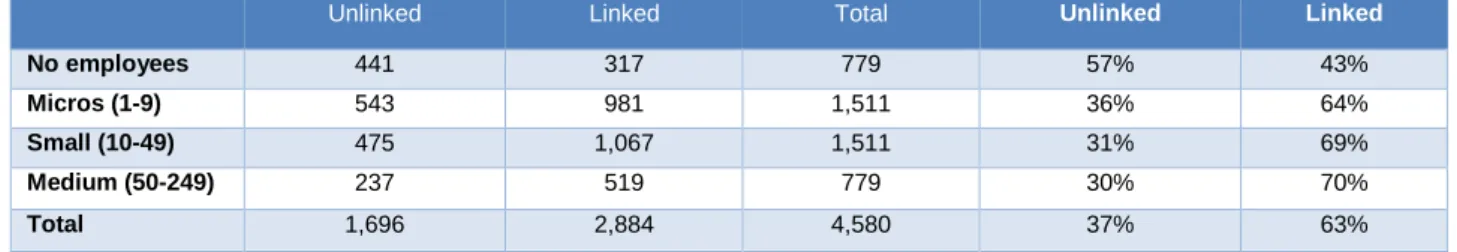
For SBS 2010, ONS were able to link 2,884 records to the IDBR. This represents a link rate of 72 per cent of those willing to be linked. Taking into account the proportion that did not wish to be linked, 63 per cent of records on SBS 2010 have appended IDBR reference numbers. ONS note that users should be aware that there has been selection in two stages: self-selection at the survey stage, and selection at the linking stage.
Table 1: ONS Linking of SBS 2010 by Size of Business
Unlinked Linked Total Unlinked Linked
No employees 441 317 779 57% 43%
Micros (1-9) 543 981 1,511 36% 64%
Small (10-49) 475 1,067 1,511 31% 69%
Medium (50-249) 237 519 779 30% 70%
Total 1,696 2,884 4,580 37% 63%
Note: Total count and percentages reported separately.
Particularly at the stage where SBS 2010 records were linked to the IDBR there is reason to believe that larger and more established enterprises are more likely to be linked. This is because the very smallest enterprises are less likely to be on the IDBR, where enterprises appear if they are registered for VAT and/or PAYE. Table 1 supports this assertion, where the link rate rises from 43% in businesses with no employees to 70% in medium sized businesses. This means that the enterprises on the SBS 2010 that are available for
conducting analysis are not representative of those in the wider business population, thus rendering the survey weights of less use for the researcher.
It is noted from this initial look at the SBS2010 linking that the link rate is high. However, it also seems to be the case that there is room for improvement, especially when looking at the group of medium and small businesses that remain unlinked. Linking such businesses should be relatively easy. Linking the SBS2006 and 2007 has sought to explain and improve link rates in these business categories.
Review of the SBS 2012 Linking
ONS also linked the SBS2012 and this is also accessible through the Virtual Microdata Lab (VML). This survey used the same D&B sampling frame as for the 2010 survey and aimed at reaching a similar composition of businesses as prior surveys.
The VML team within the ONS was provided with a list of Companies House registration numbers on the surveyed businesses, which was then linked to the IDBR enterprise reference. The link rate is much lower than that achieved for the SBS2010. Of the 5,724 businesses surveyed, 4,721 respondents agreed to have their information linked to
administrative data (82.4 per cent), and 1,809 of these were linked to an IDBR reference within the VML. This is a link rate of 38 per cent, just over half of the rate achieved on SBS2010.
Two issues explain the poor link rate. Firstly, the 2012 survey was linked relatively soon after the survey had been conducted. The register to which SBS is linked may not include the newer businesses that were surveyed, as there is a lag between businesses starting up and then registering. This is not thought to be a major problem, as the SBS usually selects relatively few new businesses. Secondly, linking to Companies House leaves out sole proprietors and other non-incorporated entities linkable through the IDBR register. Since the SBS is known for surveying many non-incorporated entities, this reduces the link rates considerably.
3. Linking SBS 2006 and 2007 to
the IDBR
Summary
SBS2006 has 9,905 surveyed businesses, of which 8,640 agreed to have their data linked (87.3 per cent). For the SBS2007, those numbers are 9,362 and 7,985 (85.3 per cent) (Williams and Cowling, 2009)2. The surveys were commissioned by the Department for Business Innovation and Skills (BIS was then the Department for Business, Enterprise and Regulatory Reform). IFF Research conducted the surveys, following the same sampling strategy as outlined for SBS 2010 in Section 2.
Similar Small Business Surveys had been conducted for the years 2003, 2004/5, and 2005/6, with the target population being small and medium-sized enterprises (SMEs) defined as having less than 250 employees. As with other waves of the SBS, the sample was drawn from the Dun and Bradstreet business register. The 2006 survey was
conducted between November 2006 and March 2007. SBS 2007 was conducted a year later. Sample sizes were almost double the more recent waves and boosts were included for Scotland and some of the regions of England.
The main challenges for linking these surveys to the IDBR are around the age of the survey. Many businesses that were surveyed would no longer be operating or would have changed ownership or address. Such changes are exacerbated by the recession, where business restructuring and closures became more pronounced. This necessitates the use of old versions of the registers for linking and puts a premium on registers that accurately manage the demographic changes a businesses may go through. It also limits the extent to which clerical checking is possible, using live databases and search systems.
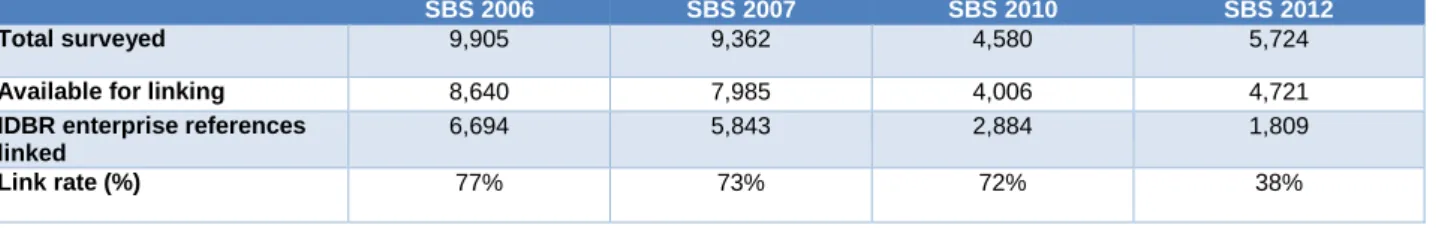
Table 2: Final linking rates for Small Business Survey waves
SBS 2006 SBS 2007 SBS 2010 SBS 2012
Total surveyed 9,905 9,362 4,580 5,724
Available for linking 8,640 7,985 4,006 4,721
IDBR enterprise references linked
6,694 5,843 2,884 1,809
Link rate (%) 77% 73% 72% 38%
Table 2 indicates the results of this project’s linking of SBS to the IDBR in the 2006 and 2007 waves of surveys and compares this with that achieved for the 2010 and 2012 surveys by earlier work. Compared with the IDBR linking of the 2010 survey, linking rates for SBS 2006 and 2007 are higher. Linking of the SBS 2012 is not directly comparable, as the linking method used differs from the one used for the SBS 2006, 2007 and 2010.
2
8,105 businesses did agree to be linked, but the number of businesses with ID data for linking was lower.
As the achieved link rates are high and the 2006 and 2007 surveys were almost twice the size of the 2010 survey, the number of businesses successfully linked to the IDBR is more than double that available to analysts of the SBS 2010.
The final link rates for SBS 2006 and 2007 were not achieved through a single method. Multiple methods were tested on the datasets. This provides two lessons. Firstly,
comparing the links achieved through different methods ensures robustness of the link. Secondly, there is value added by using linking techniques in a manner that is tailored to the register being used. For example, different registers treat the history of business change differently and the linking exercise can then adapt to the strengths of some of the registers.
Linking Approach
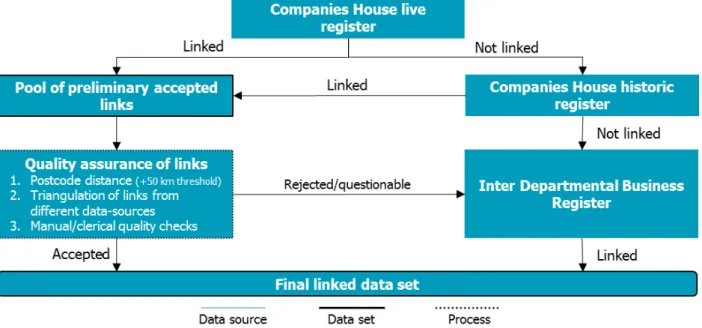
The flowchart, Figure 1, outlines the approach for linking SBS 2006 and 2007. It shows the use of the different data sources used for linking: the live Companies House register, a historic Companies House register from an online database and the Inter-Departmental Business Register. As each dataset lends itself to different methods of linking, the use of three different data sources has enabled to test the strength and weaknesses of each separately3. Then comparison across links found through different methods and different datasets ensures robustness of the final linked data (i.e. similar links across different sources were considered a verification).
Figure 1: Linking process for SBS 2006 and 2007
Using different data sources and methods does complicate the linking compared to more conventional methods. To simplify the process, a hierarchical strategy has been developed to prioritise between the links achieved by the different methods/data sources. The
research team was provided the micro data for the 2006, 2007 and 2010 surveys with identification information for those businesses that agreed to be linked. The SBS data was
3
The strengths and weaknesses of each data source can be found in Annex C.
then linked to different vintages of the Companies House register using fuzzy record linkage. It was then linked to the IDBR focusing on those businesses that could not be identified on the two versions of the Companies House register4.
The identifier information in the SBS sometimes included Companies House register numbers. However, for the majority of businesses, identification information was limited to the name of the business, its location and other characteristics – such as industry – that could be used to corroborate links.
Even where the name and location was provided for the survey, these were rarely the same as that used on official registers even when the business was the same. A word in the business name may be abbreviated or a punctuation mark added. Fuzzy linking is an approach that links the surveyed businesses to registers accepting this constraint. Fuzzy linking algorithms were used on all three data sources in Figure 1. The closeness of the names or other linking fields is then scored with a score of one representing a perfect link. Prior to the linking, survey identifiers about business names were “tidied up”. The process of cleaning business names in Stata has been formalised by Wasi and Flaaen (2014). Their commands stnd_compname allows analysts to parse and standardise company names and addresses, splitting the string variable containing company names or addresses into five components: (1) official name; (2) Doing-Business-As name; (3) Formerly-Known-As name; (4) business entity type; and (5) attention name. It does this using standard, exhaustive lists of standardisation rules that can be manually changed. The list of rules applied can be found in Annex B, Table B11.
Running this command on both SBS data and the register used for linking was a first step in the process. The code harmonises and truncates common terms often found in
business names, to lower their influence on the link score (i.e. Contractors becomes
CONTR). It removed obvious errors and adjustments made to harmonise punctuation such as spacing and use of full stops. Case sensitivity is avoided by capitalising. Also, terms referring to business entity types are put in a separate variable that is used as a separate linking variable.
Linking extended beyond the name fields. This was to minimise invalid linking. For example, if the business is not registered at Companies House, the name the business operates under may be very similar to one that is registered, resulting in an incorrect link. The fuzzy linking used business name but also incorporated the postcode of the business, business entity type and other descriptors to increase the confidence of the linking.
Linking to Companies House (Live and Historic)
The first data source tested was the publicly accessible live Companies House register5. This was the only data source used in the SBS2012 linking. A problem with linking directly
4
Hereafter, businesses are all entities being surveyed (including self-employed and sole proprietors), and companies are those registered with Companies House (Ltd, PLC, CIC, LLP etc.).
5
As this data source is publicly available linking was undertaking in Stata 13, using the reclink2 command as explained in Wasi & Flaaen (2014). The same method was used for linking with the IDBR dataset, only here the companies and businesses were linked separately. Business name, entity type and postcode were used, and different combinations of variables were tested. See Annex A for a description of different strategies on use of variables.
to the live Companies House register is that dissolved companies will remain unlinked. This problem is quite substantial given the age of the two surveys, and is exacerbated by the considerable exit seen due to the recession. To improve the linking, approaches have been developed that would link to companies dissolved between 2006 and 2014. This used Google Refine Reconciliation API6 on the Opencorporates.org dataset.
The Refine Reconciliation API links company names to corporate entities on the
Opencorporates.org register. Opencorporates.org holds a historic record for all Companies House entries, allowing linking not only to active companies, but also to dissolved ones. The proprietary API provides a very strong linking algorithm judging by the quantity and quality of achieved links. It effectively recreates the Companies House register of 2006 and 2007, identifying live businesses at the time of the SBS waves.
The API returns a linking score with each possible link result, based on the similarity of the company name. The algorithm takes account of the year of the survey and this changes the fuzzy scoring behaviour, meaning that a company will score higher if it was active at that date, and score significantly lower if it did not yet exist, or was inactive at that date. This was used to link data from the past, giving confidence that companies were relevant to the date of the survey. Many potential problems are solved. First of all, by adding a date, companies that have changed their name over time can be identified. Secondly, dissolved companies weigh as much as those that are currently active. This feature is an improvement to the algorithms available for IDBR linking and proved a very useful
innovation for linking of historical data.
The algorithm derives up to three link options, sorted in the order of the similarity using the linking score. Where the scores are high for the best link (above 90 % similarity), then this was considered to be the successful link; where scores were very low then no linking to a CRN was made. Clerical linking was undertaken for intermediate scores.
This recent innovation in linking software provides a strong starting point. The link rates are significantly increased compared with linking to the live Companies House register (See Annex C for link rates) and the API linking algorithm on company name seems to be stronger than those available within statistical packages often used when linking to the full IDBR register. The main disadvantage of using a proprietary API is its “black box”
character. Inputs and outputs can be assessed, but ultimately the actual linking algorithms cannot be adapted.
Linking to the IDBR
Many businesses surveyed in the SBS are not incorporated. Working proprietors and the self-employed will not appear on the Companies House register. To boost the link rate for such businesses and to ensure robustness of links found through the Companies House linking, the Inter-Departmental Business Register was used. The IDBR is a sampling frame including all businesses that are VAT or PAYE registered. This means it excludes many
Stata code used: reclink2 companyname entity_type postcode using “data-source”, idmaster(key1) idusing(key2) gen(fuzzyscore) minscore(0.90)
6
Instructions on the procedure can be found in video format here: https://vimeo.com/17924204. Further information on the API can be found here: https://api.opencorporates.com/documentation/API-Reference.
small companies, but then includes those unincorporated entities with turnover greater than the VAT threshold or that employ staff.
The IDBR has a live address reference file. It currently holds about 15 million observations providing identification data, including business name and address. Business details are taken from a variety of sources to build as comprehensive a picture of the locations of all UK businesses as possible. Each observation has an associated unique search key (addressref) which is linkable to an enterprise or a local unit within an enterprise.
The linking between address identifiers and the IDBR identifiers (entref) can change over time as businesses change the locations in which they operate. Also the address file changes as new units are added to the register or as ONS weeds out defunct addresses. Care is taken to avoid deletions due to a change of status. This poses a general problem for the fuzzy linking algorithms, as a business might be dissolved, but then set up again with a very similar name and from the same postcode as the earlier entity. Problems are also apparent in simpler cases of address and name changes. Since the data used for fuzzy linking stores information on all units at all times, but without stating at which year the information was correct, the danger of yielding “outdated” links is high.
The approach taken has sought to follow the method that ONS applied when linking to the IDBR register for SBS 2010, somewhat constrained by documentation being limited7. The main difference from linking to Companies House registers is that IDBR linking requires a business type indicator in the linking algorithm (i.e. whether an entity is a working
proprietor or a limited company). An example of why this helps is where the registered business is a working proprietor and its primary name in the data is the name of an individual. For these cases, it is often the case that the IDBR holds a trade name as well, which is likely to be the name found in the SBS. As IDBR linking is a heavy data
processing procedure, the approach only used the IDBR to link working proprietors from the survey, as well as poor/missing links from previous Companies House linking.
7
The method described in footnote 4 for Companies House, was also applied to the IDBR linking. The IDBR Address-reference tables were used as the main data source, as it contains company names and
tradenames, address and entity-type marker. For linking of sole proprietors, the trading name was used in the linking process, as this was the only information given in the survey.
4. Assessing Quality of Linking and
Potential Sources of Bias
Summary
This section reports on three analyses undertaken to assess the quality of the linking, as highlighted on Figure 1. The first focuses on the Companies House linking, where a distance measure has been estimated to qualify a simple fuzzy link on business name. This distance measure was then used to set a threshold of acceptance. All links above this threshold where put through IDBR linking as well, to ensure robustness.
Secondly, clerical linking has been used to understand the main reasons behind failing to link businesses to the IDBR. A sample of the businesses surveyed by SBS that could not be linked was taken. Each were characterised using survey responses and then various business databases were used to check that the businesses could not be linked to a registered business. This systematic clerical linking allows an assessment of the key reasons for being unable to link.
Thirdly, the section reports on analysis of covariates from the survey, to assess potential biases caused by differential link rates. As suggested by the SBS2010 linking exercise, it is expected that smaller, younger and non-incorporated businesses have a lower link rate than more consolidated businesses. However, to fully understand the bias derived from linking, a logit model is constructed explaining the probability of being linked. In selecting variables, this goes beyond the “usual suspects” and includes self-reported ambition for growth, sector and start-up character.
The quality checks were conducted parallel to the linking work, not as a discreet check at the end of the linking. Assessing the quality of the linking at different stages proved an important part of improving the linking strategy.
Location of Linked Businesses
This subsection considers the quality of the linking to the IDBR. It uses location as a means to check that linking correctly identifies business both by name and location.
For this check, a variable was created for the physical distance between the businesses as recorded in the survey and as recorded in the business register. There are some common reasons for the two addresses/postcodes to be different. For example, a business may register using the address of a service provider (e.g. an accountant), while the survey response may be a place of work. Other reasons include changes of address since the time of the survey, which is expected to be a problem for historical surveys like the ones of interest here. The general logic is that where the physical distance between the survey and register postcode is high, the researcher will have to check that the business has been correctly linked.
The linking algorithms can be used to give some weight to the textual difference in postcodes (e.g. postcode NR2 differs little from NW2) but the textual difference may not correlate with the geographical distance between proposed links and the postcode of the
survey response (Norwich versus London in the example). To calculate this, the postcode reported in the survey entry was compared to that provided by the Companies House register. The longitude and latitude of postcodes, or more precisely the first half of the postcode (outcode), was used to calculate physical distance between the postcodes of the survey entry and the suggested link8.
The next step was to assess the linked pairs manually, checking the quality of the link. This involved comparing the name, looking at the industrial classification and other
business typology data. Manual checks also looked at standard business databases such as Companycheck.co.uk and business websites to corroborate the link. Generally, a fuzzy name link accompanied by a close postcode was found to be a correct link.
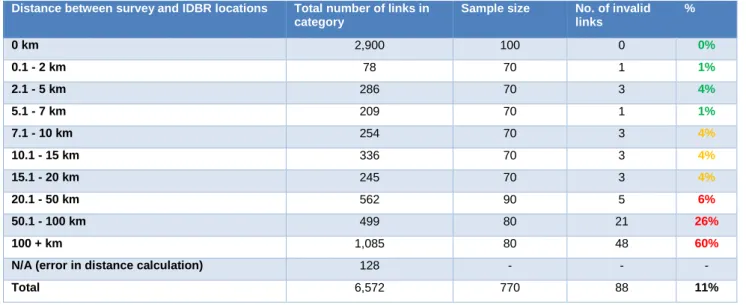
Table 3 shows the results of a randomised quality check stratified by the distance between the locations as reported in the survey to that in the IDBR after linking. It is seen that the linking processes flag proposed links as invalid as distance increases. Generally, however, the linking quality is high. The majority of companies are linked to one on the register with the same postal outcode. In this category of “perfect links”, all 100 sampled pairs were valid. As the distance increases, so does the rate of false links. A distance from 0-50 km seems to provide a fairly good link, with rates of valid links around 95 per cent. For the 50+ km categories however, this rate drops significantly. When the distance increases to above 100 km, the rate of validity decreases to around 40 per cent. To ensure a good balance between linking quality and quantity, all links with a distance above 50 km was put through IDBR linking as well. In cases where the IDBR linking was unsuccessful, the link was dropped.
Table 3: Linking validity by distance between linked postcode and postcode from survey data (SBS2006 sample)
Distance between survey and IDBR locations Total number of links in category
Sample size No. of invalid links % 0 km 2,900 100 0 0% 0.1 - 2 km 78 70 1 1% 2.1 - 5 km 286 70 3 4% 5.1 - 7 km 209 70 1 1% 7.1 - 10 km 254 70 3 4% 10.1 - 15 km 336 70 3 4% 15.1 - 20 km 245 70 3 4% 20.1 - 50 km 562 90 5 6% 50.1 - 100 km 499 80 21 26% 100 + km 1,085 80 48 60%
N/A (error in distance calculation) 128 - - -
Total 6,572 770 88 11%
The valid +50 km links are usually cases in which a local unit/plant located away from the head office address in the register took part in the survey. This is not a problem per se, but in some cases it is found that surveyed businesses are local units in large multi-national
8
Distances are calculated by the following formula in MS Excel: 6371*ACOS(COS(RADIANS(90-lat1))*COS(RADIANS(90-lat2))+SIN(RADIANS(90-lat1))*SIN(RADIANS(90 lat2))*COS(RADIANS(long1-long2)))
enterprises (e.g. a single restaurant in a large chain where the IDBR reports the two being part of the same enterprise) and the survey refers to the local unit. For further use of these datasets, this will have to be made clear. The linking of a survey about a local unit with its parent may mean the data drawn through the link to the IDBR is inappropriate.
Employment, turnover and other variables from the IDBR will be about a different entity to the SBS Survey. Section 4 includes a discussion on how to take this into account when using the SBS datasets for analysis.
Clerical Linking as a Quality Check
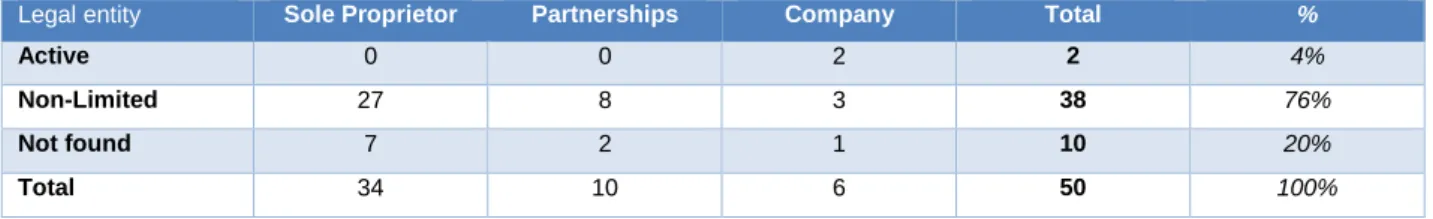
To explore the possible explanations behind missing links, this section reports on the clerical linking of a sample of 50 randomly selected unlinked businesses from the SBS2007 survey. By manually searching for businesses on Google, Yellow Pages
(Yell.com), Companies House, Companycheck.co.uk and Opencorporates.org, businesses were identified and the cause of the missing link categorised9. Table 4 shows the results of this exercise, dividing the different outcomes of the clerical linking into four categories. The ‘active’ category refers to a survey entry that was identified as an active company through clerical linking. If the fuzzy linking procedure is optimised, it should be possible to link these companies. A common reason for this not occurring is that the business has
changed its registered address since the time of the survey. The link on name is then over-ruled because of the change in postcode. This category did however only explain 4% of the missing links in the sample, suggesting that the fuzzy link algorithm is picking up almost all active companies.
Table 4: Results of clerical linking, by legal status
Legal entity Sole Proprietor Partnerships Company Total %
Active 0 0 2 2 4%
Non-Limited 27 8 3 38 76%
Not found 7 2 1 10 20%
Total 34 10 6 50 100%
Note: Clerical linking attempts were done on the SBS 2007 dataset. The legal status refers to a category from the survey.
The second category is where linking is difficult is where businesses are not limited liability and so would not appear on the Companies House register. Many such businesses would only appear on the IDBR if they were VAT or PAYE registered. As the IDBR, as a
consequence, only covers around 50 per cent of businesses, not all sole proprietors can be linked. This is the main reason for non-links, explaining 76 per cent of the cases considered. The businesses do exist in online portals like the Yellow Pages and
Companycheck.co.uk, but are not listed on the IDBR register. This is most likely explained by lack of either VAT or PAYE registration. It is also apparent that some surveyed
businesses have not been aware of their own legal status, as three of the six respondents claiming to be companies are listed as non-incorporated businesses online.
Lastly, there are businesses that proved impossible to find. These businesses did not appear in the online registers, and did not return anything when using standard search
9
The clerical linking process included using full addresses from the SBS identification data, along with different permutations of name and postcode.
engines for all combinations of postcode and business name. In six of the 50 cases the business name in the survey is the name of a person, which makes identification harder. These “under-the-radar” businesses are not expected to be available for any sort of analysis, unless they enter the VAT or PAYE system in future years. This group accounts for 20 per cent of the non-linked businesses.
Potential bias: Linking Rates and Business Characteristics
Table 5 combines the link rates observed with responses in the SBS about business characteristics. The table shows results for SBS2006, SBS2007 and SBS2010. Numbers indicate that the characteristics of successfully linked businesses across the three waves of the SBS differ.
The SBS is focused on smaller businesses. Micro businesses (1-9 employees) or those that have no employees are generally harder to link, reflecting the lower likelihood of small businesses appearing on the Companies House, VAT or PAYE registers. Medium sized businesses – of 50-250 employees – have a high rate of linking success. In comparison with the linking to SBS2010, SBS2006 and SBS 2007 linking is more successful for medium sized businesses. Whereas only 77 per cent of medium sized businesses were linked in SBS2010, the corresponding figure is 88 per cent for the SBS2006 and 2007. For micro-businesses, the SBS2010 has been linked better, but this is the only size band where this is the case.
Table 5: Link rates compared across SBS waves, by business size
SBS2006 SBS2007 SBS2010
Link rate Total count Link rate Total count Link rate Total count
No employees 56% 812 53% 1,312 51% 627
Micros (1-9) 71% 3,223 68% 3,002 75% 1,308
Small (10-49) 83% 3,231 83% 2,590 80% 1,333
Medium (50-249) 88% 1,374 88% 1,081 77% 678
Total 77% 8,640 73% 7,985 73% 3,946
Note: The numbers refer to values from the survey.
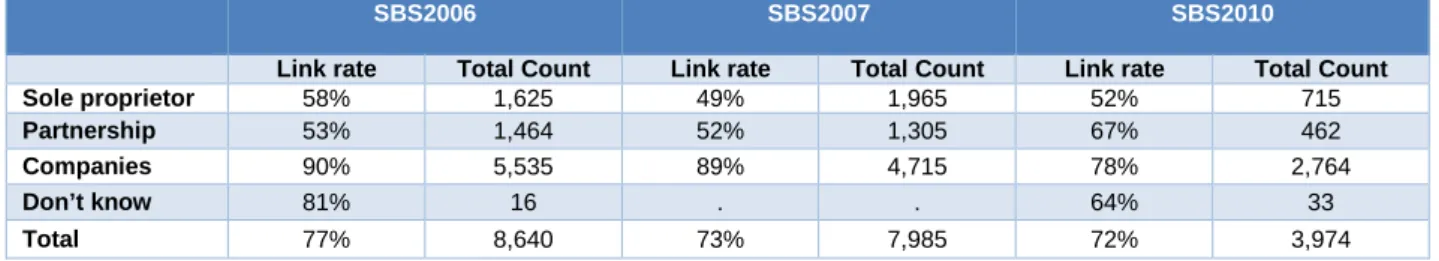
Table 6 indicates that companies, defined to include the range of limited liability entities, have a far higher link rate than other entity types. Across all three surveys private limited companies and other limited liability entities are overrepresented in the linked dataset. The linking undertaken of SBS2006 and 2007 yields around 90 per cent link rates for this group. Looking at the markedly lower link rates for sole proprietors, a source of potential bias from the linking is clear.
Table 6: Link rates compared across SBS waves, by legal status
SBS2006 SBS2007 SBS2010
Link rate Total Count Link rate Total Count Link rate Total Count
Sole proprietor 58% 1,625 49% 1,965 52% 715
Partnership 53% 1,464 52% 1,305 67% 462
Companies 90% 5,535 89% 4,715 78% 2,764
Don’t know 81% 16 . . 64% 33
Total 77% 8,640 73% 7,985 72% 3,974
Note: The legal status refers to a category from the survey.
VAT registration is also a strong explanation behind linking success. Across all surveyed businesses, VAT-registered respondents have a link rate of around 80 per cent, whereas
this is around 50 per cent for non-registered ones. Looking at sole proprietors only, VAT registration increases the link rates by about 20 percentage points from 39 to 59 per cent. Table 7 shows the result of a multivariate logistic regression, highlighting which variables influence the probability of being linked to the IDBR. The dependent variable is the binary link status. Apart from the variables examined above, both sector and age is found to influence the probability of being linked to the IDBR. Legal form, number of employees and VAT registration do however remain the most influential determinants of linking. A
registered company has over five times higher odds than sole proprietors of being linked to the IDBR controlling for all other characteristics.
The logit model underscores that being successfully linked is not random, which in turn renders the survey weights of less use for analysts using the datasets. New weights, taking into account the linking bias, will have to be constructed to get a representative sample of businesses. The logit models shows similar patterns across both survey waves, suggesting that any linking bias is consistent.
Table 6: Determinants of businesses being successfully linked to the IDBR
Dependent variable is IDBR link status (0/1). Successful link = 1
SBS 2006 SBS 2007
OR (exp β) s.e. OR (exp β) s.e.
Employees 1.004*** 0.001 1.004*** 0.001
Sector (A Agriculture, hunting etc.)
B Fishing 1.057 1.271 2.225 1.233
C Mining and quarry 2.01 1.053 1.085 0.742
D Manufacturing 1.946*** 0.158 2.258*** 0.171
E Electricity, gas etc. 0.45 0.695 2.948 0.864
F Construction 1.886*** 0.173 1.975*** 0.176
G Wholesale and retail 1.490*** 0.147 1.826*** 0.156
H Hotels and restaurants 1.804*** 0.161 1.964*** 0.171
I Transport, storage 1.369* 0.176 1.926*** 0.194
J Financial intermediation 2.114*** 0.267 1.748** 0.258
K Real estate etc. 1.481** 0.156 1.813*** 0.16
L Public administration 0.734 0.512 (empty)
M Education 1.447 0.416 3.262*** 0.404
N Health and social 1.171 0.261 1.361 0.222
O Other community 1.096 0.197 1.653*** 0.184
Age 1.023 0.026 1.050** 0.02
Legal form (Sole Prop.)
Partnerships 0.742*** 0.076 0.847** 0.077
Companies 5.139*** 0.074 5.817*** 0.073
Start-up (No) 1.071 0.172 0.943 0.095
VAT registration (Yes)
No 0.451*** 0.09 0.458*** 0.079
Unwilling to say 0.573 0.779 0.751 0.795
Growth ambition (Will grow) 1.005 0.063 0.866** 0.063
Constant 0.654 0.697 0.569** 0.233
Pseudo-R2 0.17 0.18
Log likelihood -3907 -3796
N 8,640 7,976
5. Analysing the Reliability of SBS
Self-reported Values
Summary
This section reports analysis about how reliable the self-reported survey responses are in comparison with equivalent estimates derived from the linked administrative data. It looks at any differences between self-reported and IDBR measures of employment. Similar comparative analyses are undertaken for turnover.
The results indicate values are generally similar between the two sources, but they also identify differences that arise due to comparability problems. Firstly, differences could arise due to false links. The checks on the quality of the linking suggest this would not provide a complete explanation. Secondly, differences could indicate that survey responses are incorrect, or that administrative data is incorrect. There is some evidence that it is more likely to be the former. A third possible explanation is that the linking is correct at entity level but that the survey response is with respect to a different part of the entity than the record found in administrative data. This is most likely to occur in complex business structures. A survey respondent may be answering about a particular plant or local unit, not covering the entirety of the business that is the focus of the ONS Business Structures Database that is used here.
A final area considered in this section is the source for IDBR employment numbers. IDBR uses a variety of sources and, for any business, will use that source which is believed to be most reliable at the time. Many businesses have employment estimates based on snapshots of the PAYE system. This is over-ridden with estimates from surveys where a business has fallen within the sample of one of the ONS employment surveys. The complexity of sources result in an issue of timing: if a survey respondent estimates employment at a particular time, there will be a lag as a record of employment enters the different administrative systems or is requested through an ONS survey.
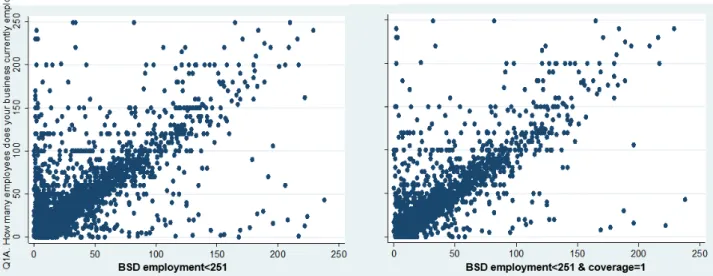
Comparing BSD Employment Estimates with Linked Survey Responses
Below are two scatterplots, comparing the employment value reported in the survey (y-axis) with the employment value in the ONS Business Structures Database (BSD, on the x-axis). Similar comparative analyses are undertaken for turnover10. The BSD is an annual snapshot of the IDBR that is then archived so that there is longitudinal register information about business employment and turnover. The BSD replicates the structure of the IDBR,
10
See Annex B Table B7 (sub tables 5-8) for a comparison of expected/reported turnover growth and Table B9 for results of a simple comparison between survey and BSD turnover size bands. The turnover variable held in the SBS survey is ordinal-scaled, meaning that a lot of the analyses undertaken for the analysis of employment is not feasible for turnover. The analyses undertaken suggest that the patterns seen for the employment variable are seen for turnover as well. Judging by the chi-squared test values of the two analyses, survey turnover seems to be slightly better correlated with BSD turnover, compared with employment numbers.
compiling data for enterprises and the associated local units. However, it also then links over time allowing analysis of turnover and employment time-series at a firm level. The plots exclude businesses larger in size than 250 employees. A similar plot for all businesses in the SBS would highlight, potentially in a disclosive manner, how quite a few surveyed units form part of very large enterprises. One of the main problems with the linking of a survey to an administrative dataset is that the survey may only refer to that part of a large business where the respondent is based. This leads to extreme outliers in the plot, as local unit survey values differ significantly from those found at the enterprise level. In these outliers, there is no evidence that linking has been of a poor quality; rather it is clear that the SBS is focusing on a single local unit of the large multi-plant enterprise. The left-hand side scatter plot focuses on the distribution of businesses that falls within the definition of a SME (i.e. equal to or below 250 employees in the BSD). The plot on the right-hand side builds on this, by introducing a qualifier based on survey coverage. The SBS asks the respondent how many units are present in the business being surveyed. Comparing this with the number of local units reported in the BSD offers an insight into whether businesses are responding about a different set of units to those the BSD
enterprise covers. Complete coverage is where the survey respondent identifies the same number of local units as in the BSD. The right-hand panel is therefore focusing on
responses where there is confidence that the SBS and IDBR data is covering the same portion of a business.
On both plots, a concentration around the 45-degree line indicates a strong correlation between survey responses and BSD data. However, the spread around this 45-degree line is rather large and it is obvious that the correlation is not perfect. Correlation improves in the second panel where coverage by the respondent is the same as that in the IDBR. This is where the respondent’s view on the number of local units or plants, collected in a
specific survey question, is the same as that in the administrative data.
Figure 2: Correlation between survey employment and BSD employment
Note: The scatterplots contain data from the SBS2007. The BSD 2008 employment values are used as a comparison.
An observation regarding the overall quality of the survey is the high number of responses that report employment at rounded numbers, such as 50 or 100 or 150. This centring of data is likely to reflect respondents making educated guesses regarding employment
numbers. It is likely that there will then be a number of employment estimates in the survey that are imprecise. This is likely to permeate other responses to the survey questions. The plots suggest some simple heuristics for users of the linked data to ensure that
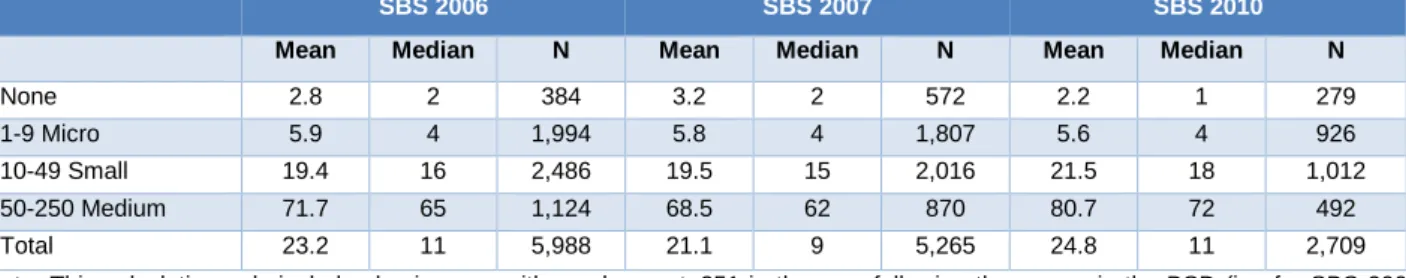
analysis focuses on businesses where data is robust. One rule would be to remove linked businesses above 250 employees in the BSD. Table 7 uses this rule, removing businesses that may not be regarded as an SME when using the BSD employment data. The removed businesses are mainly multi-plant in the IDBR, making them too large to be included in the survey if ONS organisational structures are used to define firm size. The BSD employment distributions in Table 7 are more consistent with the SBS employment numbers than if such businesses are included.
Table 7: Comparison of employment values, by survey business size bands
SBS 2006 SBS 2007 SBS 2010
Mean Median N Mean Median N Mean Median N
None 2.8 2 384 3.2 2 572 2.2 1 279
1-9 Micro 5.9 4 1,994 5.8 4 1,807 5.6 4 926
10-49 Small 19.4 16 2,486 19.5 15 2,016 21.5 18 1,012
50-250 Medium 71.7 65 1,124 68.5 62 870 80.7 72 492
Total 23.2 11 5,988 21.1 9 5,265 24.8 11 2,709
Note: This calculation only includes businesses with employment<251 in the year following the survey in the BSD (i.e. for SBS 2006, BSD 2007 employment values are used). Without the threshold rule, mean employment values for the SBS2010 were the following: ‘None’: 193, ‘Micro’: 433, ‘Small’: 128, ‘Medium’: 181. Medians remains almost unchanged. Similar inconsistencies are found for the SBS2006 and 2007.
The survey categorises the businesses into the four size bands listed on the left-hand side and there is a consistency between the mean and median. The one exception is the
category of businesses with no employees, where the BSD seems to report a consistently higher number of employees.
As the plots in Figure 2 show, the coverage variable also helps to increase the correlation between estimates from the survey and administrative data. Table 8 supports this by highlighting how the differences between survey employment and coverage is highly correlated. Where the coverage is low (e.g. a case where the survey response relates to one unit, and the enterprise link has a hundred local units), BSD reports a lot higher employment than the survey. This issue appears to be significantly ameliorated as coverage increases, and employment values seem to converge in cases of 100 per cent coverage. About three-quarters of the SBS responses that were linked are in this category.
Table 8: Coverage and differences in employment between SBS and BSD
Coverage Mean 50th per centile 75th per centile Std. Dev. Count
0 – 25 % -58,135 -3,410 -226 84,167 143 25.1 – 50 % -20 -3 1 79 188 50.1 – 75 % -40 0 10 294 53 75.1 – 99 % -1 3 13 30 37 99.1-100.1 % 0 0 3 27 3,092 Above 100.2 % 12 7 24 110 752 Total -1,948 0 5 18,586 4,265
Note: For SBS2006. The difference is calculated as (SBS2006 employment) – (BSD employment 2007). See Annex B2 for SBS2007 table.
The numbers do however suggest that coverage from 25 to 100 per cent provides a fairly good link in terms of employment figures. The medians for the differences between the survey response and the linked BSD entities are all around zero, whereas the 75th per centile is no higher than 13. In cases of 100 per cent coverage, both median and mean are zero.
Coverage is only an issue in cases where the linked business has multiple plants. The analysis has therefore then linked the survey responses for multi-plant businesses to the BSD local unit data for the respondent’s plant. In most cases, employment reported in the SBS is closer to the local unit that shares the same postcode as the surveyed firm. This suggests that the respondent may be estimating employment only for the local unit they are based in. The average difference is halved when using local unit employment, linked either through the full postcode or the postal outcode. This confirms the hypothesis that the large employment differences are not caused by false links, but by enterprise unit administrative data being linked to local unit survey data.
The main consideration when applying the different threshold rules is the number of observations remaining for analysis. Using the two rules separately, and when using them in combination, leaves a reasonable number of survey respondents available for analysis. Applying the employment rule leaves more than 95 per cent of businesses for analysis (this number will vary from year to year and between surveys). Applying both the
employment and the coverage threshold rule simultaneously will leave roughly 50 per cent of businesses. Depending on how sure analysts want to be that the survey response relates to the same unit of measurement as linked in the BSD, these rules can be used flexibly.
Influence of BSD Time Lags
Cross-sectional analysis of a survey faces a simultaneity problem. Analysis will examine the effect of particular capabilities on growth that occurs at the same time or shortly after the capability measures are taken. The main rationale behind linking survey responses to administrative data sources is that it allows analysts to construct longitudinal data and to assess the drivers of long-term outcomes. An issue with linking a survey response to administrative data then becomes the timing of the survey in relation to the longitudinal data.
The point in time to which a particular employment estimate in BSD data refers is complex because of the range of data sources used in estimation. The BSD employment numbers in the 2007 dataset, published in December, will be taken from the IDBR in March 2007. The IDBR estimates are based on actual employment numbers at a variety of points in time, but the most common would be September 2006. This is the point in time on which a number of key data sources will centre. For example, the PAYE based estimates in March 2007 will average payroll numbers over the previous twelve months; a similar averaging will occur on turnover data derived from VAT returns.
There is a further complexity due to the preference for ONS survey estimates over
administrative sources, even where the administrative data is more recent. In 2006-8, the period of the two SBS waves, the ONS surveys that routinely collected employment were the annual Business Register Survey in September, Annual Business Inquiry and monthly/ quarterly short-term employment surveys. Because ONS regards surveys as more
accurate and is reluctant to use lower quality payroll data, for some businesses surveyed by BRS the IDBR will retain the same employment estimate for up to four years even though updated payroll information is available from PAYE.
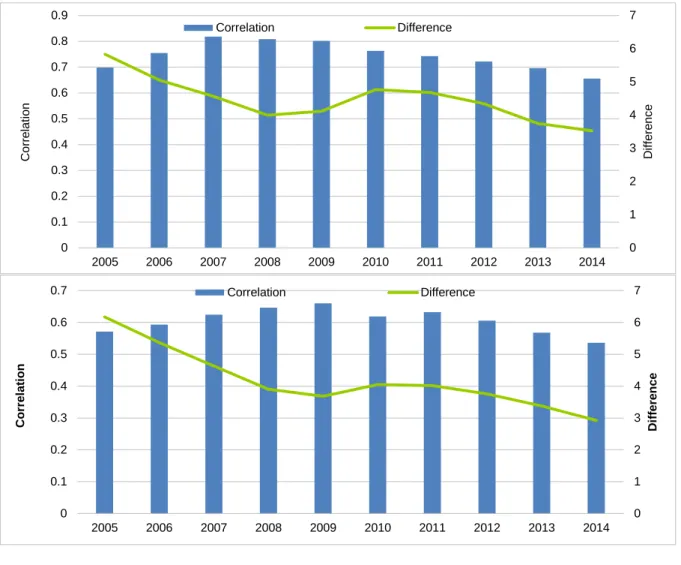
The Small Business Surveys for 2006 and 2007 were both conducted from November to March, crossing over two calendar years. Therefore, the expectation is that the survey numbers for a particular year will have high correlation with two years of the BSD: that for the following year and the year after. So SBS 2006 would have concluded in March 2007 and employment estimates in BSD 2007 or 2008 could present a comparable measure. Figure 3 shows the differences in average employment between the point in time estimate from the survey and the different updates of the linked BSD. It also looks at the correlation between the employment estimate in a survey and the BSD at firm level. The graphs focus on businesses with employment of 250 or less, meaning that the total number of
businesses is around 6000 for the SBS2006 and 5200 for the SBS2007. The total number of businesses changes from year to year as some businesses enter and exit the pool over time.
Figure 3: Employment comparisons between SBS and BSD over time11
11
See Figure B2 in Annex for boxplots, and differences between applying the two threshold rules.
0 1 2 3 4 5 6 7 0 0.1 0.2 0.3 0.4 0.5 0.6 0.7 0.8 0.9 2005 2006 2007 2008 2009 2010 2011 2012 2013 2014 D if fer enc e C or rel at ion Correlation Difference 0 1 2 3 4 5 6 7 0 0.1 0.2 0.3 0.4 0.5 0.6 0.7 2005 2006 2007 2008 2009 2010 2011 2012 2013 2014 D if fer en ce C o rr el at io n Correlation Difference
Note: The top graph contains information about the SBS2006, while the lower is for SBS2007. X-axis refers to different BSD years. Threshold rule applied: 250 employees or less.
The picture is largely similar across the two surveys. The average survey employment is consistently higher than the BSD employment. (This would not be the case if large businesses were included.) A possible explanation for this is that the survey asks for the total number of full and part time employees (including temporaries/casuals if directly employed, but not agency staff). The BSD, on the other hand, is counting the number of full time employees (see Sova et al., 2013).
The graphs also show how the average difference decreases, before then increasing again. Similarly, correlation increases and decreases. For both SBS2006 and 2007, it seems that the minimum average difference is found in the BSD for the survey year plus two years. For the SBS2006, the minimum difference is four employees on average in BSD 2008. For SBS2007 this is four in BSD 2009. With regard to correlation, this peaks at 2007 and 2009 respectively. This is consistent with expectations that the BSD will pick up the employment reported in the survey with a lag of one to two years.
Influence of BSD Employment Source
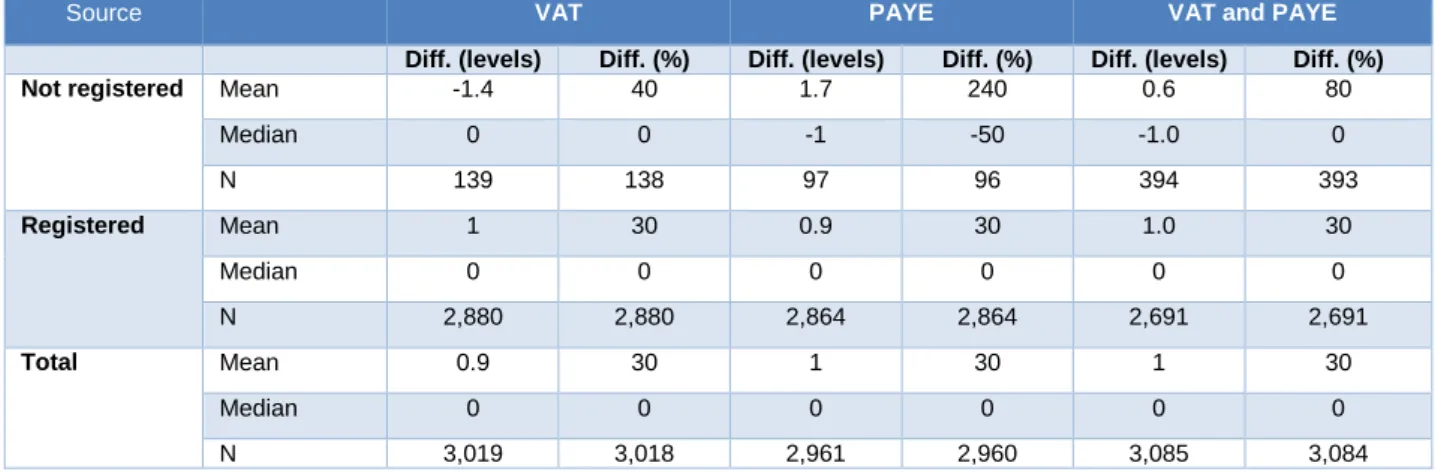
The BSD contains two variables that indicate whether the administrative data within the IDBR is derived from PAYE and/or VAT data. The ONS documentation suggests that combining these measures provides a quality measure within the IDBR, where good quality results from estimates being derived from both PAYE and the VAT register. In these instances, the ONS is confident that the administrative information is sourced robustly.
Looking only at surveyed businesses with BSD employment of 250 or less and 100 per cent coverage, it seems as if the VAT and PAYE quality markers influence the validity of employment estimates in the BSD quite markedly. About 5 per cent of linked businesses are not registered for PAYE. In these businesses the percentage difference between survey employment and register employment is very high, at 240%. Where the business is registered for PAYE, this difference drops to 30%.
Table 9 also indicates the difference in employment when businesses are registered for VAT. BSD employment is, on average, higher than that seen in the survey for these businesses.
Table 9: Source of BSD information and influence on employment differences.
Source VAT PAYE VAT and PAYE
Diff. (levels) Diff. (%) Diff. (levels) Diff. (%) Diff. (levels) Diff. (%)
Not registered Mean -1.4 40 1.7 240 0.6 80
Median 0 0 -1 -50 -1.0 0 N 139 138 97 96 394 393 Registered Mean 1 30 0.9 30 1.0 30 Median 0 0 0 0 0 0 N 2,880 2,880 2,864 2,864 2,691 2,691 Total Mean 0.9 30 1 30 1 30 Median 0 0 0 0 0 0 N 3,019 3,018 2,961 2,960 3,085 3,084
Note: For SBS2006. The difference is calculated as (SBS2006 employment) – (BSD employment 2007) for levels, and the equivalent for percentages. See Annex B3 for SBS2007 table. Threshold rule applied: both <251 employees and coverage is 100 per cent.
Business Expectations to Growth
In assessing the reliability of survey responses, a strand of analysis centres on
businesses’ ability to foresee their future growth trajectory (as well as correctly state their previous growth). Figure 4 shows a simple analysis comparing businesses survey
response on expectations to future employment growth to employment growth observed in the BSD. Across the two survey waves, businesses were asked the following two
questions about growth trajectories:
Q11. You said earlier that your business currently employs [INSERT Q1A RESPONSE] people, excluding owners and partners. How many people did the business employ 12 months ago across all sites?
Q17. How many people do you expect the business to employ in twelve months time?
From the response to these questions, businesses were divided into three groups12: those experienced/expecting positive growth, those experienced/expecting negative growth and those with no growth. SBS asks for employment numbers, but using these to calculate a numeric change proves hard, as it is not clear if all survey responses are coded
consistently. In many cases, it seems as if the survey has recorded the marginal
employment change rather than the expected number of employees one year later (i.e. a 100-employee business expecting to employ 108 one year later has the value 8).
Figure 4 and 5 look at two areas: one is the reliability of businesses’ responses about their growth trajectory and the other is the timing of the BSD. From the analysis on timing
earlier, it is expected that pre-survey growth relates to growth from 2007-2008 for
SBS2006 and 2008-2009 for SBS2007. It should be noted that the analysis only looks at continuing firms, thus not accounting for differential survival rates among the different categories of businesses. This also means that the number of observations is different from year to year. The counts in the actual graphs refer to the number of businesses in the middle year. Business survival will be investigated further in the next section.
Figure 4 looks at past growth, showing the year-on-year average employment growth for the three groups of businesses. The results suggest that there is some degree of
consistency between surveyed growth trajectory and the information held in the BSD. Businesses stating that they have downsized in the 12 months prior to the survey have the lowest average employment growth of the three groups. The ‘downsize’ group from the SBS2006 only touches the boundary for negative growth in the 2007-2008 BSD window. For the group in SBS2007, BSD shows negative employment growth from 2008-2009 and 2009-2010 as expected based on the survey response. The two remaining groups both show positive growth across the period. Those stating that they experienced growth are seen to have higher average growth rates.
12
Only very few businesses answered “Don’t know” (between 10 and 60 across both surveys and questions). These are excluded from the analysis.
Figure 4: One-year BSD employment growth by surveyed responses
Note: 1-year developments in employment, in percentage. The top graph contains information about the SBS2006, while the lower is for SBS2007. Threshold rule of employment<251 is applied.
Figure 5 looks at expectations to future growth among the surveyed businesses. From the analysis on timing earlier, it is expected that post-survey growth relates to growth from 2008-2009 for SBS2006 and 2009-2010 for SBS2007. The conclusions here are fairly similar to the ones above. Businesses seem capable of foreseeing future growth
accurately. Businesses expecting growth did experience higher growth than the remaining businesses. For the two remaining groups, the actual growth seems to be higher than the expected across both survey waves.
The graphs also highlight the general development in the SME environment across the period. The average one-year growth rate from 2006-2007 for the entire SBS2006 was 12%, going down to 3% in 2009-2010 (in 1-2 year lagged BSD time). For the SBS2007 population, the growth rate halved from 7.5% in 2007-2008 to 4% in 2010-2011.
Considering the lagged nature of the BSD, these numbers seem to correspond to the timing of the financial crisis and its effect on SMEs.
-5% 0% 5% 10% 15% 20% 25% 30% 35% 2006-2007 2007-2008 2008-2009 2009-2010 A ver ag e 1 -y ear e m pl py m e nt gr ow th BSD period
Downsized (n=761) Remained (n=2966) Grown (n=1246)
-5% 0% 5% 10% 15% 20% 25% 30% 35% 2005-2006 2006-2007 2007-2008 2008-2009 A ver ag e 1 -y ear e m pl py m e nt gr ow th BSD period
Figure 5: One-year BSD employment growth by surveyed expectations
Note: 1-year developments in employment, in percentage. The top graph contains information about the SBS2006, while the lower is for SBS2007. Threshold rule of employment<251 is applied.
Table B7 in Annex B tabulates actual and expected values along with a chi-squared
measure of association. The four tables suggest that there is a correlation between survey responses and a similar categorisation constructed on the basis of administrative data (i.e. businesses stating that they downsized in the survey, appear to have downsized more frequently in the administrative data). Survey responses to the question about prior growth are correlated with growth in the BSD, and respondents that expected future growth are likely to realise that growth in the BSD data. The relationship for prior growth is
considerably stronger than the one found for future growth.
For the comparison of prior growth, the results suggest that the association for the
SBS2006 is strongest in the 2007-2008 BSD window and in the 2008-2009 window for the SBS2007. This is illustrated by large increases in chi-squared values. This confirms earlier findings of the BSD timing. Interestingly, similar timing patterns are found for comparison between expectations to future growth and realised growth in the BSD (i.e. the strongest correlations are found in the same years as the analysis on prior growth). This finding
0% 5% 10% 15% 20% 25% 30% 2005-2006 2006-2007 2007-2008 2008-2009 A v er age 1 -y ear e m pl py m e nt gr ow th BSD period
Expect to grow (n=1842) Expect to remain same (n=3201) Expect to downsize (n=694)
0% 5% 10% 15% 20% 25% 30% 2006-2007 2007-2008 2008-2009 2009-2010 A ver ag e 1 -y e a r e m pl py m e nt gr ow th BSD period
suggests, somewhat unsurprisingly, that growth in the 12 months prior to the survey is correlated with expectations to growth in the 12 months following the survey.
6. Dynamics of Small and Medium
Enterprises: 2006-2013
Summary
This section looks at the performance of the businesses that responded to the 2006 and 2007 waves of the SBS. It covers the period after the survey to 2013, including the impacts of the recession in 2008. Firstly, the linking to the IDBR is used to analyse whether the businesses survive. This uses the ONS Business Structures Database. In the second section, some of the questions in the SBS are used to analyse the drivers for business survival.
This brief analysis illustrates the benefits of using longitudinal data, made possible by the data-linking exercise. The effect on survival and growth of drivers such as innovation or investment in training is difficult to identify using cross-sectional data in which indicators are contemporaneous. The effect of innovation on performance is perhaps the best example of this problem, as any performance impacts can take many years to become evident. The preliminary analysis conducted here, however, illustrates that the effect of such factors can now be assessed using the linked data. This lays the foundations for subsequent, more detailed analyses.
Demographic
Change in Businesses Responding to SBS 2006 and 2007
The dotted lines in Figure 6 records the percentage of enterprises where the linking provided businesses linked to a live ONS enterprise for each of the years from 2005 to 2014. The data used for this is the ONS Business Structures Database, which includes from its snapshots of the IDBR each year a variable indicating whether the enterprise is live during the year. Research has indicated the robustness of this measure; it is not simply a business dropping out of the BSD (Anyadike-Danes et al., 2010). Rather, a range of measures recorded in various administrative systems is used to prove whether a
business is alive. For example, ONS is regularly informed about whether businesses are maintaining a PAYE system and have employees.
This measure is qualified by constructing a death year variable for all successfully linked businesses, which includes both business activity measures (turnover) and the death variable created by ONS in the BSD (ONS variable “death”). The solid lines on Figure 6 show how this alters rates, when including companies whose turnover/employment was zero in the BSD, and companies that were pronounced dead by ONS.
Figure 6 indicates a gradual rise in the number of surveyed businesses that appear on the register until 2010. This reflects some of the businesses being too small to appear on the IDBR at the time of the surveys, but then appearing on the register as they grow. For the 2006 survey, 88 per cent of businesses surveyed are found on the BSD in 2005; this rises to 94 per cent by 2010. Considering the constructed death variable, the number of “live” businesses is lower yet, around 90 per cent for both surveys in 2010.
The fall in business numbers after 2010 is quite marked. The recession reduced the
number of businesses found on BSD to 78 per cent for SBS 2006 and 81 per cent for SBS 2007. This means a loss of about 1000 businesses surveyed in SBS 2006. During the same period, about 700 businesses that were surveyed in 2007 are also lost from the register. The percentage of businesses that die across the period is significantly higher, as the graph shows (1,455 dies of the SBS 2006 survey and 1,086 dies from the SBS 2007 survey).
As found in other studies of business demography, there is churn in the businesses that are on the register. For both waves of the survey, many businesses appear in the register, then have a spell of business activity, before disappearing. This is investigated further later in this Section.
Figure 6: Enterprises with ‘entref’ linked to yearly BSD datasets over time
Analysis of Firm Survival and Employment Growth
An examination of the determinants of firm survival and growth to 2014 illustrates the type of longitudinal analysis that can be undertaken as a result of linking the SBS with the BSD. It extends beyond recent studies such as Lee (2011). For the survival analysis two
dichotomous dependent variables were created representing firms which responded to the SBS2006 and survived through, firstly, the crisis (till 2011) and, secondly, through to the end of the panel in 2014.
For the analysis of firm growth, results from a probit regression and an OLS regression model are presented. These respond to the problem of relative growth rates in two
different ways. Using growth rates will inevitably result in smaller firms appearing to grow faster. If a firm has one employee and then takes on a second over the period examined, its firm size increases by 100%. By contrast, if a firm has 100 employees at the beginning of the period and it takes on a single additional employee over the period to 2014, its firm size increases by 1%.
For the probit analysis, the group of surviving firms were dichotomised into those exhibiting above-average employment growth over 2007-2014, and those exhibiting below-average
45% 50% 55% 60% 65% 70% 75% 80% 85% 90% 95% 2005 2006 2007 2008 2009 2010 2011 2012 2013 2014 SBS2006 SBS2007 SBS2006 excl. dead businesses SBS2007 excl. dead businesses