Household Consumption Patterns, Indirect Tax
Structures and Implications for Indirect Tax
Harmonisation: A Three Country Perspective
GEORGIA KAPLANOGLOU*
University of Cambridge, England and Bank of Greece, Greece
Abstract: The paper compares the indirect tax structures and consumption patterns of three
European countries (the UK, Greece and Hungary) and studies the likely distributional impact of a potential convergence of their indirect tax systems by exploiting the rich source of Family Expenditure Survey microdata of these countries. The results reveal a southern/northern distinction in expenditure patterns, while, in terms of tax systems and inequality, the common history of a market economy within the European Union shared by the UK and Greece proves to be a strong determinant of common structures. Over the last decade indirect tax structures among the three countries converged, at the same time loosing part of their redistributive power. Indirect tax harmonisation towards a simple system of, for example, the UK type might reduce inequality.
I INTRODUCTION
T
he process of increased economic integration in Europe has serious fiscal implications. A major policy concern has been that this process, through enhancing the mobility of commodities, capital and people, broadens the scope for externalities or spillover effects and tax-induced distortions in the83
* Support from the Commission of the European Communities under contract
ERBFMBI-CT95-0291 of the Marie Curie Fellowship program and from the British Economic and Social Research Council under Contract R00429514173 of the Postgraduate Research Studentships program is gratefully acknowledged. Material from the Family Expenditure Survey has been made available by the Office for National Statistics (ONS) through the ESRC Data Archive and is used by permission. I am indebted to Prof. David Newbery. Prof. V.Rapanos, Prof. M.Drettakis and Holly Sutherland for their guidance and useful comments. Careful comments and suggestions from Donal O’Neill and two anonymous referees are also gratefully acknowledged. All views expressed are the sole responsibility of the author.
allocation of resources. As far as indirect taxation is concerned, inter-country differences in commodity taxation may lead to cross-country differences in consumer marginal rates of substitution or in producer marginal rates of transformation, depending on whether the destination or origin principle of taxation is applied (De Bonis, 1999). Consequently, the destination principle implies inefficiency in global consumption and creates an incentive for consumers for cross-boarder shopping either through physical movement or just taking advantage of increased technological possibilities. The origin principle implies inefficiency in global production and creates an incentive for producers for moving production facilities. Tax harmonisation can be perceived as a way of avoiding both distortions irrespective of the taxation principle adopted. This is an important aspect of the theoretical rationale explaining the efforts of the European Commission towards some degree of indirect tax co-ordination among member-states.1
Any move towards such co-ordination might have serious distributional consequences. A large part of the relevant literature focuses on multilateral tax reform and the welfare effects of indirect tax harmonisation policies or the potential superiority of co-operative versus non-cooperative tax settings in a more game-theoretic approach (Keen, 1987, 1989; Turunen-Red and Woodland, 1990; Kanbur and Keen, 1993; Lopez-Garcia, 1998; Cremer and Gahvari, 2000, Keen et al., 2002). These contributions use models which inevitably take a very simplistic view of each national economy and its indirect tax structure, while any distributional implications of harmonisation are sidestepped.
More precisely, although some of the studies on indirect tax harmonisation explicitly recognise the need to take into account differences in the pattern of individual preferences and the acceptability or feasibility of various taxes when considering any proposal for tax rate convergence (see Smith, 1993 or Cnossen, 1990), there has been very little comparative work done on, for example, consumption patterns, indirect tax structures and their rationale among two or more EU member states. The purpose of this paper is to explore whether any valuable insights can be gained from such comparisons. More precisely, it explores the likely distributional effect of indirect tax harmonisation by means of comparing the spending patterns and existing indirect tax systems among countries whose indirect tax systems seek to be harmonised.
1Within a framework of common monetary policy, demand management and stabilisation policies
are to a large extent carried out by fiscal policy. This enhances the role of taxation as an automatic stabiliser and might be an additional concern in the design of the indirect tax structure (HM Treasury, 2003).
The United Kingdom, Greece and Hungary provide the choice of comparison. The UK and Greece are obvious choices, since they are both market economies – with the latter being a much more distorted economy – and also share similar economic and political influences and a common history within the European Union, while at the same time differing in size and level of economic development, the latter considered an important determinant of tax structures (Tanzi, 1987). Hungary, a former socialist economy in transition, is a less obvious, but nevertheless interesting choice. It has the same size and comparable level of economic development as Greece. However, economic development in Hungary arose from a completely different organisation of the economy and the society and different social processes for co-ordinating production and distribution decisions than either the UK or Greece. Furthermore, Hungary since the end of the 1980s has realised a radical restructuring of its economy and reoriantation of its fiscal and monetary priorities, such that it now qualifies as a member of the enlarged European Union.
The techniques employed in the paper lie within the framework of microsimulation modelling and are based on the same utilitarian welfare economics on which the theory of optimal taxation rests, though we use them to draw comparisons between countries and assess the likely distributional impact of a convergence of their indirect tax structures, rather than criticise the observed tax structure for its departure from optimality.
Section II provides an overview of the indirect tax system of Greece, the UK and Hungary and sets it in a macroeconomic framework in an attempt to understand its broad features and role in relation to other parts of the government budget. The methodological framework, within which the indirect tax systems of the three countries are compared and evaluated, combines tools from the theory on optimal taxation and microsimulation modelling techniques. This, along with the microdata sources used are analysed in Section III. The same section also provides a description of the key factors that would underpin the likely redistributive effect of indirect tax harmonisation. Section IV compares each of the countries along the dimensions identified above, with a view to examining the likely distributional effects of tax harmonisation. Section V concludes.
II INDIRECT TAXATION IN UK, GREECE AND HUNGARY: AN OVERVIEW
Any attempt to compare and explain how the taxation of different commodity groups is addressed in countries with distinct political, social and
economic histories would be fragmentary unless the role of indirect taxation is placed in a broader macroeconomic perspective. After all it is the macroeconomic conditions, the historical background and the beliefs of the government and the people about what constitutes an acceptable approach to indirect taxation that will determine the structure of the indirect tax system and the role that it has been assigned to perform.2 Most of the above dimensions were indeed dissimilar in Greece, the UK and Hungary and, thus, led to quite diverse perceptions about the desired design of indirect taxation and the way in which indirect taxation resulted to operate in each of these countries.
We start by looking at Greece. As noted by Alogoskoufis (1995), Greek economic performance was one of the most impressive in post-war Europe. The big change was observed after the second oil crisis in 1979, when Greece started to diverge from the other OECD countries and “becomes unambiguously the worst performer in the OECD” (Giavazzi, 1995). The post oil-crisis period found Greece governed by the Socialist party, which only six years after the re-democratisation of the political regime was faced with strong demands for the promotion of equity, nationalisation and income redistribution. Increasing real incomes (through both wage and government transfer increases) was given high priority as a response to the previous suppression of the freedom of labour and the low-wage policies followed during the whole post-war period and also as a step towards the institutionalisation of a minimal welfare state in Greece. Although the increase in public expenditure, which was inevitable considering the accumulated social demands and the evident under-development of social services, was supplemented by the promotion of supply-side policies (which in practice proved inefficient), the results were not favourable for the prospects of the economy’s growth.
In a climate of increasing debts and the need for fiscal consolidation, tax revenue collection was considered of key importance. The need for healthy public finances was further reinforced by the imposition of the Maastricht criteria and the provisions of the Stability and Growth Pact. As a result, Greece witnessed a substantial rise in the level of taxation with the tax/GDP ratio increasing from less than 30 per cent to converge to the European Union average of more than 40 per cent between 1980 and 2000. A major feature of the Greek tax system is its reliance on indirect taxes, which have occupied a central position for over a century as the primary source of government
2See Tanzi (1987) and Burgess and Stern (1993) on the relationship between the structure of the
revenue.3The relative shares of direct and indirect taxes in total tax revenue are exactly the reverse of the European Union averages of around 60 per cent and 40 per cent respectively. The share of indirect taxes to GDP in Greece is among the highest in OECD and EU countries (see, OECD, 2001).
In 1987 Greece introduced VAT, as a result of its accession to the European Community. In 1988, VAT was levied at four rates: 3 per cent, 6 per cent, 16 per cent and 36 per cent. The very low 3 per cent rate covered cultural items (books, newspapers, magazines and theatres). The low 6 per cent rate covered most food items, heating oil, medicines, transport services, etc. The high (36 per cent) rate applied to luxury items or products creating negative externalities, like spirits, tobacco, television sets, motor fuel. The standard (16 per cent) rate applied to the remaining goods and services. Several items, like educational, medical and financial services, were and still are exempt from VAT. Since 1988, the two low and the standard VAT rates have been increased to 4 per cent, 8 per cent and 18 per cent respectively, while the top VAT rate has been abolished. Excises are levied on all the traditional candidates for such taxation, namely tobacco, petroleum products, alcoholic beverages and beer. Several additional taxes are levied on car purchase and use, all of which are highly differentiated by engine power and/or car technology. A variety of other taxes (like stamp duties) still apply at varying rates to a large number of products or transactions thus complicating the tax system, though their importance in revenue terms has decreased over time.
The UK has been a much purer market economy than Greece. Its economy is much larger in size, its path to industrialisation was hardly interrupted (with the exception of the world wars) and it enjoyed much higher levels of economic development and per capita GNP. The UK economy is based primarily on industry and services, while both Hungary and especially Greece are more agricultural economies. On the taxation front, since the 1960s the overall tax burden has increased, with the relative significance of direct versus indirect taxes increasing until the mid-1970s and falling since then, while social security contributions have been steadily increasing throughout (see Kay and King, 1990, also Lee and Pashardes, 1988). Although the role of indirect taxation was enhanced in the UK during the 1980s under the influence of the conservative government, indirect taxes represent a much lower percentage in total tax revenue compared to Greece (see OECD, 1999). Despite the fact that the major redistributional role in the UK is performed through the expenditure side of the budget, the structure of indirect taxation,
3Alongside historical reasons one should also explain the high reliance of governments on indirect
taxation in terms of lack of ability or even political will to curb tax evasion in other parts of the tax system. Indicative is the co-existence of high statutory tax rates and low tax revenue yields in comparison to other EU countries.
albeit very simple, does reflect some broad distributional considerations. VAT is levied at a rate of 17.5 per cent (stable since 1991), with certain distributionally sensitive goods (like food, books, children’s clothing, medicines) being zero-rated. In 1994-95, a reduced rate was introduced for domestic fuel and power, originally 8 per cent, but now 5 per cent. Similarly to Greece, several services (like health, education, financial and insurance services) are VAT exempt. Excise duties are levied on tobacco, fuel, wine, beer and spirits, with tobacco and fuel excises steadily rising over time and excises on alcohol remaining stable or slightly falling since 1991. An annual car licence fee is also levied at varying rates according to car technology.4
The Hungarian economy differs from both the UK and Greece in several key aspects. Although it has the same population size and a comparable level of economic development to Greece (GDP per capita in Hungary taking account of differences in the purchasing power of the local currencies in 1991 and also in 2001 was around a quarter lower than in Greece), its historical legacy in terms of political and economic structure is radically different. Under socialist principles of political and economic organisation, production and distribution decision making was highly concentrated.
Unlike other socialist economies, in Hungary, especially after the 1968 reforms, the government was attempting to guide decisions at the enterprise level by taxes and subsidies rather than direct control. Thus, the tax and transfer system entailed high levels of both taxes and subsidies to enterprises. At the same time, taxes on personal income had a minor role, while indirect taxes and price subsidies were designed to play a major role in redistributing income and purchasing power – though sometimes in a distributionally undesirable way, for example in the case of housing subsidies (see Newbery, 1993 and Pudney, 1995).
The political and economic reforms of the last two years of the 1980s happened after a period of sluggish economic performance and a steadily worsening foreign debt. The accompanying tax reforms involved the introduction on 1 January 1988 of the Value Added Tax and a Personal Income Tax (PIT), followed a year later by an Enterprise Profit Tax (EPT) in a move towards a Western type of tax system (for an analysis of the Hungarian tax reform see Newbery, 1991). The effects of the reform were a dramatic fall in tax revenue from enterprises, as real GDP declined and so did the share of profits in GDP as well as the rate of direct tax on profits. At the same time the move to a market economy with numerous smaller firms had as a natural consequence the loss of information and reduced tax efficiency and tax
coverage.5Reduced tax efficiency characterised also the PIT system, though revenues from this source increased dramatically in recent years.
As far as indirect taxes are concerned, the VAT replaced a variety of turnover taxes leading to a more simplified tax stucture. The standard VAT rate was initially set and still is 25 per cent, with transactions relating to financial services, health care services, insurance and education being exempt. Initially, several distributionally sensitive items (including most foodstuffs, books, medicines, household fuel and power and a wide range of services) were zero-rated. By 1993-94 VAT rates stabilised, when VAT was extended to food, household fuel and power and other services, albeit at a lower rate of 12 per cent. Thus, currently the only zero-rated items are text books, specified medicines and medical materials and supplies. The initial reform kept excises on tobacco, alcohol and motor fuel, as well as subsidies on household fuels, district heating, medicine, public transport and some foodstuffs, though some of the latter were gradually eliminated over the next few years.
Despite the radical reform towards a market economy, the increase in after-tax income inequality has not been sharp (Kattuman and Redmond, 1997) mainly as a result of sustained social expenditures and remaining distributional considerations in the reformed indirect tax system. However undesirable, these policies will be hard to sustain in the future, since economic reforms were driven by considerations of efficiency at the expense of equity. Kornai (1992), for example, argues that the budget will be put under increased pressure as revenues will fall with the growth of the private sector leading to greater tax evasion and avoidance; it is hardly desirable to curb the private sector, which is intended to drive economic growth in the country. At the same time, falling GDP and private and public consumption are leading to a narrowing of the tax base (OECD, 1991), while increased market inequalities increase the need for provision of a safety net for the disadvantaged. It becomes evident that budgetary pressures, though driven by different sources, are comparable in both Greece and Hungary and so is the need for increased tax revenues.
III METHODOLOGY AND DATA
The methodological approach adopted uses microsimulation modelling, a recent but increasingly used tool in policy analysis.6 Microsimulation
5For a theoretical analysis of a tax system during reform see Newbery (1997).
6 For a recent review of articles on microsimulation modelling, see Mitton et al (2000). For
applications on indirect taxation, see Redmond et al.(1996); Davies et al.(1987); Baker et al. (1990) and Decoster et al.(1996).
modelling, introduced by Nicholson (1964) in the UK and Pechman and Okner (1974) in the US, arose as an alternative to the common practice in policy making of basing redistributional reforms on the analysis of a few hypothetical households meant to be representative of the population. Microsimulation models are instead computer programs that simulate the total national population of individuals or households using a micro-data sample of such units. The sample is representative of the national population in the sense that it includes both the whole range of real households and in the correct proportions.
The merits of such an approach are well established. The information available in the microdata sets regarding spending patterns, income sources, demographic, employment, location and a range of other household characteristics, allows detailed simulations of public policies. Specifically as regards indirect taxation, expenditure data are available at a household and/or individual level for a few hundred expenditure groups, so that even complicated indirect tax structures (like the Greek one) can be modelled in detail. Furthermore, such models retain the full range of individual characteristics at every analytical stage, thus taking full account of the variation between individuals and providing improved qualitative and quantitative information for evaluating tax structures. On the other hand, this approach is not free of limitations, especially as regards its static and “closed” view of the economic system. The distribution of the indirect tax burden, for example, is analysed on an annual rather than lifetime basis and there are reasons to suspect that this might make a difference (see Poterba, 1989, Slemrod, 1992 and Davies et al., 1984). However, the static nature of the microsimulation approach would be more limiting for policy options concerned with intertemporal transfers, for example pension systems, rather than indirect taxes.
The primary data sources are the Greek 1988 Family Expenditure Survey (FES) microdata set conducted by the National Statistical Service of Greece, the UK 1991 FES microdata set (Great Britain Department of Employment, 1992) and the Hungarian 1991 Household Budget Survey microdata set (Hungarian Central Statistical Office, 1993). A brief description of the surveys, their quality and their degree of comparability is provided in Kaplanoglou (1999).7The surveys in all three countries record household expenditure on a
7These surveys, though not the most recent, are comparable across the three countries since they
were conducted broadly during the same period. In any case, consumption patterns do not drastically change within a short period of time. For example, expenditure data from the most recent Greek HES conducted in 1999 are remarkably similar to the older data used in the paper. Correlation coefficients between the old and the most recent distributional characteristics (for a definition, see later) attain values of around 0.95.
rather detailed set of commodities (e.g. around 300 commodity groups in the Greek Household Expenditure Survey). This expenditure includes any indirect taxes levied on the commodities. Information on the tax rates applying to each commodity group has been collected and tax payments have been calculated at a household level.8We assume that indirect taxes are fully shifted to consumer prices, and we ignore indirect taxes on intermediate goods that are not rebated. These are standard assumptions for this kind of study (Symons and Walker, 1988, Redmond, 1995, Newbery and Révész, 2000). For purposes of comparability, commodities have been grouped into eighty-seven categories.
Since, as explained in the introduction, the present approach lies within the tradition of normative optimal taxation theory, the distributional impact of the different indirect tax structures is evaluated and compared within the utilitarian framework by means of a social welfare function, i.e., focusing on the sum of individual utilities, which is maximised subject to a government revenue constraint by choosing the optimal values for certain policy variables (i.e. tax rates) – see Samuelson (1986). More specifically, the redistributive effects of indirect taxes are evaluated at a very disaggregated level through the calculation of the “distributional characteristics” of commodities. The notion of the distributional characteristic of a good was introduced by Feldstein (1972) as a convenient concept for introducing considerations of distributional equity in the analysis of optimal prices and taxes. Feldstein used this concept in the framework of optimal pricing of public enterprise products. Since then, the concept of distributional characteristics with variations (see Atkinson and Stiglitz, 1980) has been introduced in the theory of optimal commodity taxation. It has been the main source of modification of the Ramsey rules on optimal commodity taxation (Ramsey, 1927) by explicitly bringing about the inherent conflict between equity and efficiency considerations regarding the optimal structure of indirect taxes.
The distributional characteristic of a commodity, di, measures how concentrated consumption of the commodity is on the “socially deserving” and is defined as:
Σ
βhqixih hdi= ––––––––– (1)
qiXi
where qixih is the expenditure of agent h on good i, qiXi is aggregate expenditure on good iand βhis the social marginal utility of transferring one
8 For a description of the indirect tax system and the mechanics of its incorporation in the
database, see Redmond (1995) for the UK, Kaplanoglou (2000) for Greece and Newbery and Révész (2000) for Hungary.
euro to agent h, formally defined as:
∂W ∂Vh
βh––– ––– (2)
∂Vh ∂g
where W(V1,…,Vh,…VH)is a Utilitarian social welfare function, agent henjoys utility Vh = Vh(mh+g, q)that depends on income before transfers, mh, uniform lump-sum government transfers, g, and a vector of consumer prices, q.9In this sense, the “socially deserving” are those with high social marginal values of consumption, βh. We further normalise di by the average of βhover agents:
Σ
βhqixih hdi= ––––––––– (3)
β–qiXi
This is a useful normalisation since βh/β– gives a measure independent of units. Furthermore, now the distributional characteristic has the intuitive interpretation of measuring the relative benefit of giving a subsidy to commodityi(sum of βh’sweighted by the consumption of good i) relative to the benefit of giving a lump-sum subsidy to everyone (average β–). Note that the distributional characteristics of goods will only be irrelevant if they are the same for all goods, something that would happen if βh is the same for all households (no aversion to inequality) or if the relative quantity of goods purchased is the same for all households. In practice in most cases none of these assumptions holds. The conventional welfare assumption that βh declines as income (or consumption) rises implies that the value of di will be higher, the lower the income elasticity of demand for good iis – i.e. diwill be higher for a necessity than for a luxury.
To make this approach operational, one needs to know the expenditure on goods by different households (this information is readily available from the Family Expenditure Survey data) and also a method of calculating the welfare weights βh. The βhmay be specified in a number of ways. The approach used here is adapted from Atkinson (1970) and has been used in several empirical studies (for example, Newbery, 1995). Social welfare is represented by an additive utilitarian social welfare function, W = Σuh, where h indexes agents and uh is the isoelastic utility function defined over real consumption (expenditure) per equivalent adult (ch), or formally:
9In the empirical part, differences in household size and composition are accounted for using the
OECD equivalence scale, which counts the first adult in the household as 1, additional adults as 0.7 and children under 14 as 0.5. In this respect, an agent is defined as one equivalent adult, who is assumed to receive the total household expenditure divided by the number of equivalent adults.
(ch)1-ε
––––––– for ε1 1 – ε
uh= (4)
log (ch) for ε=1
Under the specific parameterisation of Wand uhwe have: ∂W ∂uh
βh= ––– ––– = 1. u'(ch) = (ch)–ε (5)
∂Vh ∂g
The parameter ε is an indicator of aversion to inequality. A value of 0 indicates no inequality aversion and βhis the same for all households; a value of 1 indicates that transferring 1 euro to someone of double the living standard of another has a social value of half that of the reference individual. A value of 5 and over approaches the Rawlsian “maxi-min” principle (for ε= 5 a marginal unit of income to the poorest is worth 32 times the value of a unit to someone with twice that income).
We now discuss how one could utilise the information on consumption patterns and existing tax structures in the three countries to study the likely distributional impact of a move towards harmonisation of their indirect tax structures. Within the above framework of analysis this could be done in three ways. The first way is to explore the extent to which distributionally sensitive goods are the same across the three countries. Similar consumption patterns would probably facilitate the adoption of reforms towards indirect tax harmonisation which reduce inequality. In comparing consumption patterns, an important role should also be attached to the extent of existing overall inequality of consumption.
The second way is to assess the degree of similarity of the indirect tax systems already applied in the three countries. Obviously, if the indirect tax structures in two countries are very dissimilar, as is rather the case between Hungarian and Greek or UK indirect taxes, then one might expect the distributional effect exerted by a move towards harmonisation of tax rates to be stronger.
The third way, which is partly related to the second, is to study the extent to which current indirect taxes are imposed on distributionally sensitive goods in each country and furthermore, to examine whether alternative tax systems would be better targeted in distributional terms. For example, the 1991 Hungarian indirect tax system which still rather strongly reflected distributional concerns would most probably lose part of its redistributive
power if replaced by a western-type tax regime. The three key factors described above are analysed in the following section.
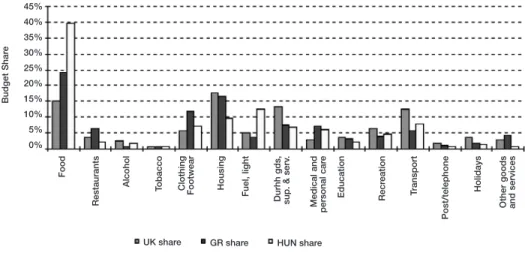
IV INDIRECT TAX HARMONISATION: A DISTRIBUTIONAL APPROACH We begin by comparing consumption patterns in the three counties, assessing the extent to which distributional characteristics of commodities are similar across the three countries and the extent to which similarities and dissimilarities in distributional characteristics can be attributed to differences in consumer preferences and underlying overall expenditure inequality. The broad spending patterns of UK, Greek and Hungarian households primarily reflect the underlying level of economic development of each country (Figure 1). Necessities like food, fuel and lighting occupy a distinctively higher share of the household budget in Hungary, while households in the much more developed UK economy spend considerably more in relative terms on household durables, transport and recreational goods and services. The budget shares of other commodity groups seem to be determined by consumer preferences, prices or demographics. For example, alcohol consumption is far more important in Hungary and the UK, which is probably to be explained by consumer preferences since the price of alcohol is lower in Greece and demographics are unlikely to play a role.
Figure 1: Budget Shares of Basic Commodity Groups (excluding Taxes): UK, Greece and Hungary
45% 40% 35% 30% 25% 20% 15% 10% 5% 0% Budget Shar e Food Restaurants Alcohol T obacco Clothing
Footwear Housing Fuel, light Durhh gds, sup. & serv
. Medical and personal car e Education Recr eation Tr ansport Post/telephone Holidays
Other goods and services
Turning to the more disaggregated level, Figure 2 gives the graph of distributional characteristics of Greece, the UK and Hungary for the value of inequality aversion of 1. Distributional characteristics of commodities in each country have been ranked by decreasing order and then plotted against the cumulative budget share of the same goods. Thus, commodities with high distributional characteristics (i.e. distributionally sensitive goods) lie on the left side of the graph, while commodities with low distributional character-istics lie on the right. Since the ranking of distributional charactercharacter-istics of commodities differs among the three countries, there is no direct correspondence of commodities among the three countries in terms of their location in the cumulative budget shares. Nevertheless, Figure 2 shows clearly that commodities are considerably more equally distributed across individuals in the former socialist economy of Hungary, than in the two market economies
Figure 2: UK, Greek and Hungarian Distributional Characteristics (inequality aversion 1)
marginal distributional characteristic
1.1 1.0 0.9 0.8 0.7 0.6 0.5 0.4 0.3 0.2 0.1 0.0 0 10 20 30 40 50 60 70 80 90 100
cum. budget share
of Greece and the UK. In the case of Hungary, there is rather little variation in the distributional characteristics for 80 per cent of expenditure, as their values decrease from about 1 to 0.8. The respective lines for Greece and the UK follow a much steeper pattern, for 80 per cent of the expenditure the values of the distributional characteristics decrease from about 1 to about 0.6. Note that although distributional characteristics are ranked for each country so that the position of specific commodities is different, the overall shape of the distribution is remarkably similar between Greece and the UK.
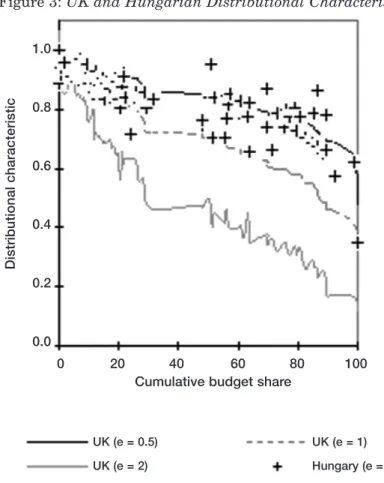
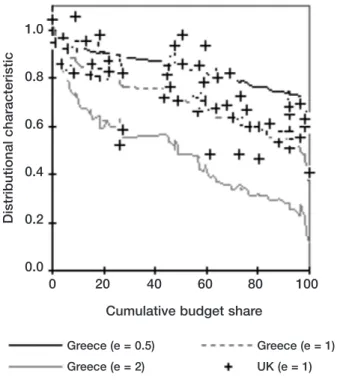
Similar information is conveyed by Figures 3-5, which give the graphs of distributional characteristics for pairs of countries. In Figure 3, the distribu-tional characteristics of the UK for the three values of ε(0.5, 1 and 2) are again plotted against cumulative expenditure shares corresponding to the ranking when ε = 1; this time the crosses show the values of the distributional characteristics for the same commodity for Hungary, located by its position in the cumulative UK expenditure share. Figures 4 and 5 have been constructed in a similar way for the other two pairs of countries (Greece-UK, Hungary-Greece).
The distributional characteristics for Hungary have higher values for almost the entire set of commodities compared to the Greek (see Figure 5) and the UK ones (see Figure 3), while the UK distributional characteristics follow closer to their Greek counterparts (see Figure 4). More detailed analysis would reveal that basic foodstuffs (for example, flour, bread, meat, vegetables and fruit) rank consistently high in all countries despite the striking differences in the ranking of several individual food items, which are driven by climatic differences, as well as differences in the production patterns of the countries. Items for which Greece is a heavy producer (for example, olive oil, vegetables, fruit, wine) are much more distributionally sensitive in Greece than either the UK or Hungary, while the opposite is true for items like processed meat, butter or margarine. Purchase of durables and especially cars ranks low in all three countries.
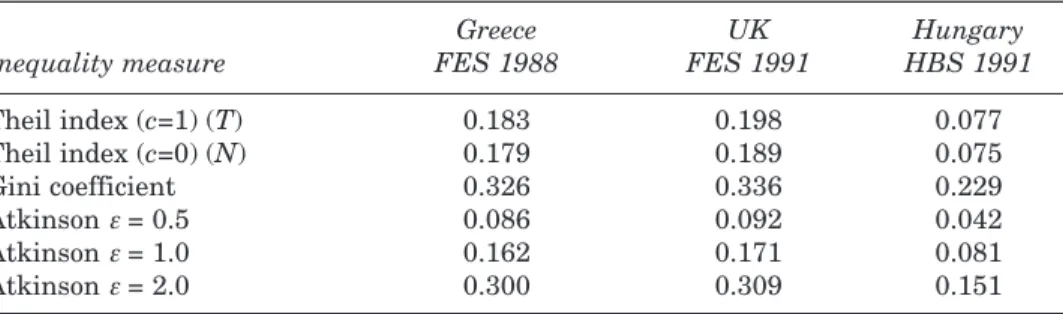
The patterns of the distributions in Figure 2 can be explained either in terms of the underlying expenditure elasticities of commodities and/or in terms of the underlying inequality in the expenditure distribution. To see the effect of the latter, several inequality measures have been employed and presented in Table 1,10 that is the well-known Gini index (Gini, 1912), the Atkinson indices for values of inequality aversion εof 0.5, 1 and 2 (Atkinson, 1970), and the two Theil indices, Tand N(Theil, 1967, also Shorrocks, 1980).
10 All measures refer to the distribution of aggregate total expenditure per equivalent adult using
the OECD equivalence scale for all three surveys. Regarding the sensitivity of results with respect to the choice of equivalence scale, the replacement of the OECD equivalence scale with the McClements one does not change the results in any significant way.
Clearly, by all inequality measures Hungary is a remarkably more egalitarian society than either the UK or Greece. All measures of inequality have considerably lower values in Hungary than in the two market economies, despite the fact that significant economic reforms towards a market economy were already under way in Hungary.11
What the comparison of the expenditure inequality levels suggests is that while the difference in the distributions of Figure 2 between the UK and Hungary (or Greece and Hungary) can be to a large extent accounted for by the remarkably higher expenditure inequality in the UK and Greece, any differences in distributional characteristics between Greece and the UK have
Figure 3: UK and Hungarian Distributional Characteristics
11Lorenz curves were also constructed for the three countries, indicating a clear dominance of
Hungary over Greece and the UK. The Greek Lorenz curve dominated the UK one though not by much. A recent OECD study reveals that inequality levels have not significantly changed in Greece and Hungary between the end of the 1980s and mid-1990s, while in the UK inequality increased during this period (OECD, 2002).
Distributional characteristic 1.0 0.8 0.6 0.4 0.2 0.0 0 20 40 60 80 100
Cumulative budget share
UK (e = 0.5) UK (e = 2)
UK (e = 1) Hungary (e = 1)
Figure 4: Greek and UK Distributional Characteristics
Figure 5: Hungarian and Greek Distributional Characteristics
Distributional characteristic Distributional characteristic 1.0 0.8 0.6 0.4 0.2 0.0 1.0 0.8 0.6 0.4 0.2 0.0 0 20 40 60 80 100
Cumulative budget share
0 20 40 60 80 100
Cumulative budget share Greece (e = 0.5) Greece (e = 2) Hungary (e = 0.5) Hungary (e = 2) Greece (e = 1) UK (e = 1) Hungary (e = 1) Greece (e = 1)
to be attributed to differences in expenditure elasticities and tastes, since inequality of expenditure is at incredibly similar levels for both countries. This suggests that if one abstracts from differences in overall inequality, commodity structures at least as captured by distributional characteristics are more similar between the two northern countries, suggesting that it might be easier to find directions of indirect tax harmonisation which reduce inequality in these two countries.
Turning to the analysis of the indirect tax systems, the average indirect tax burden is the highest in Greece (14 per cent), followed by the UK (11 per cent) and Hungary (8 per cent).12Out of 87 commodity groups, Table 2 presents the ten commodity groups with the highest tax shares, i.e. the most important tax bases. Despite differences in indirect tax rates, consumer preferences, expenditure patterns and policy priorities, there seem to exist some striking similarities. All three systems are rather concentrated, with around two-thirds of tax revenue being collected from just ten commodity groups. Car fuel and tobacco are the two most important tax bases in all three countries. Car purchase also seems to comprise an important revenue source. On the other hand, the tax share of alcoholic drinks (beer, wine and spirits) is among the highest in the UK and Hungary, while this is not the case for Greece. Overall, the correlation coefficient between tax rates on commodities in the beginning of the 1990s was 0.64 between Greece and the UK, 0.37 between the UK and Hungary and 0.33 between Greece and Hungary. This is itself a reflection of the tax harmonisation already having taken place by that time among EU countries. It is interesting to note that indirect tax reforms adopted in the three countries, and especially in Hungary, since then, led to a convergence of indirect tax structures. Thus, in 2003 the correlation coefficient between tax rates of commodities increased to 0.74 between Greece and the
Table 1. Inequality Measures for Consumption: Greece, UK and Hungary.
Greece UK Hungary
Inequality measure FES 1988 FES 1991 HBS 1991
Theil index (c=1) (T) 0.183 0.198 0.077 Theil index (c=0) (N) 0.179 0.189 0.075 Gini coefficient 0.326 0.336 0.229 Atkinson ε = 0.5 0.086 0.092 0.042 Atkinson ε = 1.0 0.162 0.171 0.081 Atkinson ε = 2.0 0.300 0.309 0.151
Sources: NSSG (1994), personal communication with D.Newbery (1994), Great Britain Department of Employment (1992).
T
able 2:
Commodity Groups with T
op T
ax Shares: UK, Greece and Hungary
UK (1991) Greece (1988) Hungary (1991) Group Budget T a x Cumul Group Budget T a x Cumul Group Budget T a x Cumul Share Share T ax Share Share T ax Share Share T ax Share Share Share Car fuel 3.2 15.6 15.6 Car fuel 3.3 14.8 14.8 Car fuel 4.5 21.2 21.2 T obacco 2.0 12.7 28.4 T obacco 2.3 10.6 25.4 T obacco 2.1 10.1 31.3 Beer 2.7 8.2 36.6 Housing 15.8 10.6 36.0 Housing 10.1 9.2 40.5 Restaurants 3.7 4.5 41.1 V ehicles 2.0 8.0 44.0 Other food 6.4 8.4 48.9 V ehicles 6.4 4.5 45.6 Other fuel 2.2 5.3 49.3 Spirits 1.0 4.8 53.7 Wi ne 0.8 4.0 49.6 V eh. Repair 2.6 4.9 54.2 V ehicles 1.5 3.4 57.1 Garden 3.0 3.9 53.5 W . clothing 3.8 3.5 57.8 Appliances 2.7 3.4 60.5 Spirits 0.6 3.3 56.9 Audiovisual 0.9 2.9 60.7 Beer 1.0 3.0 63.5 Laundry 2.1 2.7 59.6 M. clothing 2.6 2.5 63.1 W . clothing 2.1 2.8 66.3 W. clothing 2.0 2.6 62.2 Restaurants 6.0 2.4 65.5 M. clothing 1.7 2.3 68.6
UK, to 0.68 between the UK and Hungary and to 0.62 between Greece and Hungary. As will be shown later, the convergence of indirect tax structures had similar distributional effects in all three countries.
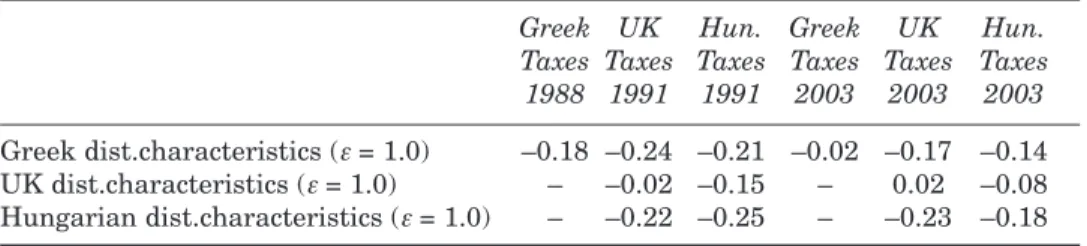
A way of assessing the distributional effect of indirect taxes at a very disaggregated level and the extent to which indirect taxes in the three countries are imposed on distributionally sensitive goods is by calculating the correlation coefficient between tax rates and distributional characteristics of commodities. A negative value of the coefficient would suggest that distributionally sensitive commodities attract relatively lower tax rates, implying that the system is in general targeted towards the “socially deserving”.13The correlation coefficients between tax rates and distributional characteristics weighted by budget shares of commodities are presented in Table 3. In the beginning of the 1990s, the correlation coefficient is –0.02 for the UK, –0.18 for Greece and –0.25 for Hungary. On that basis, the Hungarian indirect tax system appears to be the most successful on distributional grounds, since even by 1991 Hungary had managed to sustain substantial subsidies for a number of distributionally sensitive commodities. In Greece, the indirect tax system also appears to be rather progressive, though to a considerably lesser extent. However, more extensive analysis demonstrates that any observed progressivity of indirect taxation in Greece is entirely attributable to the taxation of cars and can be easily reversed under straightforward assumptions on charging for road use – for a more thorough exposition see Kaplanoglou and Newbery (2004). Finally, as explained in Section II, in the UK indirect taxation is not used as a major tool for
13 This way of assessing the distributional effect of indirect taxes lies within the theoretical
framework of optimal taxation theory, and thus is not directly related with more traditional measures of the redistributive effect of taxes (e.g. the percentage change of the Gini index, Kakwani, 1984). The latter are based on a mathematical analysis of the distribution and the redistribution of income (Lambert, 1993). Nevertheless, there is empirical evidence suggesting that the two approaches give similar results (Kaplanoglou and Newbery, 2003).
Table 3:Pearson Correlation Coefficients Between Distributional Characteristics and Tax Rates in Greece, the UK and Hungary
Greek UK Hun. Greek UK Hun. Taxes Taxes Taxes Taxes Taxes Taxes
1988 1991 1991 2003 2003 2003 Greek dist.characteristics (ε = 1.0) –0.18 –0.24 –0.21 –0.02 –0.17 –0.14
UK dist.characteristics (ε= 1.0) – –0.02 –0.15 – 0.02 –0.08
Hungarian dist.characteristics (ε = 1.0) – –0.22 –0.25 – –0.23 –0.18 Commodities have been weighted by their budget share.
redistribution, although it does reflect some distributional considerations. This is confirmed by the virtually zero correlation between tax rates of commodities and their distributional characteristics.
Table 3 also presents some evidence on the likely redistributive effect of several indirect tax harmonisation exercises, that is what is the likely distributional impact of replacing the tax system of one country with that of another, at least as captured by the correlation between the distributional characteristics and tax rates of commodities. We do not use the Greek indirect tax system as a model for the other two countries, because its complexity disqualifies it as an attractive candidate. Converging to the 1991 UK rates would benefit Greece (probably as a result of the zero-rating of food and other distributionally sensitive commodities), but not Hungary, whose tax system seems to be the best targeted. A move towards the 1991 Hungarian tax structure, which as indicated in Section II best reflects distributional concerns, would benefit in distributional terms both Greece and the UK, as the negative correlation coefficient between distributional characteristics and tax rates would become stronger.
Carrying out the same exercise with the indirect tax rates currently in place in the three countries allows several interesting conclusions to be drawn. Indirect tax reforms since the beginning of the 1990s led to more regressive tax structures in all three countries, as indicated by the weaker negative correlation coefficients in Greece and Hungary and the positive correlation coefficient in the UK. This is more evident in the case of Hungary and Greece. If tax harmonisation towards the Hungarian tax system currently in place were to replace the Greek or the UK one, the distributional effect would still be positive, but not to the same extent as before. Again Greece would benefit by indirect tax harmonisation either towards the UK or the Hungarian tax structure. Furthermore, replacing 2003 Hungarian taxes with 2003 UK taxes is now distributionally beneficial for Hungary. Finally, it is interesting to note that both in 1991 and now, the UK tax rates exhibit much stronger negative correlation coefficients with the Greek and Hungarian distributional characteristics, rather than with the UK ones. This would suggest that the distributional concerns reflected by the UK indirect tax structure (zero-rating of food, medicines, etc.) seem to be more effective in the less developed economies of Greece and Hungary rather than in the UK.
V CONCLUSIONS
To briefly conclude, in the case of Greece and Hungary, the common macroeconomic conditions identified in the beginning do not account for
particular similarities in either the level of inequality of overall consumption (Hungary appears a much more egalitarian society) or in consumption patterns (as the correlation of distributional characteristics is quite poor and difficult to explain in terms of differences in inequality) or in tax rate structures. In contrast, in terms of tax systems and inequality levels, the common history of a market economy in the European Union shared by the UK and Greece proves to be a strong determinant of common structures. As far as expenditure patterns are concerned, results reveal a southern/northern distinction, at least if we abstract from differences in overall expenditure inequality.
Regarding the likely distributional impact of indirect tax harmonisation, a convergence towards the 1991 Hungarian system would clearly benefit both Greece and the UK. However, such a system involves several subsidies and zero-rating of a large number of distributionally sensitive goods, and might not be sustainable within the EU budgetary framework. Hungary itself since 1991 further reformed its indirect taxes towards western-type models (indirect tax rates on the 87 commodity groups are now much better correlated among Greece, the UK and Hungary), with an apparently high distributional cost.
An important point that arises from the analysis is that even a simple western-type indirect tax structure, as perhaps best approximated by UK indirect taxes, with uniform VAT on all goods and services, certain distributionally sensitive commodities zero-rated and excises on a small number of goods has a certain distributional advantage over complicated indirect tax structures like the Greek one (which initially involved four VAT rates set with distributional criteria in mind) and is not much worse than a system involving many exemptions, zero-rating and subsidies, like the 1991 Hungarian one. Using the UK tax system as a benchmark has certain advantages in terms of reasonableness and political relevance as a sustainable system already in operation in a developed country. Furthermore, such a system approximates EU proposals of co-ordinating tax systems towards a simpler two-rate structure rather well. Finally, it can be shown that the UK indirect tax structure can to a large extent be rationalised in terms of optimal commodity taxation principles (Kaplanoglou, 1999).
Liberati (2001) reaches a similar conclusion, when assessing the distributional impact of simplifying the Italian indirect tax system towards the European proposal of a two-rate VAT. His results show that reducing the number of VAT rates, with the reduced VAT rate applying to goods with high distributional characteristics (like food) may be desirable even in the presence of distributional concerns. Similarly Creedy (2001) suggests that exemptions or tax reductions designed to introduce progressivity in fact provide a “blunt redistributive instrument”.
These results show that the likely distributional impact of indirect tax harmonisation towards a simple system of, for example, the UK type might not be negative for most EU countries.14 Certainly, such reforms should also be evaluated in terms of their impact on total tax revenue and the implications for the provision of public goods, and thus welfare, in those countries. In any case, any distributional costs have to be balanced against the benefits in terms of reduced tax administration and compliance costs of a simpler tax structure. Furthermore, the results relate to the analysis of indirect taxes independently of other redistributive taxes and transfer payments. Direct taxes and especially transfer payments offer much more effective redistributive instruments, though the degree to which these instruments are actually exploited in each EU country might substantially differ. Hence, the combined redistributive effect of all parts of the tax and expenditure sides of the budget in EU countries needs to be considered in a more comprehensive analysis of moves towards indirect tax harmonisation.
REFERENCES
ADAM, STUART and JONATHAN SHAW, 2003. “A Survey of the UK Tax System”, Briefing Note no. 9, London: Institute for Fiscal Studies.
ALOGOSKOUFIS, GEORGE, 1995. “The Two Faces of Janus: Institutions, Policy Regimes and Macroeconomic Performance in Greece”, Economic Policy.Vol. 20, pp. 149-192.
ATKINSON, ANTONY B., 1970. “On the Measurement of Inequality”, Journal of Economic Theory,Vol. 2, pp. 244-263.
ATKINSON, ANTONY B. and JOSEPH, E. STIGLITZ, 1980. Lectures on Public Economics,New York: McGraw-Hill International.
BAKER, PAUL, STEPHEN MCKAY, and ELIZABETH SYMONS, 1990. “The Simulation of Indirect Tax Reforms: the IFS Simulation Program for Indirect Taxation (SPIT)”, Working Paper no. W90/11, London: Institute for Fiscal Studies. BURGESS, ROBIN and NICHOLAS STERN, 1993. “Taxation and Development”,
Journal of Economic Literature,Vol. 31, pp. 762-830.
CNOSSEN, SIJBREN, 1990. “The Case for Tax Diversity in the European Community”, European Economic Review, Papers and Proceedings of the 4th Annual Congress of the European Economic Association, Vol. 34, pp 471-479. CREEDY, JOHN, 2001. “Indirect Tax Reform and the Role of Exemptions”, Fiscal
Studies, Vol. 22, pp. 457-486.
CREMER, HELMUTH and FIROUZ GAHVARI, 2000. “Tax evasion, Fiscal
Competition and Economic Integration”, European Economic Review, Vol. 44, pp. 1633-1657.
14The results of actually simulating the UK indirect tax system on Greek consumers can be found
DAVIES, E.H., ANDREW W. DILNOT, GRAHAM K. STARK and STEVEN J. WEBB, 1987. “The IFS Tax and Benefit Model”, Working Paper no. W87/9, London: Institute for Fiscal Studies.
DAVIES, JAMES B., FRANCE ST. HILAIRE, and JOHN WHALLEY, 1984. “Some Calculations of Lifetime Tax Incidence”, American Economic Review, Vol. 74, pp. 633-649.
DE BONIS, VALERIA, 1999. “International Tax Coordination: Indirect Taxation”, Economica Internazionale,Vol. 22, pp. 327-354.
DECOSTER, ANDRE, P. DELHAYE and GUY VAN CAMP, 1996. User’s Guide for ASTER: a Microsimulation Model for Indirect Taxes, Belgium: Katholieke Univesiteit Leuven, Centrum voor Economische Studien.
FELDSTEIN, MARTIN S., 1972. “Distributional Equity and the Optimal Structure of Public Prices”, American Economic Review,Vol. 62, pp. 32-36.
GIAVAZZI, FRANCESCO, 1995. “The Two Faces of Janus: Institutions, Policy Regimes and Macroeconomic Performance in Greece: Discussion”, Economic Policy,Vol. 20, pp. 185-186.
GINI, C., 1912.Variabilita e Mutabilita, Bologna.
GREAT BRITAIN DEPARTMENT OF EMPLOYMENT, 1992. Family Expenditure Survey 1991 [computer file], Colchester, ESRC Data Archive.
HM TREASURY, 2003. “Fiscal Stabilisation and EMU”, UK: Stationery Office. HUNGARIAN CENTRAL STATISTICAL OFFICE, 1993. Household Budget Survey
1991, Budapest.
KAKWANI, N.C., 1984. “On the Measurement of Progressivity and Redistributive Effect of Taxes with Applications to Horizontal and Vertical Equity”, Advances in Econometrics, 3, Greenwich, Conn: JAI Press, pp 149-168.
KANBUR, RAVI and MICHAEL J. KEEN, 1993. “Jeux Sans Frontières: Tax Competition and Tax Coordination When Countries Differ in Size”, American Economic Review,Vol. 83, pp. 877-892.
KAPLANOGLOU, GEORGIA, 1999. “Distributional and Efficiency Aspects of the Greek Indirect Tax System: a Microsimulation Analysis”, University of Cambridge, unpublished PhD thesis.
KAPLANOGLOU, GEORGIA, 2000. “A Microsimulation Analysis of the Distribution of the Indirect Tax Burden Among Greek Households” in L.Mitton, H.Sutherland and M.Weeks (eds.), Microsimulation Modelling for Policy Analysis: Challenges and Innovations. Cambridge: Cambridge University Press.
KAPLANOGLOU, GEORGIA and DAVID NEWBERY, 2003. “Indirect Taxation in Greece: Evaluation and Possible Reform”, International Tax and Public Finance, Vol. 10, pp. 511-533.
KAPLANOGLOU, GEORGIA and DAVID NEWBERY, 2004. “Reditributive Impact of Indirect Tax Reforms: Greece, 1988-2002”, Fiscal Studies, (forthcoming).
KATTUMAN, PAUL and JERRY REDMOND, 1997. “Income Inequality in Hungary, 1987-1993”, Discussion Paper on Economic Transition no. DPET 9726, Department of Applied Economics, University of Cambridge.
KAY, JOHN A. and MERVYN A. KING, 1990. The British Tax System, 5th edn. New York: Oxford University Press.
KEEN, MICHAEL J., 1987. “Welfare Effects of Commodity Tax Harmonisation”, Journal of Public Economics,Vol. 33, pp. 107-114.
KEEN, MICHAEL J., 1989. “Pareto Improving Indirect Taxation”, European Economic Review, Vol. 33, pp. 1-12.
KEEN, MICHAEL J., SAJAL LAHIRI and PASCALIS RAIMONDOS-MOLLER, 2002. “Tax Principles and Tax Harmonisation under Imperfect Competition: a Cautionary Example”, European Economic Review,Vol. 46, pp. 1559-1568. KORNAI, JANOS, 1992. “The Postsocialist Transition and the State: Reflections in the
Light of Hungarian Fiscal Problems”, American Economic Review, Papers and Proceedings, Vol. 82, pp. 1-21.
LAMBERT, PETER, 1993, The Distribution and the Redistribution of Income: a Mathematical Analysis, 2nd ed., UK: Manchester University Press.
LEE, CRISTOPHER and PANOS PASHARDES, 1988. “Who Pays Indirect Taxes?”, IFS Report No. 32, London: Institute for Fiscal Studies.
LIBERATI, PAOLO, 2001. “The Distributional Effects of Indirect Tax Changes in Italy”, International Tax and Public Finance, Vol. 8, pp. 27-51.
LOPEZ-GARCIA, MIGUEL-ANGEL, 1998. “On Welfare and Revenue Effects of Indirect Tax Harmonisation”, Economics Letters,Vol. 60, pp. 185-193.
MITTON, LAVINIA, HOLLY SUTHERLAND and MELVYN WEEKS, 2000.
Microsimulation Modelling for Policy Analysis: Challenges and Innovations, Cambridge: Cambridge University Press.
NATIONAL STATISTICAL SERVICE OF GREECE, 1993. Provisional National Accounts of Greece, 1992, X:10. Hellenic Republic, Athens.
NATIONAL STATISTICAL SERVICE OF GREECE, 1994. Data: Family Expenditure Survey 1987/88 [on computer tape], Athens.
NEWBERY, DAVID M., 1991. “An Analysis of the Hungarian Tax Reform”, CEPR Discussion Paper no. 558, London: Centre for Economic Policy Research.
NEWBERY, DAVID M., 1993. “Tax and Expenditure Policies in Hungary”, Discussion Paper on Economic Transition no. DPET 9306, Department of Applied Economics, University of Cambridge.
NEWBERY, DAVID M., 1994. Hungarian 1991 Household Budget Survey data (processed), personal communication.
NEWBERY, DAVID M., 1995. “The Distributional Impact of Price Changes in Hungary and the UK”, The Economic Journal, Vol. 105, pp. 847-863.
NEWBERY, DAVID M., 1997. “Optimal Tax Rates and Tax Design During Systemic Reform”,Journal of Public Economics,Vol. 63, pp. 177-206.
NEWBERY, DAVID M., and TAMAS RÉVÉSZ, 2000. “The Evolution of the Tax Structure of a Reforming Transitional Economy: Hungary 1988-98”, International Tax and Public Finance, Vol. 7, pp. 209-240.
NICHOLSON, JOHN L., 1964. Redistribution of Income in the United Kingdom in 1959, 1957 and 1953, Cambridge: Bowes and Bowes.
ORGANISATION FOR ECONOMIC CO-OPERATION AND DEVELOPMENT, 1991. Economic Surveys: Hungary, Paris: OECD.
ORGANISATION FOR ECONOMIC CO-OPERATION AND DEVELOPMENT, 1999. Revenue Statistics 1965/1998, Paris: OECD.
ORGANISATION FOR ECONOMIC CO-OPERATION AND DEVELOPMENT, 2001. Economic Surveys: Greece, Paris: OECD.
ORGANISATION FOR ECONOMIC CO-OPERATION AND DEVELOPMENT, 2002. “Income Distribution and Poverty in the OECD Area: Trends and Driving Forces”, OECD Economic Studies, No. 34, Paris: OECD.
PECHMAN, JOSEPH A. and BENJAMIN A. OKNER, 1974. Who Bears the Tax
Burden?,Washington DC: Brookings Institution.
Taxes”, American Economic Review,Vol. 79, pp. 325-330.
PUDNEY, STEPHEN, 1995. “Income Distribution and the Reform of Public Housing in Hungary”, Economics of Transition,Vol. 3, pp. 75-106.
RAMSEY, FRANK P., 1927. “A Contribution to the Theory of Taxation”, The Economic Journal,Vol. 37, pp. 47-61.
REDMOND, GERRY, 1995. “POLIMOD: the Calculation of VAT and Excise Duties on Household Expenditure”, Research Note no. 11, The Microsimulation Unit, Department of Applied Economics, University of Cambridge.
REDMOND, GERRY, HOLLY SUTHERLAND and MOIRA WILSON, 1996.
“POLIMOD: an Outline”, Research Note no. 19, The Microsimulation Unit, Department of Applied Economics, University of Cambridge.
SAMUELSON, PAUL A., 1986. “Theory of Optimal Taxation”, Journal of Public Economics,Vol. 30, pp. 137-142.
SHORROCKS, A.F., 1980. “The Class of Additively Decomposable Inequality Measures”, Econometrica, Vol. 48, pp. 613-625.
SLEMROD, JOEL, 1992. “Taxation and Inequality: a Time Exposure Perspective”, NBER Working Paper no. 3999, National Bureau of Economic Research.
SMITH, STEPHEN, 1993. “ ‘Subsidiarity’ and the Coordination of Indirect Taxes in the European Union”, Oxford Review of Economic Policy,Vol. 9, pp. 67-94.
SYMONS, ELIZABETH and IAN WALKER, 1988. “S.P.I.T. Version 4.0: Simulation Programme for Indirect Taxes”, Working Paper no. 7/88, The Institute for Fiscal Studies, London.
TANZI, VITO, 1987. “Quantitative Characteristics of Tax Systems of Developing Countries”, in D.M.Newbery and N.Stern (eds.), The Theory of Taxation for Developing Countries. New York: Oxford University Press.
THEIL, H., 1967. Economics and Information Theory, Amsterdam: North Holland. TURUNEN-RED, ARJA H. and ALAN D. WOODLAND, 1990. “Multilateral Reform of