University of Wollongong
University of Wollongong
Research Online
Research Online
Faculty of Engineering and Information
Sciences - Papers: Part B
Faculty of Engineering and Information
Sciences
2017
The effect of imputing missing clinical attribute values on training lung
The effect of imputing missing clinical attribute values on training lung
cancer survival prediction model performance
cancer survival prediction model performance
Mohamed S. Barakat
University of New South Wales, [email protected]
Matthew Field
Liverpool and Macarthur Cancer Therapy Centres, [email protected]
Aditya K. Ghose
University of Wollongong, [email protected]
David Stirling
University of Wollongong, [email protected]
Lois C. Holloway
University of Wollongong, [email protected]
See next page for additional authors
Follow this and additional works at: https://ro.uow.edu.au/eispapers1
Part of the Engineering Commons, and the Science and Technology Studies Commons
Recommended Citation
Recommended Citation
Barakat, Mohamed S.; Field, Matthew; Ghose, Aditya K.; Stirling, David; Holloway, Lois C.; Vinod, Shalini K.; Dekker, Andre; and Thwaites, David, "The effect of imputing missing clinical attribute values on training lung cancer survival prediction model performance" (2017). Faculty of Engineering and Information Sciences - Papers: Part B. 1495.
https://ro.uow.edu.au/eispapers1/1495
Research Online is the open access institutional repository for the University of Wollongong. For further information contact the UOW Library: [email protected]
Abstract
Abstract
According to the estimations of the World Health Organization and the International Agency for Research in Cancer, lung cancer is the most common cause of death from cancer worldwide. The last few years have witnessed a rise in the attention given to the use of clinical decision support systems in medicine generally and in cancer in particular. These can predict patients' likelihood of survival based on analysis of and learning from previously treated patients. The datasets that are mined for developing clinical decision support functionality are often incomplete, which adversely impacts the quality of the models developed and the decision support offered. Imputing missing data using a statistical analysis approach is a common method to addressing the missing data problem. This work investigates the effect of imputation methods for missing data in preparing a training dataset for a Non-Small Cell Lung Cancer survival prediction model using several machine learning algorithms. The investigation includes an assessment of the effect of imputation algorithm error on performance prediction and also a comparison between using a smaller complete real dataset or a larger dataset with imputed data. Our results show that even when the proportion of records with some missing data is very high (> 80%) imputation can lead to prediction models with an AUC (0.68-0.72) comparable to those trained with complete data records.
Keywords
Keywords
values, missing, performance, imputing, lung, effect, model, cancer, survival, clinical, prediction, attribute, training
Disciplines
Disciplines
Engineering | Science and Technology Studies
Publication Details
Publication Details
M. S. Barakat, M. Field, A. Ghose, D. Stirling, L. Holloway, S. Vinod, A. Dekker & D. Thwaites, "The effect of imputing missing clinical attribute values on training lung cancer survival prediction model performance," Health Information Science and Systems, vol. 5, pp. 16-1-16-11, 2017.
Authors
Authors
Mohamed S. Barakat, Matthew Field, Aditya K. Ghose, David Stirling, Lois C. Holloway, Shalini K. Vinod, Andre Dekker, and David Thwaites
Barakat et al. Health Inf Sci Syst (2017) 5:16
https://doi.org/10.1007/s13755-017-0039-4
RESEARCH
The effect of imputing missing clinical
attribute values on training lung cancer survival
prediction model performance
Mohamed S. Barakat
1,2*, Matthew Field
1,2, Aditya Ghose
3, David Stirling
4, Lois Holloway
1,2,5, Shalini Vinod
1,5,
Andre Dekker
6and David Thwaites
7Abstract
According to the estimations of the World Health Organization and the International Agency for Research in Cancer, lung cancer is the most common cause of death from cancer worldwide. The last few years have witnessed a rise in the attention given to the use of clinical decision support systems in medicine generally and in cancer in particular. These can predict patients’ likelihood of survival based on analysis of and learning from previously treated patients. The datasets that are mined for developing clinical decision support functionality are often incomplete, which adversely impacts the quality of the models developed and the decision support offered. Imputing missing data using a statistical analysis approach is a common method to addressing the missing data problem. This work inves-tigates the effect of imputation methods for missing data in preparing a training dataset for a Non-Small Cell Lung Cancer survival prediction model using several machine learning algorithms. The investigation includes an assess-ment of the effect of imputation algorithm error on performance prediction and also a comparison between using a smaller complete real dataset or a larger dataset with imputed data. Our results show that even when the propor-tion of records with some missing data is very high (> 80%) imputapropor-tion can lead to predicpropor-tion models with an AUC (0.68–0.72) comparable to those trained with complete data records.
Keywords: Missing data, Imputation, Decision Support, Modeling and Lung Cancer
© Springer International Publishing AG, part of Springer Nature 2017.
Introduction
According to the estimations of the World Health Organization (WHO) and the International Agency for Research in Cancer, lung cancer is the most common cause of death from cancer world wide [1]. One of every 4 cancer deaths is caused by lung cancer with 1.8 million new cases in 2012 and 1.59 million deaths [1, 2]. A sig-nificant proportion of patients with Non-Small Cell Lung Cancer (NSCLC) are not treated according to clinical practice guidelines mainly due to the difference in patient characteristics between the carefully selected clinical trial population from which the evidence-base is derived and the average patient cohort, consisting typically of older
patients with frequent comorbidities. Clinical decision support systems (DSSs) leveraging models mined from digital medical records of previously treated patients, can be potentially useful in determining personalized treat-ment based on patient and tumour specific factors [3,
4]. They can support physicians and patients, especially in cases where the relevance of clinical trial results and evidence based guidelines are in doubt. DSSs can corre-late patient attributes (including patient-specific clinical indicators, medical test/imaging results and information on co-morbidities) and treatments to outcomes (such as, survival, toxicity, quality of life). A DSS has the potential to effectively support decisions by predicting the out-comes that would be achieved for a given patient with a given treatment. This ability stems from being able to learn from past histories that record the same data items (patient attributes, treatment administered and the
Health Information Science
and Systems
*Correspondence: [email protected]
2 Ingham Institute for Applied Medical Research, 1 Campbell St, Liverpool, NSW 2170, Australia
outcomes in each case) using sophisticated data analytics techniques.
The reliability of models that underpin a DSS improves in direct proportion to the size of the dataset that is used to obtain these models [5, 6]. Clinical data tends to be noisy and is often replete with gaps. Clinicians and administrative staff often do not capture critical com-ponents of patient and treatment data in a structured electronic format (sometimes because they are under-standably driven by the immediate needs of patient care rather than the imperative of data collection). Some-times, the data is recorded in paper-based records. The size of the dataset required to build a reliable model is also proportional to the number of features (attributes) being used to obtain the prediction/classification out-come. If the size of the dataset is not large enough, the statistical significance of the prediction/classification outcomes will be low and the model will be prone to over-fitting. Entries in the dataset with missing data can-not be provided as input to the data analytics machinery, thus reducing the size of the effective dataset being used for prediction or classification. This has motivated much of the current work on imputing missing values [3].
There are two main approaches for dealing with miss-ing data. The first approach filters out the records with missing data and uses only the complete sets for building the models. The problem with this approach is that if the quantity of data is already small, reducing it will result in much smaller datasets, in turn reducing the reliability of the built models [7].
The second approach to overcome the missing data problem is to perform prior imputation to fill the gaps in the clinical training dataset before building the DSS. This is performed by building another mathematical-statis-tical model to predict the missing values [3, 8–10]. The imputation model is also used to predict missing attrib-ute values for the new patterns (corresponding to a new patient) that are added to the DSS after it has been built and has been operationally deployed.
One way to build such imputation models is using alto-gether different datasets that might have entirely different sets of patient attributes [3, 9]. As shown in [3, 8], such an approach for imputing missing values can improve the overall DSS performance. The main limitation of this approach is the need of another independent data set containing predictors for the missing field values, which may not be available.
Another way to overcome the missing values prob-lem without imputing them is to use a machine-learning algorithm which tolerates missing data for building the DSS [11]. The disadvantage of this approach is that it
limits the types of modeling and machine learning algo-rithms that can be used. For example, the support vector machine is a very common model for clinical DSSs as it is known to be robust to noise in data and over-fitting [12] but cannot work with missing data.
A common approach to overcome these limitations relating to external datasets and usable machine learn-ing algorithms is to build imputation models by analyz-ing parts of the available dataset that contains values for the parameters of interest. Then to impute values of these parameters in the dataset where these values are missing [9, 10], [13, 14]. In a manner similar to [7], we use this approach in this paper but additionally provide a com-prehensive analysis of the impact using different propor-tions of complete datasets to build imputation models.
This will make the DSS building process an ensemble learning process (i.e., one that uses and combines more than one model to enhance classification or predictive performance [15–18]).
There is no unique solution for the imputation problem and an imputation technique may perform well with one classification problem and not perform well with another [9]. According to [7, 9], detailed analysis to determine an acceptable missing data imputation method as well as the survival prediction model is needed for every different clinical data environment, set of variables and machine learning algorithm. To determine the appropriate impu-tation method for classification, the relation between imputation error and classification accuracy needs to be studied.
The aim of this paper is to mainly address two research questions.
1. The first question is to explore the effect of imputa-tion error on the classificaimputa-tion performance of the model.
2. The second question is to determine whether it is better to rely on a smaller dataset with no imputed values or a larger dataset with some imputed values for a model which would underpin a DSS; then, if imputation is effective, which imputation-classifica-tion algorithms combinaimputation-classifica-tion gives the best result for the NSCLC survival prediction using the available variables.
We assess this by building a NSCLC survival prediction model using the same data and a prior imputation model as in [3] (where the initial dataset had missing values which were imputed). Several models are built using dif-ferent proportions of imputed and real data to compare the performance.
Page 3 of 11 Barakat et al. Health Inf Sci Syst (2017) 5:16
Methods
Prior imputation methods
A common approach to fill the missing values is to rely on analyzing the existing values in the dataset to impute the missing ones. Two main approaches for achieving this are the statistical and the machine learning approaches.
The first, statistical approach includes simple proce-dures like replacing missing values with the mean values of the observed data. Another method, referred to as hot and cold deck imputation, fills in a missing value with the value of a similar complete pattern [9]. An alternative is using a missing category indicator, and replacing miss-ing values with the last measured value (last value carried forward) [10]. Single imputation of missing values usu-ally causes problems such as reducing data variability and causing the standard errors to be too small, since it fails to account for the fact that there is uncertainty about the missing values [9, 10].
The multiple imputation (MI) method [9, 10, 13, 14] is a sophisticated statistical imputation method that is effective when data is missing completely at random (MCAR) meaning that there is no systematic pattern of not recording the missing data that implies a clinical rea-son behind ignoring it or dependency between variables having missing values. It is also suitable for data that is missing at random (MAR). In the case of data not miss-ing at random (MNAR), statistical imputation cannot be used [19]. This method addresses the data variability and the uncertainty problem discussed above. It aims to allow for the uncertainty in the missing data by creating several different imputed data sets and combining results obtained from each of them.
The first stage is to create multiple copies of the data-set, with the missing values replaced by imputed values. These are sampled from their predictive distribution based on the observed data. Thus MIs are based on a Bayesian approach. The imputation procedure must fully account for all uncertainty in predicting the missing values by injecting appropriate variability into the mul-tiple imputed values. The second stage of the statistical approach is to use standard statistical methods to fit the model of interest to each of the imputed datasets. Esti-mated associations in each of the imputed datasets will differ because of the variation introduced in the impu-tation of the missing values. Standard errors are calcu-lated using Rubin’s rules [20, 21], which take account of the variability in results between the imputed datasets, reflecting the uncertainty associated with the missing values. Valid inferences are obtained because we are aver-aging over the distribution of the missing data given the observed data [10, 13].
The second approach for imputing missing values is the machine learning approach. The k-nearest neighbor
algorithm can be used to estimate missing values by find-ing the most similar complete k-data points or patterns and use their values [9, 22]. A lot of work has also been done to build more elegant machine learning algorithms like neural networks and decision trees for imputation [9,
22, 23]. Another method taking account of more values to improve the variance estimation is expectation maxi-mization (EM) which uses the statistical maximum likeli-hood of a missing value. This approach iterates through a process of estimating missing data and then estimating parameters. The Maximization step performs maximum likelihood estimation as if there were no missing data. Then, the Expectation step finds the conditional expec-tation of the missing values given the observed data and current estimated parameters. These expectation values are then substituted for the missing values [9, 20–22]. This approach continues until there is convergence in the parameter estimates.
The majority of the literature in imputation concludes that any imputation method’s performance relies on many problem specific factors including the depend-ency among the variables and the reasons behind occur-rence of missing data. Nonetheless, MI and the EM are the dominant methods used currently in several domains for imputation due to their ability to consider the uncer-tainty and variability of the imputed data [9, 13].
Lung survival classification methods
The classification problem tackled here is prediction of lung cancer survival after radiotherapy. Data relating to patients with NSCLC, who underwent a similar treat-ment protocol (a radical curative protocol) and where survival outcome was available, were used to build a clas-sification model after imputing missing data. This model could be used to classify newly diagnosed patients pre-treatment to predict survival if they undergo radical radiotherapy treatment. Based on this classification, a cli-nician could discuss treatment options with the patients on whether to proceed with this treatment or try another one.
The features selected to be predictive for NSCLC sur-vival after radiotherapy were the Eastern Cooperative Oncology Group (ECOG) scale of performance status, Forced Expiratory Volume in one second as a percentage of predicted (FEV1), Gender, Age and Gross Tumor Vol-ume (GTV) and the 2 year survival status as a target class based on availability and the studies reported in [24, 25].
The prediction models used in this work were based on several machine-learning algorithms: Naïve Bayesian (NB), Multi-layer Perceptron Neural Network (MLP), Decision Tree (DT), Random Forest (RF), Logistic Regression (LR), Polynomial Kernel SVM (Poly-SVM), Radial Basis Function Kernel SVM (RBF-SVM) and the
Pearson Universal Kernel SVM (PUK-SVM). To minimize potential bias in implementation and for reproducibility, all the models were implemented using the widely-used WEKA data mining tool [26]. The aim is not to compare the performance of those machine-learning algorithms but to show the effect of using an imputation algorithm before training the model. The prediction models were evaluated using the area under the curve (AUC) of the receiver operating characteristic (ROC) as it is the most common metric in evaluating classifiers and to ensure that the system performance is not sensitive to certain threshold values [7, 27]. These machine-learning algo-rithms were selected as they are highly utilized in this particular field of medicine [12, 28].
Experimental setup
Dataset description
A dataset of NSCLC patients was extracted and de-identified from the Liverpool Cancer Therapy Center information system and Picture Archiving and Com-munication System (PACS). The features extracted from the oncology information system included the age, gender, ECOG performance status, FEV1, and 2-year survival status of the Stage I-IIIB NSCLC patients who received radical curative radiotherapy treatment, based on a total dose of 45 Gy. The GTV for each patient was calculated from the computed tomography (CT) scans taken for radiotherapy plan-ning, which were available from the PACS. The avail-able data was found to consist of 269 patient records in total. Only 108 records contain values for every feature while the remaining 161 records have either missing ECOG or FEV1 values or both are missing. The gen-der and survival status values were binary values and ECOG data values were categorical. The remaining features values were continuous.
In this experiment we split the patient data into two separate data sets to investigate the effect of imputation error on prediction decision performance. Firstly, miss-ing values were randomly assigned within the complete dataset of 108 patient records in order to compute an imputation error as the difference between the imputed and real value. Secondly, we test the generalization of the prediction models on external data. The models were trained with 161 records that originally had missing values but were completed with imputation and where model parameters were calibrated using 10-fold cross-validation. We then tested these models on the 108 com-plete records dataset.
The complete dataset is referred to as the 108 dataset while the missing values dataset is referred to as the 161 dataset.
Experimental methodology
To investigate the effectiveness of using prior imputation on survival prediction, artificial gaps have been intro-duced randomly to the ECOG (categorical) and FEV1 (continuous) fields in the 108 dataset and imputation algorithms were used to fill those missing values. In addi-tion to the KNN and EM algorithms investigated in [7] this work also includes the mean imputation, hot–cold deck and MI for filling missing data in advance before building prediction models. The mean, hot–cold deck and KNN imputation modules were implemented in MATLAB [29] while the MI and EM imputation were conducted using the IBM SPSS software [30] to ensure unbiased implementation.
The ratios of cases containing missing data (ECOG, FEV1 or both) considered are from 10 to 100% in incre-ments of 10% and the survival status field has been removed completely during the imputation process to ensure independence. For each ratio, 10 different datasets were generated to ensure insensitivity of the results to coincidence that may have happened when the random gaps were made. This resulted in 100 different generated data sets. For each data set we applied the Little’s MCAR test and this showed that the missing values were MCAR [19]. This indicates that the status of whether data point is missing was not dependent on another variable in the data set and validates the application of imputation.
Each of the five imputation methods used in this work produced estimations for the missing values in each data set. The EM algorithm and MI algorithms were imple-mented in the SPSS software package [30] using a normal distribution for EM and the Markov Chain Monte Carlo algorithm for MI [31].
Performance evaluation
To address the first question, an error measure was cal-culated for each imputation algorithm. The normalized mean absolute error, E, between the imputed and actual values is calculated using:
where F is the number of features containing miss-ing data, xf′ is the imputed value in the fth feature, xf is
the actual real observed value for feature f. The maxi-mum and minimaxi-mum observed value of xf were used for
normalization.
The average 10-fold cross validation AUC for every model trained with the different levels of missing data (10–80%) is reported as the evaluation metric. Also, the same models were built using the 161 dataset where
E= 1 F F � f=1 1 N � � � �x ′ f −xf � � � max(xf)−min(xf)
Page 5 of 11 Barakat et al. Health Inf Sci Syst (2017) 5:16
100% of the records contain missing values; and the mod-els were tested on the 108 dataset.
To address the second question, a model is be trained for each level of missing data using only the small but complete part of the dataset, the 108 records dataset (no imputation) and compared with the model built on the whole imputed dataset. However, answering this ques-tion is not straightforward as there are several variables playing roles in achieving this answer including the train-ing data size, the machine learntrain-ing algorithm used for model building, the imputation algorithm and the evalu-ation method.
An experiment was set up to consider these values. First, the 108 patient complete dataset was used to evalu-ate the models built from datasets with different ratios of missing data. For instance, for 30% missing data another model is trained using only the 70% complete records without incorporating imputed records. The model is then tested using the 10-fold cross validation and on the original values of the 30% part used for testing the impu-tation. Second, the performance of models trained on the 161 patient dataset with missing values was tested on the 108 patient dataset and this is compared with the models built in the first step.
To report the significance of the results, uncertainty bars are displayed for all averaged results, estimated by calculating the 95% confidence intervals using the mean, standard deviation and sample size.
Results and discussion Imputation error
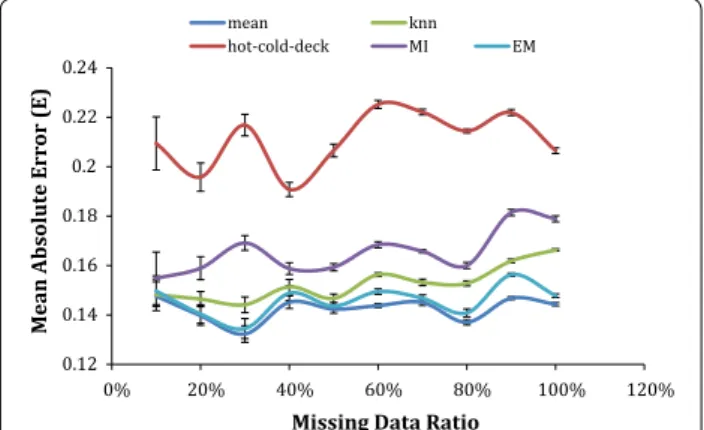
Figure 1 shows that using imputation for the lung cancer survival dataset has a minimum normalized mean abso-lute error of 0.132 when the ratio of records having miss-ing values was 10% and the maximum error was less than twice that, at 0.225, when the missing ratio was 100%.
The range of FEV1 was 27–125% and the range of ECOG is 0 to 2 in the collected datasets.
More importantly, for all the datasets there is a com-mon pattern of very high error for the hot–cold deck imputation method. From the uncertainty bars, there is no significant difference in the error of the rest of the used imputation algorithms except when the missing data ratio reaches 20% where the MI has error signifi-cantly higher than the mean, KNN and EM imputation. In general, it can be said that the hot–cold-deck has the highest error followed by the MI then the KNN and EM while the mean gives the lowest error.
Survival prediction
Complete data results
Figure 2 shows the average 10-fold cross validation AUC of different types of survival prediction models trained using the complete dataset of 108 patients without any missing values or artificial imputation. Using the com-plete data for building a survival model could achieve an AUC between 0.61, and 0.72, using the NB classifier.
Imputed data results
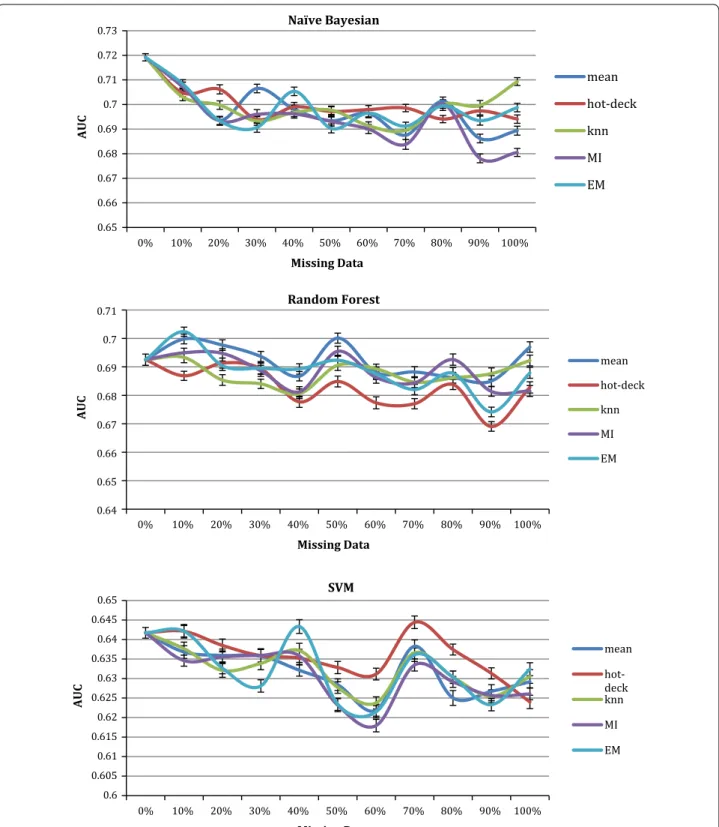
Figure 3 shows the values for the AUCs of the NB, RF and SVM prediction models when trained with datasets con-taining missing data imputed using statistical imputation methods (mean, hot–cold-deck, KNN, MI and EM). The figure shows these three classifiers results as an example; the rest show similar properties. For each missing data ratio, the imputation algorithms have produced similar AUCs where the lines and uncertainty bars intersect in many points despite that they had different normalized error results in Fig. 1.
Despite that the hot–cold deck had the highest abso-lute mean error as shown in Fig. 1, the AUCs of the pre-diction models trained by datasets containing hot–cold imputed data were very similar to the AUCs of the same prediction models trained with datasets having imputed
Mean Absolute Error (E)
Missing Data Ratio
Fig. 1 The error of the estimated missing values for each imputation
algorithm (colored) 0.5 0.55 0.6 0.65 0.7 0.75 AUC Model Type
AUC Missing Data Naïve Bayesian knn AUC Missing Data Random Forest AUC Missing Data SVM
Fig. 3 AUCs for survival Naïve Bayesian, Random Forest and SVM prediction models trained using dataset with 0–100% imputed data using 5
Page 7 of 11 Barakat et al. Health Inf Sci Syst (2017) 5:16
data using other algorithms. This indicates that while the distances between the imputed values and the actual value was high in magnitude, the direction of this differ-ence does not breach the class boundaries of this classifi-cation problem.
Several imputed datasets produced models with higher AUCs than the models trained without imputed values. This was found while using the 10 datasets with randomly assigned missing value positions. Imputed values are esti-mated according to similarity analysis with the existing values to be in the same range and therefore this can lead to data points of the same class being closer together and thus aids in fitting a classifier to the data.
Another observation from these graphs is that with 10% imputed data the prediction models had AUCs between 0.61 and 0.71. This is not significantly different to the complete data results of AUCs between 0.61 and 0.72, considering the uncertainty bars in Fig. 2. With 30% imputed data the prediction models had AUCs between 0.6 and 0.71. This means that for this problem and its collected dataset, imputing 30% of the dataset by analyz-ing the remainanalyz-ing 70% can help in buildanalyz-ing prediction models with AUCs very close to using the complete real dataset.
It was also found that even with high ratios of records contain missing data, between 80 and 100%, AUCs of 0.7 can be achieved. However, these AUCs are of the cross validation test where parts of the imputed data were randomly included in the test. Hence the next section describes experiments of building models using imputed data while the test is the real complete patient data with-out imputation.
Imputed external data results
As pointed out in the introduction, one motive for this work is investigating solutions for the scenario of having
incomplete records but building prediction models after imputing the gaps.
The same imputation algorithms were used to gener-ate five different training datasets and the same classifi-ers were built using each dataset. First, the models were tested for convergence on the training data using the 10-fold cross validation test. Then the models were tested using the complete 108 patients records used in the pre-vious experiment to ensure the generalization of the models.
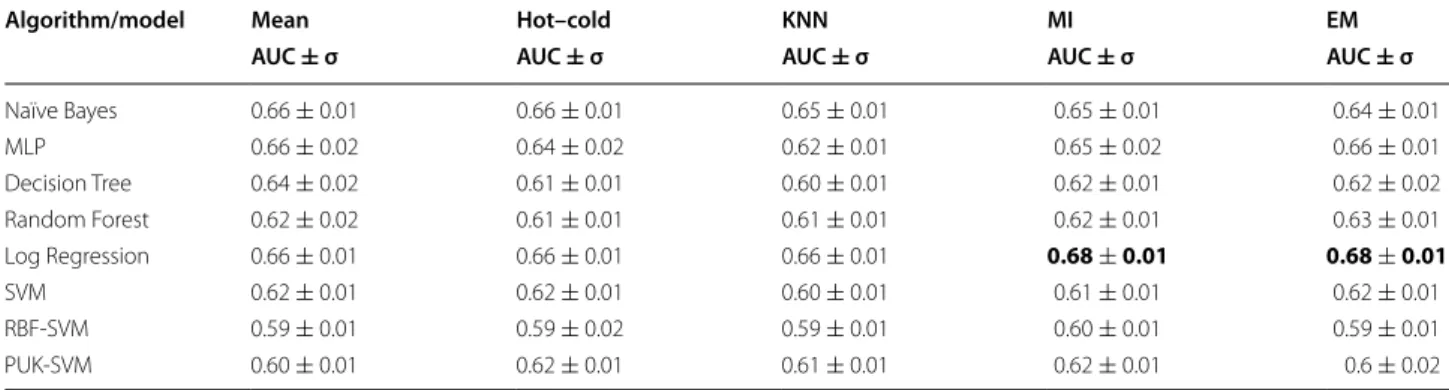
Table 1 displays the average AUC of the 10-fold cross validation testing for every model when trained with the five training datasets generated by imputing the missing data using the five imputation algorithms. All the tested models could reach AUC of at least 0.6 with one or more imputation algorithm.
The best performance achieved was by the LR model over all the tested models with AUC of 0.68 using data imputed by the MI or EM algorithms. This is different from the results in [7] as expected since the classification variables and classes are different [9]. The LR also had the best performance compared to other models when the data was imputed using the rest of the imputation algo-rithms. Another observation is also that the hot–cold deck imputation algorithm performance is comparable with the other imputation algorithms and not consist-ently lower despite the high-normalized error shown in Fig. 1.
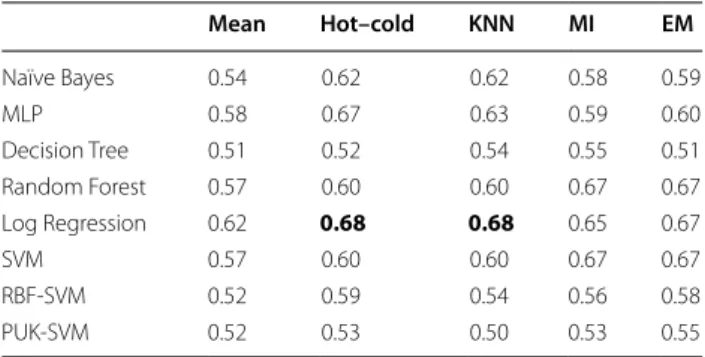
Table 2 displays the AUC of the same models when tested using the 108 complete real patient records. An AUC of 0.68 is still achievable with the LR model but trained using hot–cold deck and KNN imputed data sets. Using the MI and EM still gave comparable AUCs of 0.65 and 0.67 respectively.
There is a noticeable drop in the performance of all the models trained with datasets imputed by the mean
Table 1 Average AUC and standard deviation of the 10-fold cross validation calibration test of the imputed 161 patient dataset
The highest AUC values are highlighted in bold
Algorithm/model Mean Hot–cold KNN MI EM
AUC ± σ AUC ± σ AUC ± σ AUC ± σ AUC ± σ
Naïve Bayes 0.66 ± 0.01 0.66 ± 0.01 0.65 ± 0.01 0.65 ± 0.01 0.64 ± 0.01 MLP 0.66 ± 0.02 0.64 ± 0.02 0.62 ± 0.01 0.65 ± 0.02 0.66 ± 0.01 Decision Tree 0.64 ± 0.02 0.61 ± 0.01 0.60 ± 0.01 0.62 ± 0.01 0.62 ± 0.02 Random Forest 0.62 ± 0.02 0.61 ± 0.01 0.61 ± 0.01 0.62 ± 0.01 0.63 ± 0.01 Log Regression 0.66 ± 0.01 0.66 ± 0.01 0.66 ± 0.01 0.68 ± 0.01 0.68 ± 0.01 SVM 0.62 ± 0.01 0.62 ± 0.01 0.60 ± 0.01 0.61 ± 0.01 0.62 ± 0.01 RBF-SVM 0.59 ± 0.01 0.59 ± 0.02 0.59 ± 0.01 0.60 ± 0.01 0.59 ± 0.01 PUK-SVM 0.60 ± 0.01 0.62 ± 0.01 0.61 ± 0.01 0.62 ± 0.01 0.6 ± 0.02
imputation algorithm when tested using the external 108 patients dataset compared to the 10-fold cross vali-dation results. The only exception was the LR, which kept the same AUC of 0.62 in both cases. This can be interpreted as over-fitting the model to the training data resulting from using only one value to fill the gaps in the training data, which is the mean value extracted from the training data. This mean value was not close enough to the real values found in the external 108 patients test dataset.
Building a NSCLC survival model based on the ECOG, FEV1, Gender, Age and GTV predictors is possible and can reach AUC of 0.68 even when 100% of the records have a missing value for ECOG, FEV1 or both. LR gave the best performance and using the mean imputation has the negative effect of exposing the prediction models to over-fitting. There was also no strong relation between the imputation algorithm error in estimating missing data and the prediction performance of the models built using the imputed data.
Imputations versus no imputation
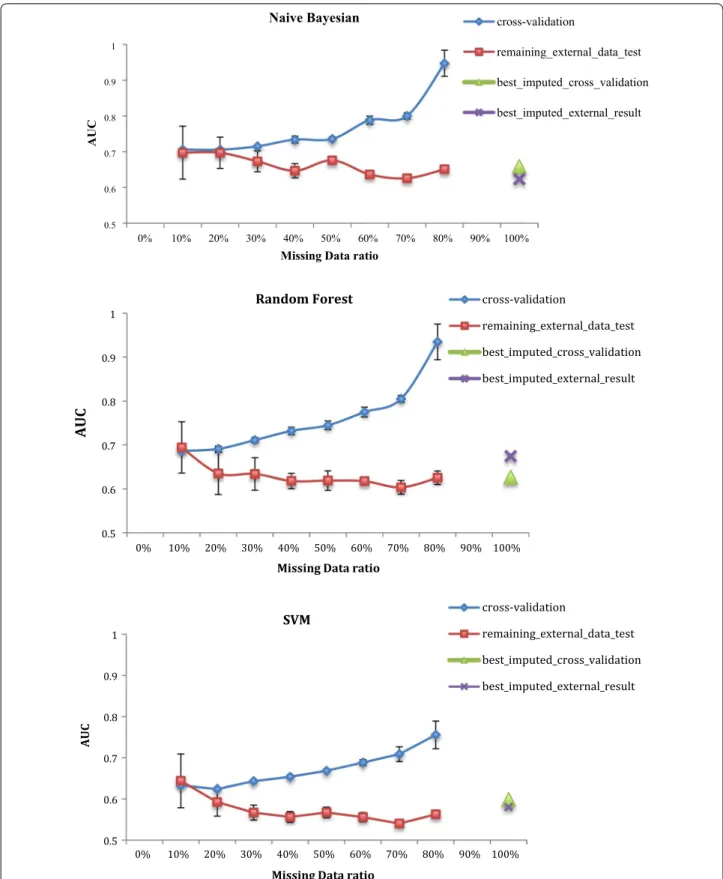
In Fig. 4 we show two modeling performance outcomes as the proportion of missing data is increased. The first is the AUC of the model trained on the complete data portion as assessed by 10-fold cross-validation. The sec-ond assessment is the AUC performance of the same model on the with-held portion of with missing data at each level. The additional points at 100%, marked by a triangle and cross, represent the best cross-validation and test AUCs of the approach when trained using the dataset of 161 patients that originally had missing data.
All five imputation algorithms were tested and only the highest AUC values were shown in the graph. The NB, RF and SVM results were the only ones shown for brevity.
With the increase of missing data and the decrease of training data, the cross validation results improve, how-ever, the external data AUC degrades to a lesser degree. This is expected as it is easier to fit a classifier to separate a small number of data points but it is also indicative of over-fitting. With more than 80% missing data for the set of 108 patients (86), no models could be built due to the low number of samples.
According to the figure, the cross markers, referring to models trained on data with imputed values, are always above or in the range of the red curve. This indi-cates that in this situation there is no significant impact of applying imputation and training with the larger imputed data set.
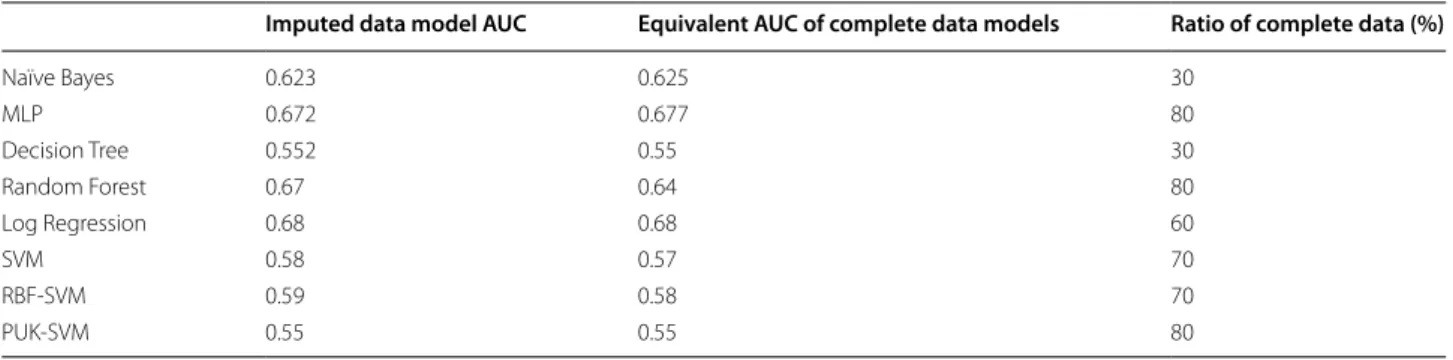
However, each classifier has different meeting points between the imputed data trained models performance and the size of the complete part of the data. Table 3
shows the AUC of the imputed data trained models and the equivalent AUC of the complete data along with the corresponding complete data ratio used to build this model. For example, the first row shows that the two NB models gave similar AUC when the complete data model was trained with only 30% of the 108 patients data (32 records); and that models trained with amounts over 30% of the training data gave higher AUC than the models trained with 161 imputed data when tested on external data and the ones trained with less than 30% gave lower performance.
But other models like MLP, RF and PUK-SVM had AUC equivalent to the imputed data model only when the ratio of the complete data became 80% (88 records). Of course, focus should be given to the models with the best performance in general and the table shows that LR, RF and the MLP have the best performance. The equiva-lent AUCs in the complete data part trained models were at 60, 80 and 80% respectively.
So the answer to the question of whether to impute or not depends on the kind of model used and the available amount of data. For all the models, when the amount was less than 30% of the 108 patients data, imputation was necessary to have a working model. Just 30% of this data (32 records) was enough to have NB and DT mod-els performing similarly to modmod-els trained using the 161 imputed records.
Table 2 Average AUC of the external data set test of the models trained with imputed 161 patients dataset and tested on the complete 108 patients records
The highest AUC values are highlighted in bold
Mean Hot–cold KNN MI EM Naïve Bayes 0.54 0.62 0.62 0.58 0.59 MLP 0.58 0.67 0.63 0.59 0.60 Decision Tree 0.51 0.52 0.54 0.55 0.51 Random Forest 0.57 0.60 0.60 0.67 0.67 Log Regression 0.62 0.68 0.68 0.65 0.67 SVM 0.57 0.60 0.60 0.67 0.67 RBF-SVM 0.52 0.59 0.54 0.56 0.58 PUK-SVM 0.52 0.53 0.50 0.53 0.55
Page 9 of 11 Barakat et al. Health Inf Sci Syst (2017) 5:16
Fig. 4 AUCs for survival Naïve Bayesian, Random Forest and SVM prediction models trained using the complete part only of 108 patients datasets
Conclusion
According to our analysis, there is no significant rela-tionship between error in estimating the missing values and the prediction AUC of the models built using the imputed data. The hot–cold deck imputation method had the highest normalized error in estimating the miss-ing data but it gave the highest AUC when used with the LR algorithm for building a model. The mean imputation algorithm exposes the prediction models to over-fitting while the hot–cold deck, KNN, MI and EM gave similar performance in terms of prediction AUC.
Unsurprisingly, a complete dataset is the best way to build prediction models. However, the amount of com-plete data needed to obtain a model performing at the same level of discriminability, in terms of AUC, as a model built using imputed records varied with differ-ent classifiers. Therefore the algorithm sensitivity to the level of missing data in the application may then be a sig-nificant factor in selecting which modeling approach to adopt. Logistic Regression models consistently exhibited superior performance in each of the tests.
Author details
1 South Western Sydney Clinical School, UNSW, Liverpool, NSW 2170, Australia. 2 Ingham Institute for Applied Medical Research, 1 Campbell St, Liverpool, NSW 2170, Australia. 3 School of Computing and Information Technology, University of Wollongong, Northfield Ave, Wollongong, NSW 2522, Aus-tralia. 4 School of Electrical, Computer and Telecommunication Engineering, University of Wollongong, Northfield Ave, Wollongong, NSW 2522, Australia. 5 Liverpool & Macarthur Cancer Therapy Centre, Sydney, NSW 2170, Australia. 6 Department of Radiation Oncology (MAASTRO), GROW School for Oncology and Developmental Biology, Maastricht University, Maastricht, The Nether-lands. 7 Institute of Medical Physics, School of Physics, University of Sydney, Sydney, NSW 2006, Australia.
Acknowledgements
This work was in part funded by a New South Wales Office of Health and Medical Research (OHMR) bioinformatics grant, RG14/11.
Publisher’s Note
Springer Nature remains neutral with regard to jurisdictional claims in pub-lished maps and institutional affiliations.
Received: 11 September 2017 Accepted: 23 November 2017 Published online: 06 December 2017
References
1. WHO. Estimated cancer incidence, mortality and prevalence worldwide in 2012. International Agency for Cancer Research. 2016. http://globocan. iarc.fr/Pages/fact_sheets_cancer.aspx?cancer=lung. Accessed 05 Dec 2016.
2. Key statistics for lung cancer. American Cancer Society. 2016. http://www. cancer.org/cancer/lungcancer-non-smallcell/detailedguide/non-small-cell-lung-cancer-key-statistics. Accessed 07 Dec 2016.
3. Dekker A, et al. Rapid learning in practice: a lung cancer survival deci-sion support system in routine patient care data. Radiother Oncol. 2014;113(1):47–53.
4. Abernethy AP, et al. Rapid-learning system for cancer care. J Clin Oncol. 2010;28(27):4268–74.
5. Sammut C, Webb GI. Encyclopedia of machine learning. Berlin: Springer; 2011.
6. Beleites C, Neugebauer U, Bocklitz T, Krafft C, Popp J. Sample size plan-ning for classification models. Anal Chim Acta. 2013;760:25–33. 7. García-Laencina PJ, Abreu PH, Abreu MH, Afonoso N. Missing data
impu-tation on the 5-year survival prediction of breast cancer patients with unknown discrete values. Comput Biol Med. 2015;59:125–33. 8. Jayasurya K, et al. Comparison of Bayesian network and support vector
machine models for two-year survival prediction in lung cancer patients treated with radiotherapy. Med Phys. 2010;37(4):1401.
9. García-Laencina PJ, Sancho-Gómez J-L, Figueiras-Vidal AR. Pat-tern classification with missing data: a review. Neural Comput Appl. 2009;19(2):263–82.
10. Sterne JAC, et al. Multiple imputation for missing data in epidemiological and clinical research: potential and pitfalls. BMJ. 2009;338:b2393. 11. Jochems A, et al. Distributed learning: developing a predictive model
based on data from multiple hospitals without data leaving the hospi-tal—a real life proof of concept. Radiother Oncol. 2016;121(3):459–67. 12. Kang J, Schwartz R, Flickinger J, Beriwal S. Machine learning approaches
for predicting radiation therapy outcomes: a clinician’s perspective. Int J Radiat Oncol. 2015;93(5):1127–35.
Table 3 AUC of the imputed data trained models and the equivalent AUC of the complete data along with the corre-sponding complete data ratio used to build this model
Imputed data model AUC Equivalent AUC of complete data models Ratio of complete data (%)
Naïve Bayes 0.623 0.625 30 MLP 0.672 0.677 80 Decision Tree 0.552 0.55 30 Random Forest 0.67 0.64 80 Log Regression 0.68 0.68 60 SVM 0.58 0.57 70 RBF-SVM 0.59 0.58 70 PUK-SVM 0.55 0.55 80
Page 11 of 11 Barakat et al. Health Inf Sci Syst (2017) 5:16
13. Olinsky A, Chen S, Harlow L. The comparative efficacy of imputation methods for missing data in structural equation modeling. Eur J Oper Res. 2003;151(1):53–79.
14. Steyerberg EW, van Veen M. Imputation is beneficial for handling missing data in predictive models. J Clin Epidemiol. 2007;60(9):979.
15. Opitz D, Maclin R (1999) Popular ensemble methods: an empirical study. http://jair.org/papers/paper614.html. Accessed 24 Oct 2016.
16. Rokach L. Ensemble-based classifiers. Artif Intell Rev. 2009;33(1–2):1–39. 17. Polikar R. Ensemble based systems in decision making. IEEE Circuits Syst
Mag. 2006;6(3):21–45.
18. Seni G, Elder JF. Ensemble methods in data mining: improving accuracy through combining predictions. Synth Lect Data Min Knowl Discov. 2010;2(1):1–126.
19. Little RJ. A test of missing completely at random for multivariate data with missing values. J Am Stat Assoc. 1988;83(404):1198–202. 20. Rubin DB. Inference and missing data. Biometrika. 1976;63(3):581–92. 21. Rubin DB. Multiple imputation for nonresponse in surveys, vol. 81. New
York: Wiley; 2004.
22. Aste M, Boninsegna M, Freno A, Trentin E. Techniques for dealing with incomplete data: a tutorial and survey. Pattern Anal Appl. 2014;18(1):1–29. 23. Rahman G, Islam Z. A decision tree-based missing value imputation tech-nique for data pre-processing. In: Proceedings of the ninth Australasian data mining conference—volume 121, Darlinghurst, Australia, 2011, p. 41–50.
24. Berghmans T, Paesmans M, Sculier J-P. Prognostic factors in stage III non-small cell lung cancer: a review of conventional, metabolic and new biological variables. Ther Adv Med Oncol. 2011;3(3):127–38.
25. Oberije C, et al. A Validated prediction model for overall survival from stage iii non-small cell lung cancer: toward survival prediction for indi-vidual patients. Int J Radiat Oncol. 2015;92(4):935–44.
26. Hall Mark, Frank Eibe, Holmes Geoffrey, Pfahringer Bernhard, Reutemann Peter, Witten Ian H. The WEKA data mining software: an update. SIGKDD Explor. 2009;11(1):10–8.
27. Swets JA. Signal detection theory and ROC analysis in psychology and diagnostics: collected papers. New York: Psychology Press; 2014. 28. Caruana R, Niculescu-Mizil A. An empirical comparison of supervised
learning algorithms. In: Proceedings of the 23rd international conference on machine learning, New York, NY, USA, 2006, p. 161–168.
29. MATLAB and Statistics Toolbox Release 2015a. Natick: The MathWorks, Inc. 30. IBM SPSS Statistics for Macintosh. Armonk, NY: IBM Corp; 2013.
31. Schunk D. A Markov chain Monte Carlo algorithm for multiple imputation in large surveys. AStA Adv Stat Anal. 2008;92(1):101–14.