Procedia Engineering 29 (2012) 1957 – 1962 1877-7058 © 2011 Published by Elsevier Ltd. doi:10.1016/j.proeng.2012.01.243 Procedia Engineering 00 (2011) 000–000
Procedia
Engineering
www.elsevier.com/locate/procedia2012 International Workshop on Information and Electronics Engineering (IWIEE)
Integrating Spatial Structure in Super-Resolution Mapping of
Hyper-Spectral Image
Bo Wu
a*, Changrong Li
a, Xilan Zhan
aaKey Lab of Spatial Data Mining and Information Sharing of Ministry of Education, Fuzhou University, 523 Gongye Road, Fuzhou,
P. R. China
Abstract
This paper proposes and validates a super-resolution mapping method based on minimization of energy function defined by spatial dependence and spatial texture structure. The method is a three-step classification routine that involves the integration of 1) Obtaining fractions of land cover classes of mixture pixels accurately; 2) Using energy function derived from the spatial dependence and spatial distribution of class proportions within and between pixels to formulate a super-resolution mapping model; and 3) Solving the nonlinear model with simulated annealing algorithm to obtain a sharpened image. A case study with real Hyperion dataset associated with ALOS image was implemented to validate the method. The experimental result confirms that this model can potentially capture the spatially anisotropic structure of sub-pixel land cover classes by incorporating spatial structure to spatial dependence, and thus of having better performance.
© 2011 Published by Elsevier Ltd. Selection and/or peer-review under responsibility of Harbin University of Science and Technology
Keywords: Super-resolution mapping, Markov texture, pixel unmixing, simulated annealing algorithm
1. Introduction
A problem can always be confronted in various remotely sensed applications where images obtained by single sensor can not simultaneously satisfy the accuracy on spatial, temporal and spectral requirements in practice. For instance, one may need to product high accurately thematic maps from high revisit frequency but coarse resolution satellate observed dataset. A natural problem turns to be how to achieve a sharpened thematic map with a coarse resolution image. Generally, a classical mixture pixel decomposition technique provides no indication of how different classes are distributed spatially within a
*
Corresponding author. Tel.: +86-591-87892671; fax: +86-591-87881789. E-mail address: [email protected].
Open access under CC BY-NC-ND license.
mixture pixel, although the composition of such pixels for different classes can be estimated [1]. Super-resolution mapping is an optional technique designed to use mixture pixel proportions with the assumption of spatial dependence. This method firstly segments the pixels of coarse resolution into smaller sub-pixels. The smaller units is then assigned correspond land cover classes by assuming that the land covers are spatially dependent both within and between pixels. This assumption is fulfilled on condition that the intrinsic scale of spatial variation in each land cover class is the same or greater than the scale of sampling imposed by the image pixels [2]. Consequently, it can not only overcome the limitation of spatial resolution for super-resolution mapping, but also help explore other spatial information such as object shape, edge and size et al [3].
Since the super-resolution mapping technique proposed by Atkinson in 1997 based on spatially dependence both within and between pixels, prior researches attempted many practical algorithms in the past decades, ranging from probability distribution or statistical assumption[4], minimizing spatial distance[2-3], to optimizing various function defined by energy model[5-6]. In spite of varying levels of success demonstrated by these methods, most of them were focused on maximizing spatial dependence of land cover classes at sub-pixel scale, but overlooked to involve spatial scale, shape and texture information, although they may provide potentially useful information for super-resolution mapping. To model spatial structure, Kasetkasem et al proposed to use Markov random field (MRF) to represent the spatial dependence within and between pixels[7]. This paper proposes another super-resolution mapping method by integrating maximal spatial dependence with spatial texture of land cover class proportions within and between pixels extracted by Gaussian Markov random field (GMRF) model to perform super-resoluion mapping. The proposed model assumes the intrinsic texture characteristics of spatial variation in each land cover class are the same at sub-pixels level. By imposing texture structure, it is expected to capture the spatial dissimilarity or spatially anisotropic structure of class labels in the allocation of sub-pixels labels, and hence possiblely provide more accurately mapping.
2. Super-resolution Mapping with GMRF
There are two main aspect information to be modeled in the proposed method.(1)Using GRMF model to capture anisotropic structure of land cover classes at sub-pixel level; and(2)Using inversed distance weighs to measure the spatial dependence between coarse pixel and surrounding pixels.
2.1. modeling Spatial dependence using distance weightings
For super-resolution mapping, coarse pixels are firstly divided into smaller sub-pixels, and land cover classes is then allocated to the latter by assuming maximally spatial dependence, i.e. the tendency for spatially proximate observations of a given property to be more alike than more distance observations. Spatial dependence is usually modeled by assigning different weights according to inversed distance to central point. Supposing a mixture pixel is composed by NCland cover classes, and there are α2
sub-pixels in each pixel, with α representing the scale factor in the row and column direction. Let NCkbe the number of classes k for sub-pixels to be assigned by fractions of coarse pixel, and
) , 1 , 0 ( , , <k≤NC ≤mn≤α
Dkmn denotes the spatial dependence among sub-pixels within a pixel located in (m,n)for class k. It is formulated with the multiply between the inversed distance weightings and land cover classes proportions of nearby pixels:
∑
= ⋅ = NV k k n m k w D 1 , , α (1)wherewk is a weight which can be calculated as the inverse of the distance of the sub-pixel to the coarse pixel center, and α denotes proportions derived from the fraction image. Let Xk,m,nbe a spatial
dependence indictor for land cover i and each sub-pixel j. Each sub-pixel has to be assigned a value 1 or 0 for each land cover class, 1 indicting an assignment to the particular land cover class, 0 otherwise.
, , 1 0 k m n X = ⎨⎧ ⎩ (2) In Eq. (2), 1indicates sub-pixel at m,nis assigned land cover class k, 0 otherwise. If zmeasures spatial dependence, the maximizing of spatial dependence can be formulated as:
, , , , 1 1 1 maximize NC a a k m n* k m n k m n z X D = = = =
∑∑∑
(3) Subject to: , , 1 1 , , 1 k 1, 2, , 1 , 1, 2, , a a k m n k m n NC k m n k X NC NC X m n a = = = ⎧ = = ⋅⋅⋅ ⎪⎪ ⎨ ⎪ = = ⋅⋅⋅ ⎪⎩∑∑
∑
(4)2.2. modeling spatial structure using GMRF
To model spatial dissimilarity, textural information is extracted to encapsulate prior structure for each class. Assuming the image generated from super-resolution mapping meets the condition of Gaussian Markov random field (GMRF) , where a pixel probability conforms a Gibbs distribution, i.e. the probability of a pixel can be predicted by other neighbor pixels. Therefore, the conditional probability of the modeled pixel has linear relationship of the conditional probabilities of neighbor pixels. The joint probability of Gibbs random field F=
{
F(s)s∈S}
is formulated1 ( ) exp[- ( )] p F f U f Z = = (5) Where =
∑
− f U fZ exp[ ( )]is called distribution function to be a normalized factor. U(f) denotes energy function which summarized by all energies related to cliques c ;
L + + = =
∑
( )∑
∈ ( )∑
∈ ( ( ), ( )) ) ( ' 2 2 1 1V f V f s f s f V f U c c cC cC (6) Where Vc(f)is defined energy function related to ccliques. It can be observed that the smaller of energy functionU(f), the larger value of probability of P(F= f), which means the case is the most one to occurrence. Here, only second neighbor cliques were modeled and the parameters P(f)of GMRF were estimated by least square method [8]. Vc(f)can be defined as:{ }
{ }
{ }
{ }
, ( ) ( ) ( ) , ( ) ( ) ( ) , 0 , i i r s i r x r x s r s C V r x r x s r s C r s C β β − = ∈ ⎧ ⎪ = +⎨ ≠ ∈ ⎪ ∉ ⎩ 且 且 (7)Thus the energy function would be written:
{ } , , ( )i j r s r NS U f V ∈ =
∑
(8)The probability of this distribution can be written as P(F = f):
1 exp
-P U f
Z
= ( ( )) (9) Here the spatial dependence of sub-pixels is represented by GMRF model. Where P achieves maximal value if the observed pixel can be predicted by its neighbor pixels but independent to other pixels.
3. A Unified Model and its Solution
The proposed model unifies the spatial dependence measured by inversed distance weighting and spatial structure by GRMF between and within pixels by a controlling parameterλ.
, , , , 1 1 1 in ( NC a a i m n i m n i m n m NG λ U f X D = = = = ⋅ )−
∑∑∑
× (11) Whereλ is a tuning parameter to balance effect of spatial dependence and spatial structure. To solve the nonlinear problem of Eq (11), this paper adopts Simulated Annealing algorithm (SA) for optimization [9]. It is well known that SA can avoid falling into local minimization in searching procedures since it cannot only get the best solution, but also take sub-optimal solution with a certain probability. Therefore, it is usually better than greedy algorithms, when it comes to problems having numerous locally optimum solutions. The main steps of SA are as follows:Step 1: Initialize – Start with a random initial placement of sub-pixel spatially distributedS0. Initialize
a very high “temperature”T0 =1000.
Step 2: Move – Perturb the placement through a random of sub-pixels locations.
Step 3: Calculate score – calculate the transfer probability from state i to j due to the move made. 1 ( ) ( ) exp( ) NG j NG i P NG i NG j NG j NG i T ≤ ⎧ ⎪ = ⎨ − ⎪⎩ ( ) ( ) ( )> ( )
Step 4: Choose – Depending on the change in score, determining to accept or reject the move. If ) 9 . 0 ( 0 0 = >P P
P , accepted , otherwise rejected;
Step 5: Update and repeat– Update the temperature value by lowering the temperature ) 1 log( 0 + =T h T . Go back to Step 2.
The process is done until NCmax =0.2%×H×W or h>hmax(
h
max=40)is reached.4. Case Study
4.1. Dataset Description
A real Hyperion hyper-spectral dataset associated with ALOS high spatial resolution image was conducted to test the performance of proposed method. The Hyperion is the classical 220 bands (Fig. 1) taken over in Pinghe county, Fujian Province, China in June 2005. The latitude and longitude of located area range from 19°45′50″-19°48′45″, and 122°1′41″-122°4′46″. The validated ALOS data over the same region were acquired in Feb, 2oo6. We first performed geometric correction on it, and so each corrected pixel of the output image has the same UTM coordinates as the Hyperion. The Hyperion spatial resolution is 30m, 12 times of the ALOS data (2.5m).
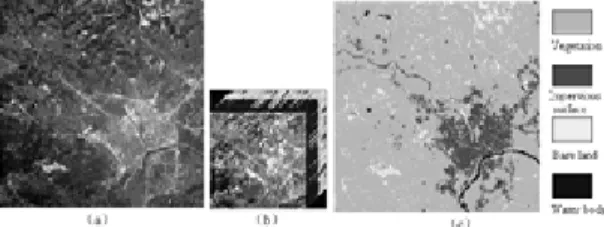
Fig. 1 Hyperion, Alos and classified images. (a)Alos data;(b)Hyperion image displayed as R=770nm、G=658nm、
B=556nm;(c)Classified map of Alos data
Fig. 1(a)is the associated high spatial resolution image with 2160×2160 pixels, and Fig. 1(b) is a 180
some water absorption and noise bands were initially excluded for brevity. Thus, the final dataset contains a total of 40 remaining spectral bands within visible and infrared channels for further analysis. A objected-based classification tool e-Cognition is used to classify the high spatial image into vegetation, impervious surface, bare land and water body as shown in Fig. 1(c). The overall classification accuracy is estimated by 92.8%, which is appropriate to validate the sub-pixel mapping of coarse image.
4.2. Unmixing of mixture pixels
To obtain high accuracy fractions of land cover classes of coarse image, we adopted a constrained linear mixture model under L1 norm minimization to decompose Hyperion image into vegetation, impervious surface, bare land and water body. The main advantage of adopting L1 norm optimization is that it can obtain sparse solution of land cover classes, which facilitates sub-pixels assignment and executive time for latter processing steps. The generative fractional images were shown in Fig. 2. The average RMSE of all fractions is 0.18.
Fig 2 Fraction of Hyperion using linear mixture model (a) vegetation;(b)impervious surface;(c)bare land;(d)water body 4.3. Super resolution mapping
To validate the proposed model, a linear optimal method based on inversed distance weights[6] was used for comparison. The super-resolution mapping result was listed as Fig 3(a). We set λ=1 in our method to validate super-resolution mapping of our method and the sharpened map was displayed as Fig3(b). It can be observed from Fig.3 by human interpretation that the proposed model can significantly improve the super-resolution mapping accuracy. It is obvious from zoomed sub-images that the proposed method removes the isolated land cover classes from surrounding classes, whereas spatial distance-based can not. As a result, the proposed method seems more spatially homogeneous.
Fig. 3 The super-resolution mapping results. Fig.4 The percentage of exchanged pixel, kappa coefficient and overall accuracy versus iterative times in SA algorithm
Table 1 Comparison two sub-pixel mapping methods (NCmax=0.2%×H×W)
Methods Bare land Vegetation Impervious surface Waterbody accuracy Overall coefficientKappa Producer accuracy 61.20% 43.44% 36.89% 38.11%
spatial
dependence User accuracy 89.06% 30.56% 14.09% 8.11% 56.7375% 0.1961 Producer accuracy 68.69% 46.86% 37.86% 38.39%
Proposed
From table 1, it can be quantitatively seen that the proposed method significantly improves the overall accuracy from 56.74% to 64.10%, and kappa coefficient from 0.1961 to 0.2518 correspondingly. It can also be observed from Fig.4 that with the increasing of iterative times the percentage of changed sub-pixels decreasing abruptly while kappa coefficient and overall accuracy increasing until to a constant value. This experiment shows our method outperforms traditional method.
5. Discussions and Conclusions
We proposed a novel sub-pixel mapping method by integrating texture information at sub-pixel level and spatially dependence. This method attempts to capture land cover classes spatial structure in sub-pixel mapping procedure by GMRF to represent spatially anisotropy within and between pixels. The mapping result demonstrates that our method can achieve more accuracy of sub-pixel mapping in that it can reach the maximizing spatial dependence within and between pixels and provides more spatially homogeneous. Although the compared experiment shows our method outperforms distance weightings method, the overall mapping accuracy is about 63%, whereas kappa only reaches to 0.25, much lower than other prior research reports. This probably because: (1) The super-resolution mapping scale is 12, much larger than other documents, where the scale is only 2-3 times[3]; (2)The predicting accuracies using the real data are lower than the simulated and synthetic data, because of the uncertainty of land cover classes proportions estimation; (3)geo-referenced, geometric corrected errors between Hyperion and ALOS, and the classification error of ALOS are inevitable reduce the super-resolution mapping accuracy.
Acknowledgements
The authors gratefully acknowledge the research support from the Natural Science Foundation of China (No. 40801181, 40901221), the Natural Science Foundation of Fujian province (No. 2010J01251), Key Science Fund Project of Fujian province(No. 2011Y0036) and China Postdoctoral Science Foundation funded project (No. 20090450182).
References
[1] Aiazzi R., Alparone L`, Baronti S, et al. Context-driven fusion of high spatial and spectral resolution images based on oversampled multiresolution analysis. IEEE Trans. Geosci. & Rem. Sens, 2002, 40(10): 2300-2312.
[2] Atkinson P. M.. Super-resolution target mapping from softclassified remotely sensed imagery. Proceedings of the 5th International Conference on GeoComputation, Leeds, UK:University of Leeds, 2001.
[3] Zhang L, Wu K, Zhong YF , Li PX. A new sub-pixel mapping algorithm based ona BP neural network with an observation model. Neurocomputing for Vision Research;Advances in Blind Signal Processing, 2008, 71(6): 2046-2054.
[4]Mertens, K. C., Verbeke, L. P. C.,Westra, T., & DeWulf, R. R. . Subpixel mapping and sub-pixel sharpening using neural network predicted wavelet coefficients. Remote Sens. Environ, 2004, 91:225-236.
[5] Verhoeye J. Wulf R.. Land cover mapping at sub-pixel scales using linear optimization techniques, Remote Sens. Environ. 2002, 79 :96-104.
[6] Tatem A.J., Lewis H.G., Atkinson P.M. and Nixon M.S., Superresolution target identification from remotely sensed images using a Hopfield neural network, IEEE Trans. Geosci. & Rem. Sens, 39: 2001.
[7] Kasetkasem. T, Arora MK., Varshney PK. Super-resolution land cover mapping using a Markov random field based approach.Remote Sens. Environ, 2005, 96:302-314.
[8] Zhao Y.The Markov model extension and its application in high spatial resolution image classification.Phd Dissitation of Wuhan university, Wuhan:2006.