PERFORMANCE ANALYSIS AND DEVELOPMENT OF PULL-TYPE
PRODUCTION CONTROL STRATEGIES FOR EVOLUTIONARY
OPTIMISATION OF CLOSED-LOOP SUPPLY CHAINS
Author:
Jonathan Reinholt Ebner Junior
This thesis is submitted in accordance with the requirements of
Dublin City University for the award of the degree of
Doctor of Philosophy (PhD)
Supervisors:
Dr. John Geraghty
Dr. Paul Young
School of Mechanical & Manufacturing Engineering
DCU - Dublin City University
DECLARATION
I hereby certify that this material, which I now submit for assessment on the programme of study
leading to the award of Doctor of Philosophy is entirely my own work, and that I have exercised
reasonable care to ensure that the work is original, and does not to the best of my knowledge
breach any law of copyright, and has not been taken from the work of others save and to the
extent that such work has been cited and acknowledged within the text of my work.
Signed: ________________________________________ID No.:15210017
Jonathan Reinholt Ebner Jr.
DEDICATION
To God for the unlimited wisdom, inspiring greatness and for allowing the grace of technological
development and scientific research.
To my beloved parents Mr. Jonathan Reinholt Ebner and Ms. Neuza Rosa Ebner, who generously
devoted their lives to my success. For their love, unconditional support and outstanding education
provided.
ACKNOWLEDGEMENTS
Dr. John Geraghty and Dr. Paul Young for the extensive knowledge, brilliant intelligence, the
relentless guidance, support and the amazing personality to mentor and successfully manage the
development of so many students.
Dr. Joseph Stokes, Dr Brian Corcoran, Dr. Bryan MacDonald, Dr.Yann Delaure, Ms. Caoimhe
O'Broin and all the academic and non-academic staff of the School of Mechanical and
Manufacturing Engineering - DCU. Thank you for all your kind support during my research time
at Dublin City University.
The Brazilian Government, through the CNPq (National Council for Scientific and
Technological Development), for their wise investment in higher education, research and
technology, while the Nation faces one of the longest and deepest economic depressions on
record.
To all Professors, Lecturers, Authors and Researchers that to any extent had a positive impact on
my research work.
To my siblings: Fabio, Joana D’arc and Stenio for their presence, the great support, their
helpfulness and inspiring example.
To all my friends and colleagues in Dublin City University: Thank you for your support and
friendship.
TABLE OF CONTENTS
DECLARATION ... I DEDICATION ... II ACKNOWLEDGEMENTS ... III TABLE OF CONTENTS ... IV LIST OF FIGURES ... VIII LIST OF TABLES ... XII NOMENCLATURE ... XIV ABSTRACT ... XVIICHAPTER 1. INTRODUCTION ... 1
1.1. RESEARCH OBJECTIVES, DELIMITATION AND GENERALISATIONS ... 2
1.2. THESIS STRUCTURE ... 3
CHAPTER 2. LITERATURE REVIEW ... 5
2.1. PRODUCTION CONTROL STRATEGIES ... 6
2.1.1. KANBAN CONTROL STRATEGY (KB) ... 6
2.1.2. CONWIP CONTROL STRATEGY (CW) ... 7
2.1.3. BASE STOCK CONTROL STRATEGY (BS) ... 9
2.1.4. HYBRID KANBAN CONWIP CONTROL STRATEGY (HKC) ... 10
2.1.5. GENERALISED KANBAN CONTROL STRATEGY (GK) ... 11
2.1.6. EXTENDED KANBAN CONTROL STRATEGY (EKB) ... 12
2.1.7. ADAPTIVE KANBAN CONTROL STRATEGY (AKB) ... 13
2.1.8. ADAPTIVE EXTENDED KANBAN AND ADAPTIVE GENERIC KANBAN CONTROL STRATEGIES (AGRK AND AEK) ... 14
2.1.9. DYNAMIC CONWIP CONTROL STRATEGY ... 17
2.1.11. DYNAMIC CARD CONTROL STRATEGY BASED ON CENTRALISED KANBAN AND CONWIP
CONTROL STRATEGY ... 19
2.1.12. SUMMARY AND POSITIONING OF THIS RESEARCH ... 19
2.2. SIMULATION MODELLING AND OPTIMISATION OF MANUFACTURING SYSTEMS ... 21
2.2.1. MULTI-OBJECTIVE EVOLUTIONARY ALGORITHM ... 21
2.2.2. PERFORMANCE METRICS ... 24
2.2.3. WARMUP PERIOD ... 24
2.2.4. SUMMARY ... 25
2.3. DATA ANALYSIS AND TOOLS FOR DESIGN OF EXPERIMENTS ... 26
2.3.1. ROBUSTNESS TEST ... 26
2.3.2. RESPONSE SURFACE METHODOLOGY ... 28
2.4. MATERIAL RECOVERY AND ENVIRONMENTAL REGULATION ON MANUFACTURERS ... 29
2.4.1. SUMMARY AND POSITIONING OF THIS RESEARCH ... 35
CHAPTER 3. PRELIMINARY PRODUCTION CONTROL STRATEGY EXPERIMENTAL APPROACH .. 36
3.1. DEDICATED AND SHARED CONWIP CONTROL STRATEGIES REVIEW ... 36
3.2. EXPERIMENTAL DESIGN ... 37
3.3. EXPERIMENTAL RESULTS ... 42
3.4. SUMMARY ... 46
CHAPTER 4. RESEARCH METHODOLOGY ... 48
4.1. SYSTEM DESCRIPTION ... 48
4.2. RESEARCH SPACE SPECIFICATIONS ... 64
4.3. MODIFICATION APPROACH ... 65
CHAPTER 5. EXPERIMENTAL RESULTS ... 71
5.1. INTRODUCTION ... 71
5.2. EXPERIMENTAL RESULTS FOR SCENARIOS WITH UPPER PROCESSING TIME VARIABILITY AND 90% RETURNED MATERIALS ... 72
5.3. EXPERIMENTAL RESULTS FOR SCENARIOS WITH LOWER PROCESSING TIME VARIABILITY AND 90% RETURNED MATERIALS ... 74
5.4. EXPERIMENTAL RESULTS FOR SCENARIOS WITH UPPER PROCESSING TIME VARIABILITY AND 40% RETURNED MATERIALS ... 76
5.5. EXPERIMENTAL RESULTS FOR SCENARIOS WITH LOWER PROCESSING TIME VARIABILITY AND 40% RETURNED MATERIALS ... 78
5.6. RELATIONSHIP BETWEEN BACKLOG (BL) AND SERVICE LEVEL (SL) ... 80
CHAPTER 6. DATA ANALYTICS ... 84
6.1. ROBUSTNESS TEST ... 84
6.1.1. WIP AND BL ROBUSTNESS TO INCREASED SYSTEM WORKLOAD – UPPER VARIABILITY AND HIGHER RATE OF RECYCLED SUPPLY ... 85
6.1.2. WIP AND BL ROBUSTNESS TO INCREASED SYSTEM WORKLOAD – LOWER VARIABILITY AND HIGHER RATE OF RECYCLED SUPPLY ... 89
6.1.3. WIP AND BL ROBUSTNESS TO INCREASED SYSTEM WORKLOAD – UPPER VARIABILITY AND LOWER RATE OF RECYCLED SUPPLY ... 92
6.1.4. WIP AND BL ROBUSTNESS TO INCREASED SYSTEM WORKLOAD – LOWER VARIABILITY AND LOWER RATE OF RECYCLED SUPPLY ... 96
6.1.5. SUMMARY ... 99
6.2. RESPONSE SURFACE METHODOLOGY (RSM) ... 99
6.2.1. RESPONSES FOR DNC HEKC-II STRATEGY WITH UPPER PROCESSING TIME VARIABILITY AND 90% RECYCLED SUPPLY ... 100
6.2.2. RESPONSES FOR HKC STRATEGY WITH UPPER PROCESSING TIME VARIABILITY AND 90% RECYCLED SUPPLY ... 102
6.2.3. RESPONSES FOR DNC HEKC-II STRATEGY WITH UPPER PROCESSING TIME VARIABILITY AND 40% RECYCLED SUPPLY ... 104
6.2.4. RESPONSES FOR HKC STRATEGY WITH UPPER PROCESSING TIME VARIABILITY AND 40% RECYCLED SUPPLY ... 107
6.2.5. SUMMARY ... 109
CHAPTER 7. PERFORMANCE ASSESSMENT OF THE PROPOSED INTELLIGENT SELF-DESIGNING PRODUCTION CONTROL STRATEGY ... 111
7.1. DESCRIPTION AND SPECIFICATION OF THE SYSTEM ... 111
7.2. EXPERIMENTAL RESULTS ... 114
7.3. SUMMARY ... 116
CHAPTER 8. CONCLUSIONS AND RECOMMENDATIONS FOR FUTURE RESEARCH ... 119
8.1. SUMMARY OF CONTRIBUTIONS TO THE THEORY ... 119
8.2. RECOMMENDATIONS FOR FUTURE RESEARCH AND DEVELOPMENT ... 121
REFERENCES ... 124
APPENDIX A. ROBUSTNESS TEST RESULTS FOR INCREASED SYSTEM WORKLOAD FROM 85% TO 95% ... A1 APPENDIX B. EVOLUTIONARY OPTIMISATION RESULTS FOR ALL STRATEGIES WITH 90%
RETURNED MATERIALS ... B1 APPENDIX C. EVOLUTIONARY OPTIMISATION RESULTS FOR ALL STRATEGIES WITH 40%
RETURNED MATERIALS ... C1 APPENDIX D. SERVICE LEVEL AND BACKLOG COMPARISON ... D1 APPENDIX E. ANOVA TABLES AND REPORTS ... E1
LIST OF FIGURES
FIGURE 2-1. KANBAN CONTROLLED TWO-STAGES PRODUCTION LINE. [9] ... 7
FIGURE 2-2. CONWIP CONTROLLED TWO-STAGES PRODUCTION LINE. [9] ... 8
FIGURE 2-3. BASE STOCK CONTROLLED TWO-STAGES PRODUCTION LINE. [9] ... 9
FIGURE 2-4. HYBRID KANBAN CONWIP CONTROLLED PRODUCTION LINE [3, 20] ... 11
FIGURE 2-5. GENERALIZED KANBAN CONTROLLED TWO-STAGES PRODUCTION LINE [9] ... 11
FIGURE 2-6. EXTENDED KANBAN CONTROLLED TWO-STAGES PRODUCTION. [9] ... 13
FIGURE 2-7. ADAPTIVE KANBAN CONTROLLED PRODUCTION LINE. [24] ... 14
FIGURE 2-8. ADAPTIVE GENERIC KANBAN CONTROLLED PRODUCTION LINE (AGRK) [27] ... 15
FIGURE 2-9. ADAPTIVE EXTENDED KANBAN CONTROLLED PRODUCTION LINE [27] ... 16
FIGURE 2-10. DYNAMIC CONWIP CONTROLLED DECISION PROCESS [32] ... 17
FIGURE 2-11. DYNAMIC CARD CONTROL STRATEGY BASED ON CENTRALISED KANBAN AND CONWIP DECISION PROCESS [43] ... 19
FIGURE 2-12. FIRST-ORDER STOCHASTIC DOMINANCE [92] ... 27
FIGURE 2-13. SECOND-ORDER STOCHASTIC DOMINANCE: OPTION A SECOND-ORDER STOCHASTICALLY DOMINATES OPTION B [92] ... 28
FIGURE 2-14 SECOND-ORDER STOCHASTIC DOMINANCE: OPTION A DOES NOT SECOND-ORDER STOCHASTICALLY DOMINATES OPTION B [92] ... 28
FIGURE 2-15. INTEGRATED CLOSED-LOOP SUPPLY CHAIN FRAMEWORK [97] ... 30
FIGURE 2-16. TOYOTA RECYCLING/RECOVERY SYSTEM FOR END OF LIFE VEHICLES IN JAPAN [115] 34 FIGURE 3-1. DEDICATED CONWIP DIAGRAM OF THE AUTHORISATION CARDS ALLOCATION POLICY AND THE WORKFLOW OF CLSC ... 39
FIGURE 3-2. SHARED CONWIP DIAGRAM OF THE AUTHORISATION CARDS ALLOCATION POLICY AND THE WORKFLOW OF CLSC ... 40
FIGURE 3-3. CONTROL STRATEGIES PERFORMANCE FOR THE 40% RECOVERY SCENARIOS ... 43
FIGURE 3-4. CONTROL STRATEGIES PERFORMANCE FOR THE 90% RECOVERY SCENARIOS ... 44
FIGURE 3-5. MINIMAL BLOCKING STRATEGY VS HYBRID MINIMAL BLOCKING-CONWIP STRATEGY – PERFORMANCE SPREAD [47]. ... 45
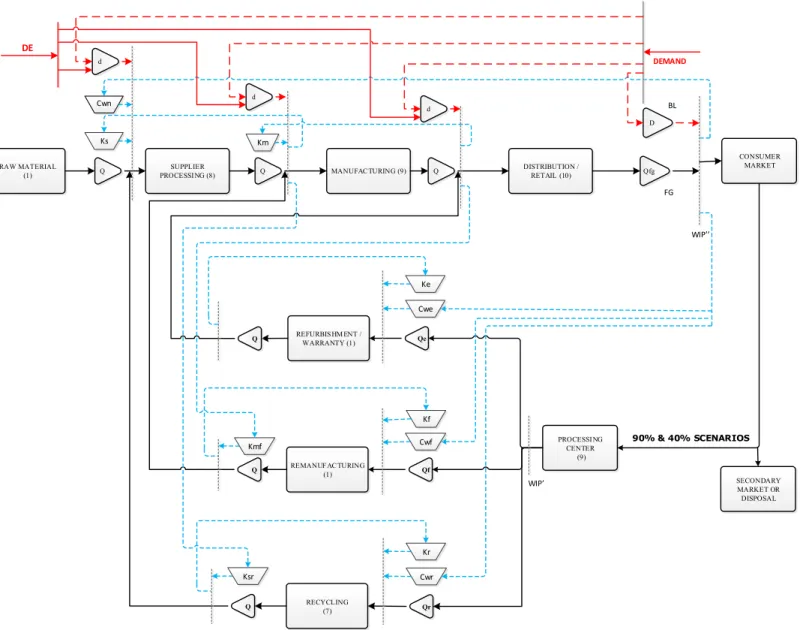
FIGURE 4-1. HEKC-II DIAGRAM OF THE AUTHORISATION CARDS ALLOCATION POLICY AND THE WORKFLOW OF CLSC ... 51 FIGURE 4-2. HKC DIAGRAM OF THE AUTHORISATION CARDS ALLOCATION POLICY AND THE
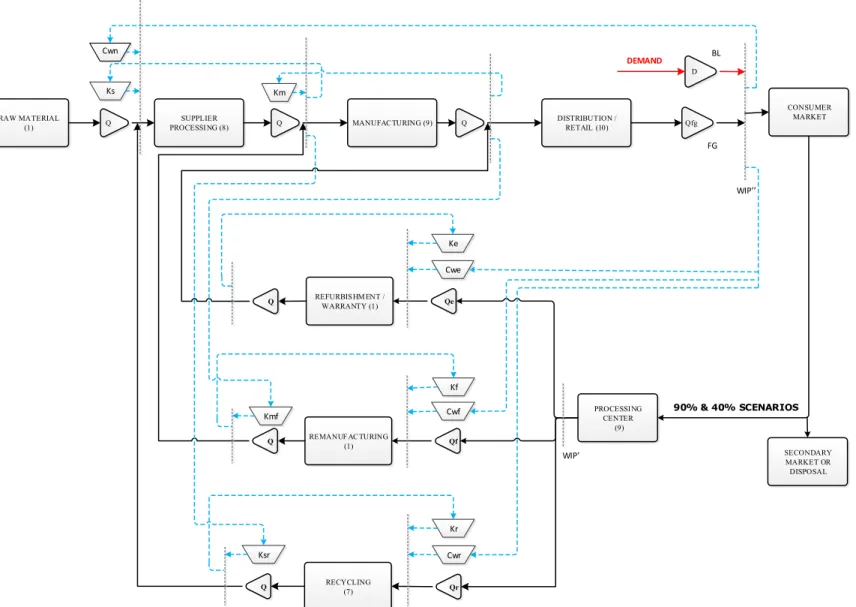
WORKFLOW OF CLSC ... 52 FIGURE 4-3. DNC HEKC-II DIAGRAM OF THE AUTHORISATION CARDS ALLOCATION POLICY AND THE
WORKFLOW OF CLSC ... 56 FIGURE 4-4. DNC HKC DIAGRAM OF THE AUTHORISATION CARDS ALLOCATION POLICY AND THE
WORKFLOW OF CLSC ... 57 FIGURE 4-5. DISTRIBUTED DEMAND LEVEL COMPARISON FOR EACH DEMAND BUFFER ON HEKC-II
WITH DE = 0 AND BASE STOCK = 20 ... 66 FIGURE 4-6. WIP AND BL PLOT DISPLAYING INSTANT VARIATIONS OF THE FINISHED GOOD BUFFER
(BLUE) AND BL (RED) ON HEKC-II WITH DE = 0 AND BASE STOCK = 20 ... 67 FIGURE 4-7. DISTRIBUTED DEMAND LEVEL COMPARISON FOR EACH DEMAND BUFFER ON HEKC-II
WITH DE = 0 AND BASE STOCK = 100 ... 67 FIGURE 4-8. WIP AND BL PLOT DISPLAYING INSTANT VARIATIONS OF THE FINISHED GOODS BUFFER
(BLUE) AND BL (RED) ON HEKC-II WITH DE = 0 AND BASE STOCK = 100 ... 68 FIGURE 4-9. DISTRIBUTED DEMAND LEVEL COMPARISON FOR EACH DEMAND BUFFER ON HEKC-II
WITH PARETO-OPTIMUM SETTING: DE = 1 AND BASE STOCK = 20 ... 68 FIGURE 4-10. WIP AND BL PLOT DISPLAYING INSTANT VARIATIONS OF THE FINISHED GOOD BUFFER
(BLUE) AND BL (RED) ON HEKC-II WITH THE PARETO-OPTIMUM SETTING: DE = 1 AND BASE STOCK = 20 ... 69 FIGURE 4-11. WIP AND BL PLOT DISPLAYING INSTANT VARIATIONS OF THE FINISHED GOOD BUFFER
(BLUE) AND BL (RED) ON DNC HEKC-II. SETTING WITH ADDED MP: DE = 1, BASE STOCK = 20 AND ADDED MP=120 ... 70 FIGURE 5-1. PARETO OPTIMUM PERFORMANCE FRONTIER, HIGH PROCESSING TIME VARIABILITY AND
90% OF RETURNED MATERIALS - LOWER WIP RANGE ... 73 FIGURE 5-2. PARETO OPTIMUM PERFORMANCE FRONTIER, HIGH PROCESSING TIME VARIABILITY AND
90% OF RETURNED MATERIALS - LOWER BL RANGE ... 73 FIGURE 5-3. PARETO OPTIMUM PERFORMANCE FRONTIER, LOWER PROCESSING TIME VARIABILITY
AND 90% OF RETURNED MATERIALS - LOWER WIP RANGE ... 75 FIGURE 5-4. PARETO OPTIMUM PERFORMANCE FRONTIER, LOWER PROCESSING TIME VARIABILITY
AND 90% OF RETURNED MATERIALS - LOWER BL RANGE ... 75 FIGURE 5-5. PARETO OPTIMUM PERFORMANCE FRONTIER, HIGH PROCESSING TIME VARIABILITY AND
40% OF RETURNED MATERIALS - LOWER WIP RANGE ... 77 FIGURE 5-6 PARETO OPTIMUM PERFORMANCE FRONTIER, HIGH PROCESSING TIME VARIABILITY AND
FIGURE 5-7. PARETO OPTIMUM PERFORMANCE FRONTIER, LOWER PROCESSING TIME VARIABILITY AND 40% OF RETURNED MATERIALS - LOWER WIP RANGE ... 79 FIGURE 5-8. PARETO OPTIMUM PERFORMANCE FRONTIER, LOWER PROCESSING TIME VARIABILITY
AND 40% OF RETURNED MATERIALS - LOWER BL RANGE ... 79 FIGURE 5-9. DNC HKC – RELATION BETWEEN BL AND SL - HIGH PROCESSING TIME VARIABILITY AND
90% OF RETURNED MATERIALS ... 81 FIGURE 5-10. DNC HKC – RELATION BETWEEN BL AND SL - HIGH PROCESSING TIME VARIABILITY AND 90% OF RETURNED MATERIALS- WIP RANGE FOR HIGH SERVICE LEVEL RESULTS ... 81 FIGURE 5-11. HKC – RELATION BETWEEN BL AND SL - HIGH PROCESSING TIME VARIABILITY AND 40% OF RETURNED MATERIALS ... 82 FIGURE 5-12. HKC – RELATION BETWEEN BL AND SL - HIGH PROCESSING TIME VARIABILITY AND 40% OF RETURNED MATERIALS – WIP RANGE FOR HIGH SERVICE LEVEL RESULTS ... 82 FIGURE 6-1. BL CUMULATIVE DISTRIBUTION FUNCTION - 90% HV ... 86 FIGURE 6-2. WIP CUMULATIVE DISTRIBUTION FUNCTION - 90% HV ... 87 FIGURE 6-3. BL AND WIP DIRECT TRADE-OFF DATA POINTS FOR THE ROBUSTNESS TEST ANALYSIS -
90% HV ... 88 FIGURE 6-4. BL CUMULATIVE DISTRIBUTION FUNCTION - 90% LV ... 89 FIGURE 6-5. WIP CUMULATIVE DISTRIBUTION FUNCTION - 90% LV ... 90 FIGURE 6-6. BL AND WIP DIRECT TRADE-OFF DATA POINTS FOR THE ROBUSTNESS TEST ANALYSIS -
90% LV ... 91 FIGURE 6-7. BL CUMULATIVE DISTRIBUTION FUNCTION - 40% HV ... 93 FIGURE 6-8. WIP CUMULATIVE DISTRIBUTION FUNCTION - 40% HV ... 94 FIGURE 6-9. BL AND WIP DIRECT TRADE-OFF DATA POINTS FOR THE ROBUSTNESS TEST ANALYSIS -
40% HV ... 95 FIGURE 6-10. BL CUMULATIVE DISTRIBUTION FUNCTION - 40% LV ... 96 FIGURE 6-11. WIP CUMULATIVE DISTRIBUTION FUNCTION - 40% LV ... 97 FIGURE 6-12. BL AND WIP DIRECT TRADE-OFF DATA POINTS FOR THE ROBUSTNESS TEST ANALYSIS -
40% LV ... 98 FIGURE 6-13. RESPONSE SURFACE GRAPH DISPLAYING THE IMPACT OF RELATED FACTORS ON THE
MULTI-OBJECTIVE MINIMISATION OF CLSC INVENTORY FOR THE DNC HEKC-II STRATEGY WITH HV 90% RETURNS ... 101 FIGURE 6-14. RESPONSE SURFACE GRAPH DISPLAYING THE IMPACT OF RELATED FACTORS ON THE
MULTI-OBJECTIVE MINIMISATION OF CLSC INVENTORY FOR THE HKC STRATEGY WITH HV 90% RETURNS ... 103
FIGURE 6-15 RESPONSE SURFACE GRAPH DISPLAYING THE IMPACT OF RELATED FACTORS ON THE MULTI-OBJECTIVE MINIMISATION OF CLSC INVENTORY FOR THE DNC HEKC-II STRATEGY WITH HV 40% RETURNS ... 106 FIGURE 6-16 RESPONSE SURFACE GRAPH DISPLAYING THE IMPACT OF RELATED FACTORS ON THE
MULTI-OBJECTIVE MINIMISATION OF CLSC INVENTORY FOR THE HKC STRATEGY WITH HV 40% RETURNS ... 108 FIGURE 7-1. PARETO OPTIMUM PERFORMANCE FRONTIER, UPPER PROCESSING TIME VARIABILITY AND 90% OF RETURNED MATERIALS - LOWER BL RANGE ... 115 FIGURE 7-2. PARETO OPTIMUM PERFORMANCE FRONTIER, UPPER PROCESSING TIME VARIABILITY AND 90% OF RETURNED MATERIALS - LOWER WIP RANGE ... 115 FIGURE 7-3. PARETO OPTIMUM PERFORMANCE FRONTIER, UPPER PROCESSING TIME VARIABILITY AND 90% OF RETURNED MATERIALS - TOTAL RANGE ... 115 FIGURE 7-4. WIP AND BL PLOT DISPLAYING INSTANT VARIATIONS OF THE FINISHED GOODS BUFFER
(BLUE) AND BL (RED) FOR DNC HEKC-II. PARETO OPTIMUM SETTINGS WITH MP = 12 .. 116 FIGURE 7-5. WIP AND BL PLOT DISPLAYING INSTANT VARIATIONS OF THE FINISHED GOODS BUFFER
(BLUE) AND BL (RED) ON INTELLIGENT SELF-DESIGNING PCS, MODIFICATION OF DNC HEKC-II. CHANGING ONLY MP SETTING TO MP = 48 ... 117 FIGURE 7-6. WIP AND BL PLOT DISPLAYING INSTANT VARIATIONS OF THE FINISHED GOODS BUFFER
(BLUE) AND BL (RED) ON INTELLIGENT SELF-DESIGNING PCS, MODIFICATION OF DNC HEKC-II. CHANGING ONLY MP AND TA PARAMETERS TO MP = 48 AND TA = 12 WITH ACCELERATION/DECELERATION ENABLED. ... 117 FIGURE 7-7. FREQUENCY INTERVAL DISTRIBUTION OF THE FINISHED GOODS BUFFER FOR THE DNC
HEKC-II OPTIMISED AT BL = 1 ... 118 FIGURE 7-8. FREQUENCY INTERVAL DISTRIBUTION OF THE FINISHED GOODS BUFFER FOR THE DNC
LIST OF TABLES
TABLE 3-1. RANGE OF THE AUTHORISATION CARDS ... 42 TABLE 4-1. AUTHORISATION CARDS LEGEND ... 50 TABLE 4-2. RANGE OF AUTHORISATION CARDS SETTING FOR HEKC-II PRODUCTION CONTROL
STRATEGY WITH 90% RETURNED MATERIAL. ... 53 TABLE 4-3. RANGE OF AUTHORISATION CARDS SETTING FOR HKC PRODUCTION CONTROL STRATEGY
WITH 90% RETURNED MATERIAL. ... 53 TABLE 4-4. RANGE OF AUTHORISATION CARDS SETTING FOR HEKC-II PRODUCTION CONTROL
STRATEGY WITH 40% RETURNED MATERIAL. ... 54 TABLE 4-5. RANGE OF AUTHORISATION CARDS SETTING FOR HKC PRODUCTION CONTROL STRATEGY
WITH 40% RETURNED MATERIAL. ... 54 TABLE 4-6. RANGE OF AUTHORISATION CARDS SETTING FOR DNC HEKC-II PRODUCTION CONTROL
STRATEGY WITH 90% RETURNED MATERIAL. ... 58 TABLE 4-7. RANGE OF AUTHORISATION CARDS SETTING FOR DNC HKC PRODUCTION CONTROL
STRATEGY WITH 90% RETURNED MATERIAL. ... 58 TABLE 4-8. CHANGES IN AUTHORISATION CARDS SETTING FOR DNC HEKC-II AND FOR DNC HKC
PRODUCTION CONTROL STRATEGY WITH 90% RETURNED MATERIAL. ... 59 TABLE 4-9. RANGE OF AUTHORISATION CARDS SETTINGS FOR DNC HEKC-II PRODUCTION CONTROL
STRATEGY WITH 40% RETURNED MATERIAL. ... 60 TABLE 4-10. RANGE OF AUTHORISATION CARDS SETTINGS FOR DNC HKC PRODUCTION CONTROL
STRATEGY WITH 40% RETURNED MATERIAL. ... 60 TABLE 4-11. RANGE OF AUTHORISATION CARDS SETTINGS DNC HEKC-II AND FOR DNC HKC
PRODUCTION CONTROL STRATEGY WITH 40% RETURNED MATERIAL. ... 61 TABLE 5-1. SOLUTIONS PER STRATEGY FOR HIGH PROCESSING TIME VARIABILITY AND 90% OF
RETURNED MATERIALS ... 72 TABLE 5-2. SOLUTIONS PER STRATEGY FOR LOWER PROCESSING TIME VARIABILITY AND 90% OF
RETURNED MATERIALS ... 74 TABLE 5-3. SOLUTIONS PER STRATEGY FOR HIGH PROCESSING TIME VARIABILITY AND 40% OF
RETURNED MATERIALS ... 76 TABLE 5-4. SOLUTIONS PER STRATEGY FOR LOWER PROCESSING TIME VARIABILITY AND 40% OF
TABLE 6-1. AUTHORISATION CARDS SETTING OPTIMISED AT BL 0.5 FOR THE ROBUSTNESS TEST - HV 90% ... 85 TABLE 6-2. BL STOCHASTIC DOMINANCE TEST RESULTS FOR STRATEGIES AT 90% HV ... 86 TABLE 6-3. WIP STOCHASTIC DOMINANCE TEST RESULTS FOR STRATEGIES AT 90% HV ... 87 TABLE 6-4. AUTHORISATION CARDS SETTING OPTIMISED AT BL 0.5 FOR THE ROBUSTNESS TEST - LV
90% ... 89 TABLE 6-5. BL STOCHASTIC DOMINANCE TEST RESULTS FOR STRATEGIES AT 90% LV ... 90 TABLE 6-6. WIP STOCHASTIC DOMINANCE TEST RESULTS FOR STRATEGIES AT 90% LV ... 90 TABLE 6-7. AUTHORISATION CARDS SETTING OPTIMISED AT BL 0.5 FOR THE ROBUSTNESS TEST - HV
40% ... 92 TABLE 6-8. BL STOCHASTIC DOMINANCE TEST RESULTS FOR STRATEGIES AT 40% HV ... 93 TABLE 6-9. WIP STOCHASTIC DOMINANCE TEST RESULTS FOR STRATEGIES AT 40% HV ... 94 TABLE 6-10. AUTHORISATION CARDS SETTING OPTIMISED AT BL 0.5 FOR THE ROBUSTNESS TEST - LV 40% ... 96 TABLE 6-11. BL STOCHASTIC DOMINANCE TEST RESULTS FOR STRATEGIES AT 40% LV ... 97 TABLE 6-12. WIP STOCHASTIC DOMINANCE TEST RESULTS FOR STRATEGIES AT 40% LV ... 97 TABLE 6-13. UPPER AND LOWER PARAMETERS LIMIT FOR THE DESIGN OF EXPERIMENTS - DNC
HEKC-II, BL TARGETED WITHIN 0.3 AND 0.5 ... 100 TABLE 6-14. RSM VS GA OPTIMISED RESULTS COMPARISON - DNC HEKC-II ... 102 TABLE 6-15. UPPER AND LOWER PARAMETERS LIMIT FOR THE DESIGN OF EXPERIMENT – HKC, BL
TARGETED TO BE WITHIN 0.3 AND 0.5 ... 103 TABLE 6-16. RSM VS GA OPTIMISED RESULTS COMPARISON – HKC ... 104 TABLE 6-17. UPPER AND LOWER PARAMETERS LIMIT FOR THE DESIGN OF EXPERIMENT – DNC
HEKC-II, BL TARGETED TO BE WITHIN 0.3 AND 0.5 ... 105 TABLE 6-18. RSM VS GA OPTIMISED RESULTS COMPARISON - DNC HEKC-II ... 107 TABLE 6-19. UPPER AND LOWER PARAMETERS LIMIT FOR THE DESIGN OF EXPERIMENT – HKC, BL
TARGETED WITHIN 0.3 AND 0.5 ... 108 TABLE 6-20. RSM VS GA OPTIMISED RESULTS COMPARISON – HKC ... 109 TABLE 7-1. RANGE OF PARAMETERS AND AUTHORISATION CARDS FOR THE INTELLIGENT
SELF-DESIGNING PRODUCTION CONTROL STRATEGY WITH 90% RETURNED MATERIAL. ... 113 TABLE 7-2. FORMULAS FOR THE DYNAMIC CHANGES ON THE NUMBER OF THE AUTHORISATION CARDS
FOR INTELLIGENT SELF-DESIGNING PRODUCTION CONTROL STRATEGY WITH 90%
RETURNED MATERIAL. ... 113 TABLE 7-3. SOLUTIONS FOR UPPER PROCESSING TIME VARIABILITY AND 90% OF RETURNED
NOMENCLATURE
Abbreviation Description
ANOVA Analysis of Variance
BL Backlog of Customer Demand
CDF Cumulative Density Function
CLSC Closed-Loop Supply Chain
CONWIP Constant Work-In-Process control strategy
DOE Design of Experiment
EA Evolutionary Algorithm
ELV End-of-Life Vehicle
EPR Extended Producer Responsibility
LHD Latin Hypercube Design
LHS Latin Hypercube Sampling
NSGA Non-dominated Sorting Genetic Algorithm
PAC Production Authorisation Card
PCS Production Control Strategy
POGA Pareto Optimal Genetic Algorithm
RSM Response Surface Methodology
SA Starvation Avoidance
SD Standard Deviation of Demand
WIP Work-In-Process inventory
DNC HEKC-II
Dynamic Allocation Hybrid Extended Kanban CONWIP
special case
DNC HKC Dynamic Allocation Hybrid Kanban CONWIP
HEKC-II Hybrid Extended Kanban CONWIP special case
AEK Adaptive Extended Kanban Strategy
AGRK Adaptive Generic Kanban Control Strategy
AKB Adaptive Kanban Control Strategy
BS Base Stock Control Strategy
CW CONWIP Control Strategy
EKB Extended Kanban Control Strategy
FKS Flexible Control Strategy
GK Generalised Kanban Control Strategy
HKC Hybrid Kanban CONWIP Control Strategy
KB Kanban Control Strategy
Cwn Number of CONWIP cards at the new material supply
Cwr Number of CONWIP cards at the recycling process
Cwf Number of CONWIP cards at the remanufacturing process
Cwe Number of CONWIP cards at the refurbishment process
Ks Number of Kanban cards at the new material supply
Kr Number of Kanban cards at the recycling process
Ke Number of Kanban cards at the remanufacturing process
Kf Number of Kanban cards at the refurbishment process
Km Number of Kanban cards at the manufacturing process
Ksr Number of Kanban cards at the recycled supply
MP
Number of dynamically allocated cards, according to
formula
DE
Parameter for the distributed demand starvation
avoidance and production speed decrease during low
customer demand
ABSTRACT
The objective of this thesis is to establish a Closed-Loop Supply Chain (CLSC) design that is
analysed through a series of simulation models, aimed at defining the highest performing
production control strategy, whilst considering multiple related variables on both the forward and
reverse flow of materials in manufacturing environments. Due to its stochastic nature, the reverse
logistics side of the CLSC represents an increased source of variance for the inventory
management and control strategies as it implies the erratic supply of returned materials, in
addition to the very random customer demand, hence with highly variable inputs on both sides
of the productive system, intrinsically inherent to this line of research.
To test the operational performance of several pull-type production control strategies, a
simulation-based research method was designed. The strategies experimented were: Hybrid
Extended Kanban CONWIP special case (HEKC-II), Hybrid Kanban CONWIP (HKC),
Dynamic Allocation Hybrid Extended Kanban CONWIP special case (DNC HEKC-II) and
Dynamic Allocation Hybrid Kanban CONWIP (DNC HKC). All were tested in scenarios with
high and low processing time variability and with 90% returned products and 40% returns from
an open market system, therefore totaling 16 simulation models. Multi-objective evolutionary
algorithms were utilised to generate the Pareto-optimum performance frontier with the objective
of simultaneously minimising both performance metrics: The overall average work in progress
(WIP) and the average backlog queue length (BL) for the entire CLSC. Processes used in the
recovery and recycling of end of life manufactured goods were examined. This research method
structures leading factors towards improved economic viability and sustainability of technologies
required for the effective implementation of inventory control strategies on highly complex
closed-loop supply chains with the focus on the performance metrics and optimum utilisation of
resources available for the industry.
The dynamic allocation strategies proved significant performance improvement, shifting the
entire Pareto frontier forward with major advances on both metrics. Furthermore, it happened on
all scenarios tested. The modified HEKC-II, with an optimisable parameter that enables it to be
overwritten in a way that it can match the well-established HKC, also performed as originally
intended and had better results than HKC in some cases, especially with the higher variability
level. It also provided grounds for the suggested improvements and flexibilisation of the HEKC
strategy.
A major contribution of this thesis was the successful implementation of another advanced
control methodology, entitled here the Intelligent Self-Designing Production Control Strategy,
which provided maximum control performance. It consisted essentially of DNC HEKC-II with
the following modifications: I) Extensive increase of dynamically allocated authorisation cards;
II) Further anticipation of the time to trigger the change in the number of cards according to the
finished goods buffer level, plus an acceleration/deceleration factor of this change; III) The
capability of downsizing itself to become similar to HKC in an optimisation process if diverse
production system conditions and variability would require. It displayed a very significant shift
of the performance frontier.
CHAPTER 1.
INTRODUCTION
The development of advanced hybrid production control strategies in addition to improved
engineering design can lead to significantly greater production performance levels, that enable
the efficient and highly pursued technical and economic feasibility of Closed-Loop Supply Chain
(CLSC) operations allowing it to be the optimum industry standard.
Reverse supply chain refers to the logistics of finished products from the consumer market back
to a merchant. This is the opposite process of the traditional supply chain forward direction of
goods from manufacturers to the customer. The reverse supply chain theory entails that the
product life-cycle does not end with the delivery to customers, nonetheless continues with a new
use at the end-of-use or end-of-life, which may be reprocessed by manufacturers for reuse,
recycle, repair or disposal. Some of the examples of the reverse supply chain include product
returns and management of their electric and electronic waste deposition; remanufacturing and
refurbishing activities; management of warrant returns and production surplus, as well as
returned machineries from leasing contracts. Other examples of product reversing direction in
the supply chain are product recalls, manufacturing returns, commercial returns, end-of-use
returns, and end-of-life returns. Two of the factors that affect the justification of setting up
aftermarket reproduction runs are the flow rate and the composition of reusable returned
materials [1, 2]. These factors are stochastic functions of production rate and reliability of
individual subassemblies.
CLSC presents technical challenges; although it has already achieved improved viability when
the production system and the products themselves are engineered with lifecycle conscious
projects. The industrial shredding systems are among the most suitable treatment for end-of-life
goods. It has been implemented on a large scale by major global automakers such as Toyota and
Volkswagen. This standardised process can meet demanding regulations with recovery rates of
up to 95% of the materials processed.
1.1.
RESEARCH OBJECTIVES, DELIMITATION
AND GENERALISATIONS
Four production control strategies are tested: HKC - Hybrid Kanban CONWIP (Constant
Work-In-Process), which is the control group for its high performance in similar scenarios according to
Bonvik et al. [3], Hybrid Extended Kanban CONWIP special case (HEKC-II) modified from
Dallery and Liberopoulos [4], Dynamic Allocation Hybrid Extended Kanban CONWIP special
case (DNC HEKC-II) and Dynamic Allocation Hybrid Kanban CONWIP (DNC HKC), in
scenarios with high and low processing time variability and with different rates of returned
products.
A novel mechanism was created to test if the distributed demand information in a modified
HEKC strategy can benefit or not the production control efficiency, Furthermore, it is analysed
the experimental results to define if the innovative logic of the dynamically allocated
authorisation cards with the quantification of the optimum increase can lead to production control
performance improvement.
This research program targets the development of production control strategies for manufacturers
that are considering incorporating re-conditioned or recycled products into their raw material
inputs. It is operationalised through the modeling and analysis of probabilistic systems to
establish a standardised methodology that can define the economic impact of production control
strategies for reverse supply chain management and related industrial engineering optimisation
projects on the financial performance and influence on the future value of companies over the
long-term.
Multiple inherent factors that lead to higher performance in the industrial and service sectors are
analysed, simulated and quantified, such as reduced energy consumption throughout the entire
product lifecycle, optimisation of the product engineering, decreased demand for raw material
and reduced energy demand for production, hence lower emissions, and associated
environmental externalities. The long-term economic advantage of the implementation of reverse
logistics not only makes a corporation more competitive in a global marketplace but also
enhances the positioning on the carbon trade scenario. This is a clear indicator of the
macroeconomic incentive for more intelligent manufacturing principles and methods and for
cleaner technologies moving towards better efficiencies, improved social responsibility and
better cooperation among various stakeholders.
Thus, this project models and analyses multiple factors intrinsic to the supply chain and
inter-correlated-in-production processes, such as but not limited to lean manufacturing practices,
logistics, study of simulated models, clean and renewable energy implementation, efficiency
monitoring, reliability and process re-engineering advancements. Today’s overly leveraged
companies would not usually rely merely on the rate of return on investment, or on their payback
period for their decisioning on technology projects, so this research also analyses a broader
spectrum of engineering economics. The acquisition, analysis, and preparation of data for both
the model input and visualisation of the model output prove to be very significant obstacles that
impacted on the time and expertise required to ensure that simulation-based decision support can
provide meaningful, effective and timely results. Accordingly, this research project also
investigates and develops tools and methodologies to automate this modeling functionality.
The production control strategy optimisations are performed by an evolutionary algorithm with
exhaustively long simulations, throughout trillions of scenarios, hence effective search algorithm
and high specification computing resources are required to run the multi-objective optimisation
process on multiple cloud servers, as it can be extremely time-consuming. The thesis itself is
based on these experimental results.
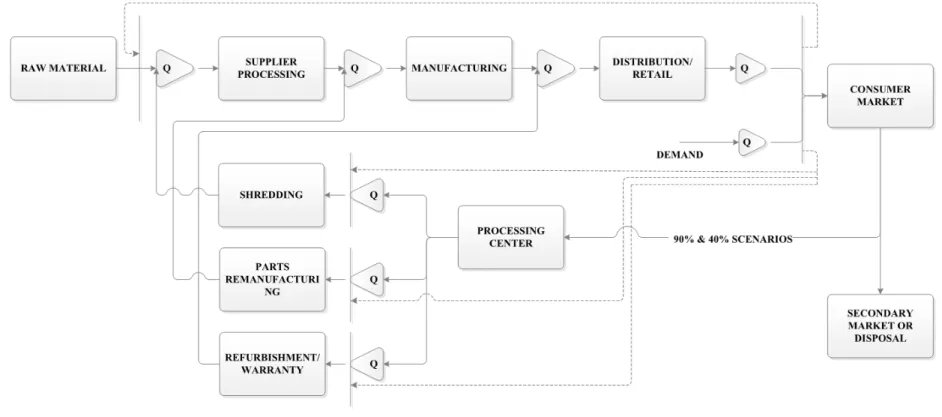
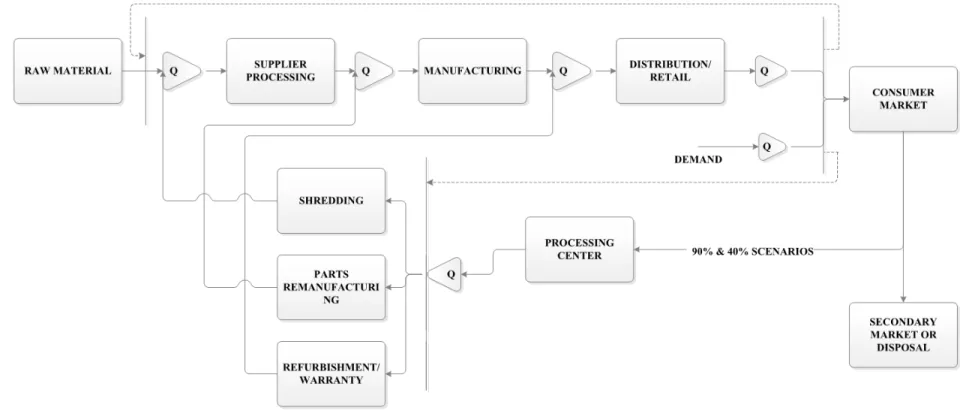
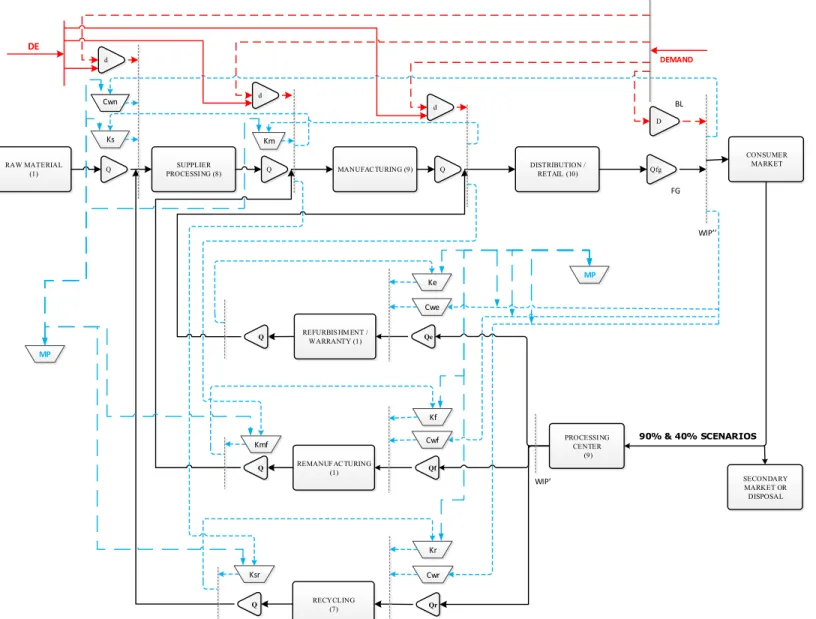
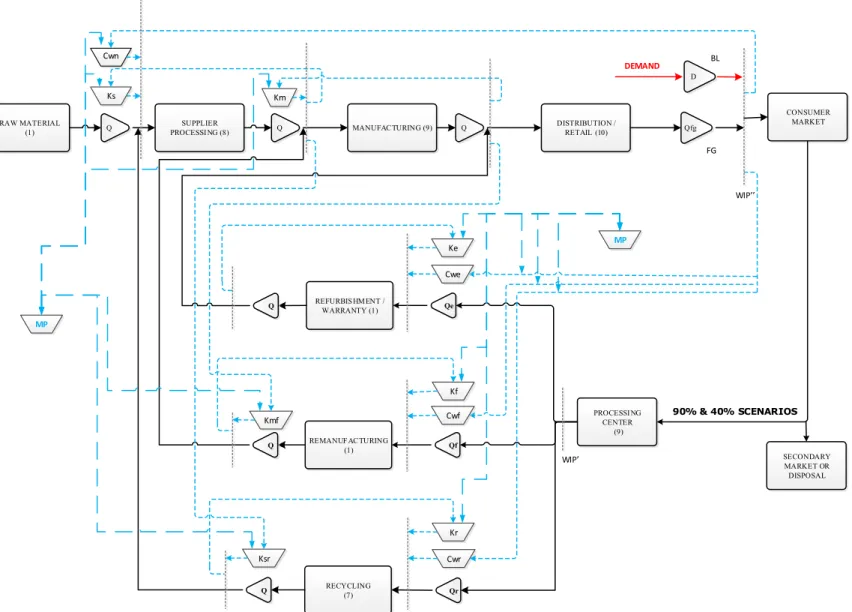
It is specified in detail within the research methodology chapter all assumptions and limitations
of the production processes under investigation. It is a three-stage production line with three
processes on the reverse side, returning materials into suppliers, manufacturing and distribution
channels. Therefore, generalisations of the findings and contributions of this research work can
be extended to all production lines where there is an unbalanced and not unlimited supply of
materials, the stochastic customer orders demand and the variable production processing times,
consequently similar to the production systems definitions considered in this CLSC study.
1.2.
THESIS STRUCTURE
This thesis is structured into eight chapters. Given the introductory research scope, Chapter 2
presents a comprehensive state-of-the-art literature review on production control strategies and
its applicability to CLSC. Chapter 3 describes preliminary research outcomes with a shared and
dedicated CONWIP comparison. Chapter 4 details the research methodologies and Chapter 5
presents the experimental results of each strategy. Chapter 6 displays the analysis of the data and
the robustness tests. Finally, Chapter 7 presents the high performance proposed Intelligent
Self-Designing production control strategy while Chapter 8 describes the conclusions, suggestions for
future research and further developments.
CHAPTER 2.
LITERATURE REVIEW
One of the leading management objectives in manufacturing systems and supply chain is to
perfectly balance the trade-off between minimising the overall inventory while keeping a low
backlog of customer orders and high service levels. The decision of an optimum control
mechanism is of utmost importance for maximum performance. Difficulties in the control
mechanism are usually derived from demand and process variabilities, unconformities and the
extensive complexity of many productive systems. In order to be implementable, some level of
system simplifications and industrial case studies need to be executed. The Japanese Just in Time
approach (JIT) led the investigation and the development of effective pull-type control strategies
that focus on facilitating a quick response to demand rather than concentrating on timely decision
actions on the supply side of the productive chain [5-7].
Pull system mechanisms authorise parts/items into a processing system in response to the arrival
of actual demand by communicating via authorisation cards, while the push-type control
strategies work with the scheduled release of raw material into production. Several performance
analyses of push-type control over pull-type strategies have been investigated [5, 8], considering
advantages and disadvantages of each strategy in decreasing demand backlogs and the overall
inventory. The performance improvement of combining the best traits of multiple strategies can
intuitively lead to the yielding of superior results for implementing hybrid control strategies.
A majority of research publications have focused on individual control strategies, although there
are a few comprehensive comparison papers with a framework of pull-type strategies[9].
Recently, the advancement of communication and logistics technologies has enabled a greater
proliferation of new products, usually with a shorter life. It led to regulatory implications for
manufacturers to reuse and recycle materials, implying an improved design of control strategies
for closed-loop supply chains. This also causes a very significant increase in the variability, not
only of the demand side of the equation but also on the supply side with the material handling on
the reverse logistics being transferred back to the production processes. Hence, control
parameters should be easily adjustable in response to continuous changes in levels of supply and
demand of a given system. Nevertheless, only a few publications concentrate on the dynamic
allocation of authorisation cards and the continuous adjustment of control strategies’ parameters
[9, 10].
In this thesis, a new class of hybrid systems with dynamic changes of the number of authorisation
cards is developed and experimented with the objective of improving the control mechanism at
decreasing inventory while improving customer service level and minimising orders backlog.
2.1.
PRODUCTION CONTROL STRATEGIES
2.1.1.
Kanban Control Strategy (KB)
There are several strategies that apply pull mechanisms and one of the pioneers was the Kanban
Control Strategy, originally used in Toyota production plants in the mid-seventies. It is frequently
considered a good representation of the Just-In-Time philosophy [9, 11]. Kanbans are production
authorisation cards that are used to limit or control the number of parts in a workstation and its
respective buffer. The number of Kanbans sets the limit of parts within a given stage. When
compared to another type of pull implementation strategy, the CONWIP i.e., it is noticeable that
Kanban has a drawback, while the demand information is communicated upstream the production
line, the time adjustment is not reasonably fast because the information must go stage by stage
toward the supply side [8]. Nevertheless, the kanban allows for a perfect synchronisation between
two directly related workstations. The kanban card itself does not have to be physical, it can be
electronic as well [12, 13].
Figure 2-1. Kanban controlled two-stages production line. [9]
Kanban production control systems are the most well-known pull-type strategy for multi-stage
lines. They set a maximum limit of inventory for each workstation including the output buffer.
This maximum number of parts is equal to the pre-set number of kanbans [9, 14]. Figure 2-1
displays the queuing model for a single product Kanban Control Strategy with two workstations.
MP’s represent the manufacturing process and B’s are output buffers, so forming a workstation.
K’s queue are kanban pools. The p+k represents a part in process with a kanban card attached to
it.
The authorisation cards follow as indicated by dotted lines, while materials are released from
buffers to the next workstations. When customer demand D arrives, it can be matched with
finished goods in the final buffer if any are available, or be stored as a backlogged order until a
product becomes available. When the demand is satisfied the kanban card is released upstream
allowing the demand signal to flow, thereby enabling the authorisation card to control the
inventory. The customer demand is communicated upstream workstation by workstation via the
kanban card. The kanban control policy is controlled by a single parameter - the number of
kanbans, which influence the transfer of material downstream and the demand information
upstream through the production line. KB is in many cases suitable for production systems with
low variability, low setup times and high reliability [15, 16].
2.1.2.
CONWIP Control Strategy (CW)
Constant Work-In-Progress (CONWIP) proposed by Spearman et al. [9, 17] is designed with just
a single card that limits the total amount of WIP within the production line. It was developed to
maintain pull-type control advantages and to perform well in a number of manufacturing
scenarios, in which KB (Kanban control strategy) was not entirely suitable. Implementation is
straightforward, but in practice it can be defined as a pull control at the end of a production
system and a push control at the beginning towards the end, therefore inheriting some of the
issues present in push-type systems.
CONWIP controlled lines have a set upper limit of WIP for the entire system. New jobs are
released into production by CONWIP cards (C), if available. When the production is matched
with demand, the authorisation card is released allowing more parts to move forward in response
to the demand. It is similar to a single kanban cell controlling all workstations together. Figure
2-2 displays the queuing model for a single product CONWIP control strategy with two
workstations in tandem, although the intermediate workstation does not play any control function
on the strategy.
Figure 2-2. CONWIP controlled two-stages production line. [9]
B represents buffers, D signifies demand, MP the manufacturing stages and C is for the CONWIP
cards. When demand arrives, it is met with a finished good part at the final buffer if available; if
not, the demand is backlogged and is queued for the next production. If the demand is satisfied,
the CONWIP card is released to the CONWIP pool to authorise the supply to workstation 1.
CONWIP has a rather simple implementation as it depends on just one control parameter for the
entire system. The maximum production rate depends on the number of CONWIP cards. When
a finished part is sent to the customer, a card is detached from the product and released to the
first stage to authorise another part into the system [7, 9, 18].
2.1.3.
Base Stock Control Strategy (BS)
Figure 2-3. Base Stock controlled two-stages production line. [9]
Base Stock is a pull control strategy that adopts the concept of safety buffers between
workstations for finished goods. Each stage has an initial predefined level of inventory; when a
product demand arrives it is transmitted immediately to every workstation and it authorises the
production of a new part [7, 19]. It improves the demand communication process which moves
fast and seamlessly through the entire production line, however, it does not provide a limit to
inventory. BS is a pull-type control mechanism that intends to keep a minimum level of inventory
at each buffer. As it is self-explanatory by its name, demand information is immediately
transferred to all stages simultaneously. Figure 2-3 displays the queuing model for a single
product Base Stock control discipline in a two-workstation process. There is no control over two
consecutive stages and parts will be transferred downstream as a result of demand and processing
time. Base Stock control depends on only one parameter per stage, the base stock number (s1,
s2), as it influences the release of parts downstream but does not have any effect on the upstream
communication of demand information. BS has the advantage of immediately responding to
demand, but it is often criticised for not providing the system with a tighter control of inventory
between stages, hence allowing for excessive WIP [7, 9, 14].
2.1.4.
Hybrid Kanban CONWIP Control Strategy
(HKC)
Hybrid Kanban CONWIP, proposed by Bonvik et al. [3], describes how the CONWIP cards
control the overall inventory and kanban cards control the local workstation level number of
work-in-process. CONWIP cards also perform the demand communication function.
The Hybrid Kanban CONWIP Control Strategy (HKC) communicates the demand information
directly from the finished goods buffer to the first stage of production via CONWIP cards. There
is also the local workstation level inventory control via the number of kanban cards, as described
in the queuing model of a single-product line with three stages controlled by the Hybrid Kanban
CONWIP strategy as shown in Figure 2-4, some of the symbols and nomenclature provided in
the figure differs from the previously mentioned strategies the original source as published
[3,
20]
. DA’s are kanban pools and PA’s are parts in process attached with a kanban card. When
customer demand arrives and there are available finished goods in the final buffer, it is matched
and shipped to the customer. The attached CONWIP card is released upstream to authorise
production; otherwise, if there are no parts in the finished goods buffer, demand is backlogged
and placed in a queue for the next available part. At the first workstation, it is required that both
kanban and CONWIP cards are available, then production can be authorised and raw materials
are released into processing. Therefore, the Hybrid Kanban CONWIP relies on one parameter
per stage, the number of kanbans, and one additional parameter for the entire system, which is
the number of CONWIP cards [9, 21, 22].
Figure 2-4. Hybrid Kanban CONWIP controlled production line [3, 20]
2.1.5.
Generalised Kanban Control Strategy (GK)
Generalised Kanban Control Strategy, proposed by Buzacott [14], is a hybrid mechanism which
combines base stock and kanban strategies. It is more complex but more sensitive to variabilities
inherent to the system and the demand information flow is relayed upstream rather than directly
transferred to the production process. The inventory is controlled by two parameters, the amount
of base stocks and the number of kanbans [23].
Figure 2-5. Generalized Kanban controlled two-stages production line [9]
The generalised kanban control system is a modification of the standard Kanban control policy.
The demand information now is stored in two queues.
D’s
only contain demands and DK’s
contain kanbans that had been trigged by demand information, as displayed on Figure 2-5, the
queuing model for Generalised Kanban. Differently, from the Kanban Strategy, Generalised
Kanban Control Strategy (GK) is ruled by two parameters per workstation, which are the number
of kanbans and the number of base stock levels (s1 and s2) for each workstation. Customer
demand information in GK works as follows: when it arrives, it is split into two demands, the
first will go to the D queue and will request the delivery of a finished good as usual. The second
one will go to the D2 queue for the authorisation of production at Workstation 2, then it travels
upstream when parts become available (in B1) so the production flow is authorised to go into the
next manufacturing process MP. The demand moves upstream through the production process
independent of the release of materials downstream, in Kanban systems the demand always
moves attached to authorisations cards. So, this implies more decoupling in the return of demands
and kanbans. Another difference of GK is that the kanban is detached as soon as the product
leaves the manufacturing process, instead of being released after the buffer, so it happens earlier
than in kanban strategy [7, 9, 19, 23].
2.1.6.
Extended Kanban Control Strategy (EKB)
Extended Kanban proposed by Dallery and Liberopoulos [4], is also a combination of the Kanban
and Base Stock strategies. It is less complex regarding its implementation as the demand is
directly communicated to upstream workstations and the functions of both, the Kanban and Base
Stock Control Strategies, are entirely independent. However, one flexible limitation is that the
number of kanbans must be at least as large as the base stock level. [7, 14]
Figure 2-6. Extended Kanban controlled two-stages production. [9]
Extended Kanban Control Strategy (EKB) is a modification of Kanban Control Strategy, but it
is also somewhat similar to the previously mentioned Generalised Kanban Control Strategy. The
difference is that the demand information is communicated to all stages in order to authorise
production, instead of being relayed through individual stages. As in Generalised Kanban Control,
the Extended Kanban Control Strategy is ruled by two parameters per stage, the number of
kanbans and the base stock level. The main differences between Extended Kanban Control
Strategy and Generalised Kanban Control Strategy are: In Extended Kanban Control Strategy,
parts always move with kanbans, while in Generalised Kanban Control Strategy, finished parts
are already detached from them. In Extended Kanban Control, kanbans do not participate in the
demand information flow upstream. In EKB, the number of kanbans must be higher than the
number of base stock, while with Generalised Kanban Control Strategy, there are no such
constraints. The differences between EKB and the Kanban Control Strategy are: In EKB the
demand is immediately broadcasted to all workstations and kanbans move upstream
independently from the demand information, thus the only function of the kanbans here is to
authorise the downstream flow of finished parts. In EKB, there are two parameters per stage
while in Kanban Control Strategy, there is only one. [7, 9, 14, 19]
2.1.7.
Adaptive Kanban Control Strategy (AKB)
This adaptive pull system [24] dynamically readjusts the number of available Kanban cards in
operation depending on the number of current work in progress, customer demands and backlog
levels. Similar to the Kanban system it still remains rather easy to be implemented with few
control parameters.
Figure 2-7. Adaptive Kanban controlled production line. [24]
Where queue P holds finished parts, MP represents the manufacturing process, and queue D is
the back ordered demand. This single-stage adaptive mechanism example uses K (kanban cards)
and E (extra cards) that are contained in queue A. On the given formula, N(t) is the total number
of parts in queue P minus the total number of backorders in queue D at time t; X(t) is the number
of extra cards not in use at time t; R is the release threshold for adding an extra card and C is the
capture threshold for retrieving an extra card from the system. It was shown that in processes
with random exponential processing times and demand arrival according to the Poisson process,
this strategy can outperform the traditional kanban mechanism [24-26] due to the fact that the
changeable level of inventory limit allows for lower WIP average, as it only allows an increase
in number of kanbans during pick times.
2.1.8.
Adaptive Extended Kanban and Adaptive
Generic Kanban Control Strategies (AGRK and
AEK)
Recently proposed strategy [27] the Adaptive Generic Kanban system logic is grounded on the
decision of releasing free authorisation cards and retrieving them based on a service level
management standard. The card release and capture are triggered by demand arrivals. Decisions
on releasing and capturing cards are guided by the estimated service level, Se, and a targeted
service level, St. The service level is defined by the number of demands satisfied on-time divided
by the overall demands that arrived at the system.
Figure 2-8. Adaptive Generic Kanban controlled production line (AGRK) [27]
At the demand arrival, the current service level estimate, Se, is compared to the service level
target, St, where St is a constant parameter and if Se < St and a > 0, where, a, is the current
number of free cards, then one card is released to DA. Otherwise, if Se > St and the current
number of free cards, a, is less than the initial number K in queue A, then one card is captured
back to the correspondent A queue. Cards might not be available in queue DA when a trigger
action is authorised because all cards might be in use. If so, then a card is sent back to A, as soon
as it enters queue DA. The Adaptive Generic Kanban Strategy is a development of the approach
provided by Faminan et al. [28] in two ways: An exponential moving average is used for the
service level estimate in order to respond quickly to demand changes. Since this system is based
on the Generic Kanban by Chang [29], which provides a timely co-ordination between the
production workstations and when compared to CONWIP, it is possible to keep WIP low and
reduce the bottleneck effects. [27-29]
Figure 2-9. Adaptive Extended Kanban controlled production line [27]
The release of authorisation cards in Adaptive Extended Kanban Strategy happens in two phases.
Demands are satisfied immediately if there is a part in the finished goods buffer, P, otherwise it
is back ordered into queue D. K free cards are in queue A1 and X free cards are in queue E. The
demand arrival process is immediately transmitted to queue D1. If there is a card in
queue A1, then one card is sent to queue DA1 to authorise the production of a stage-1 part. As
long as the number of backorders in D is less than the initial number of extra cards K in queue A1,
then a free card is released from queue A1 at the occurrence of a demand arrival and under the
condition that the finished goods buffer P is empty while there are free cards in queue A1. Cards
that were released from queue A1 are captured back when the last stage produces a part and there
is at least one back ordered demand in queue D and there is no demand in queue D1. In the second
phase of this dynamic allocation, free cards are released from queue E by the demand arrival. If
at that time the current number of backorders in queue D is greater than K, the current number
of parts i in input queue I is less than K, and the number of free cards e in queue E is greater than
0, then one card is sent from queue E to queue A1. As the demand was instantaneously sent to
queue D1, one production authorisation is sent to queue DA1. The departure of finished goods
from buffer P triggers the capture of a card that was previously released from queue E. If the
number of backorders d is less than or equal to K + X, there are no demands in queue D1, and
the number of cards e in queue E is less than X, then the detached card from finished goods
moved to queue A1, is sent back to queue E, ensuring that extra cards can be available and out
of circulation. AEK is more advisable for production systems where the customer demand arrives
in cyclical intervals and environments with seasonal demand with a relatively high average
between arrivals [27, 29-31].
2.1.9.
Dynamic CONWIP Control Strategy
The Dynamic CONWIP Control Strategy is based on monitoring a target metric. For
make-to-order environments, when a job exits the system, the throughput is computed. For make-to-stock
environments, every time a demand arrives, the service level is recorded. This strategy uses
several extra cards that will be dynamically allocated to the system. The adding or subtracting
cards of the system is based on the number of currently available extra cards and the system’s
throughput. If making to stock is the case, then the arrival of a demand will release or capture
extra cards depending on the number of currently available extra cards and the customer service
level [27, 32, 33], the logic is demonstrated in the Figure 2-10.
Figure 2-10. Dynamic CONWIP controlled decision process [32]
The variables are described as follows:
x(t), number of not used extra cards at time t,
E, number of initial extra cards,
K(t), number of cards operating in the system at time t,
θ(t), throughput (service level) of the system at time t,
λ, target throughput rate (service level). [32]
2.1.10.
Flexible Control Strategy (FKS)
Flexible Kanban Control Strategies are described in the literature as being comparable to KB
with the addition of a dynamic review of the number of authorisation cards in response to the
production state of supply and demand. Experimental results have shown improvements in
inventory level management and a decreased backlog of consumer orders [10, 34, 35]. However,
another research paper states that the adjustment of the number of authorisation cards is not
sufficient to effectively respond to the system’s variabilities and that the monitoring of inventory
level as an indicator of when to increase or decrease the number of cards available, might not be
a precise measure to define when a production system is undergoing some instabilities [36].
Furthermore, it points to operational and strategic changes to the productive system as a measure
to offset those instabilities. Nevertheless, the constant evaluation and optimisation of a dynamic
control strategy not only presents a significant level of complexity for production engineering,
but it is also expensive and time-consuming for some fast-paced lean environments. Thus, it can
be more ideal for some system engineers to prudently select the best performing features of
individual strategies into an implementable hybrid strategy, rather than optimising parameters
with extensive variabilities inherent to productive system operations [10, 34, 35, 37]. Flexible
approaches can combine many different traits of several strategies to form a new information
structure and authorisation cards communication philosophies [9, 21, 22, 38].
It was proposed that a generic model of several pull-type strategies be optimised by an
evolutionary algorithm assuming that the best traits of each of the single strategy would be
inherited by the optimised solution, creating maximum output with minimum inventory held [9,
39]. The results show that a simplified hybrid system for a single product manufacturing line had
the best performance, mainly due to the application of the CONWIP integral control and Kanban
local control methods to further improve localised variabilities in long lines. Another study
discovered that flexible kanban systems had superior performance levels when compared to
traditional JIT strategies. In four cases under analysis, although they had slightly higher WIP
when processing time was low [40-42], extra kanbans were added when required for starvation
avoidance and withdrawn afterwards in order to respond accordingly only to peaks in
performance and inventory.
2.1.11.
Dynamic Card Control Strategy Based on
Centralised Kanban and CONWIP Control
Strategy
This dynamic control is time-driven, it allows for more than one extra cards to be released or
captured in a decision-making approach. It allows the number of cards in use, for a given time
period, to be decreased in relation to the initial number of cards. It is described according to the
diagram in Figure 2-11. This method relies on two moving averages that deals with statistics of
the time series of demand arrivals, it is applied to a CONWIP system and Kanban systems, where
the changes in the number of cards in each stage happens in a centralized and decentralized
fashion, respectively. The policies can be computationally demanding because of the number of
parameters to be optimised. [43-46]
Figure 2-11. Dynamic Card Control Strategy based on Centralised Kanban and CONWIP
decision process [43]
2.1.12.
Summary and Positioning of this Research
The previous sections, 2.1 to 2.11, provided the fundamental understanding of the current state
of the art of the research on pull-type production control strategies. The literature reveals that
Hybrid Kanban CONWIP, proposed by Bonvik et al. [3], provides notoriously superior
performance in minimising the number work in process while reducing the backlog of customer
demands. It occurs even with the presence of unbalanced demand rate and it is due to the
simultaneous limitation of the local and global inventory level in the production system, hence
providing optimum control performance. Such findings have been confirmed and validated in
several comparative studies such as Wang et al. [47] where Hybrid strategies enabled higher
performance in relation to single strategy mechanisms.
The Extended Kanban strategy designed by Dallery and Liberopoulos [4] can also be considered
a hybrid of the Kanban and Base Stock strategies [19], it enables better demand communication
to workstations upstream the production line. Boonlertvanich [9] implemented a Hybrid
Extended Kanban CONWIP mechanism to forward production process and found performance
gains in relation to single control mechanisms, however it was applied to a rather limited research
space.
Adaptive production control strategies [27, 30-32] provide the advantage of having the amount
inventory limit, which is operationalised by the number of authorisation cards, changed
according to signals of instabilities in the production system. Having such flexibility tends to
allow for better control when the change is performed at an accurate amount and at the right time
considering the particularities of a given production line. [27, 32]
This research postulates and implements a novel Hybrid Extended Kanban CONWIP strategy
with the dynamic allocation of authorization cards and a modification to the Extended Kanban
without the use of a base stock parameter [19]. This modification is applied in order to
simultaneously cope with very stochastic supply and demand, a characteristic inherent to the
Closed-loop supply chain. The proposed improvements to the established theory on production
control strategies are experimented through multi-objective optimisation and in comparison with
the optimum Hybrid Kanban CONWIP, as designed by Bonvik et al. [3], which is the control
group for all scenarios under analysis.
2.2.
SIMULATION
MODELLING
AND
OPTIMISATION
OF
MANUFACTURING
SYSTEMS
Discrete event simulation approaches have been broadly recommended as an efficient way of
evaluating complex supply chain networks and extensive variable factors influencing
manufacturing production. This is due to its analytical ability to deal with large amounts of data
and multiple possible scenarios for improvement without the need for large investments and the
allocation of expensive materials for the execution of tests [48].
2.2.1.
Multi-objective Evolutionary Algorithm
The production control strategy optimisation is performed through a design of rules presiding
over the authorisation of production and the accurate management of parameters. These
parameters are controlled with the objective of minimising costs, inventories and time
consumption, while also improving performance metrics [49]. However, the number of
combinations of multiple parameters in extensive production lines or compound systems can
make the research space for the performance analysis significantly large. Hence, high-efficiency
heuristics are a must when providing support for good decision making for optimum control
strategies [34, 49-51].
Multi-objective optimisation problems with conflicting objectives infer that there is not one
single optimum solution to a problem, so the decision-making process is achieved through the
assessment of trade-offs among objectives, in order to arrive at optimum solutions at different
levels of each parameter under analysis. The set of optimum solutions is known as the
Pareto-Frontier. These sets of solutions are non-dominated or non-inferior, meaning that within the
research space, no better solutions exist when the given set of objectives are taken into
consideration [52-54].
Due to the practicality of such a multi-objective simulation-based optimisation approach, the
simulation software, for example, Extendsim, has an in-built block that uses genetic algorithm,
where parameters and objective functions can be specified to generate a Pareto optimum frontier
to record the production system’s performance. Genetic algorithms had their logic designed by
replicating the mechanisms that have worked in the evolution through generations [55, 56]. They
are operational through the crossover, mutation of populations and reproduction.
Populations are represented by the solution space of a simulated system under investigation. The
reproduction operator selects the initial population of solutions and ranks them according to the
best fitness. The best outcomes are combined to generate offsprings, which will go through some
mutation and evaluation to assess their evolution in terms of performance and analyse if better
individuals were generated [34, 57]. In the evolutionary algorithm context of optimising
pull-type control strategies, an individual is seen as a given set of authorisation cards for the entire
manufacturing system and the evolution has the objective of providing superior performance
metrics.
Genetic Algorithms (GA) are search algorithms that are based on the Theory of Evolution as
defined by Charles Darwin. The optimisation search begins with a set of random potential
solutions chromosomes. GA evolves this initial population through generations towards a
population that tends to retain the best traits through the survival of the fittest, most optimum
solutions. Individuals from the current population are assessed and selected so that the fittest
individuals have an increased chance of being selected for generating future generations. The
reproduction process is comprised of selection, crossover, and mutation, accordingly, the selected
individuals go through mutation and crossover recombination. The crossover mechanism allows
for the mixing of parental information and passing it on to their offspring, while mutation
introduces innovation into the population. Therefore, the population tends to develop into a better
fit. [39, 51, 57-59]
The genetic algorithm used within the Extendsim simulation software to optimise the system’s
parameters and generate the Pareto optimal frontier was written and tested according to the work
of Kernan and Geraghty [60]. Multi-objective Genetic Algorithms (MOGAs), have their search
efficiency tied to the ability of the algorithm to quickly find similarities among solutions [51, 60].
The procedure for this MOGA code was designed according to the following logic:
1.
Initialisation:
An initial population is created with a random set of the parameters to be analysed, from
a given research space
2.
Dominance check:
The results, multi-objective responses, are recorded to classify which individuals are
non-dominated individuals, then a Boolean value is assigned
3.
Adjustment:
Individuals in the current population, which are dominated, are replaced by an offspring
created from the two different non-dominated parents. These parents are randomly
assigned from the current population with equal probability of being chosen. The
chromosome that defines the offspring can suffer mutation, through a hybrid
recombination referred to as Triad-Based Recombination (TRD). This exo-parental
mutation has a probability set to it by the user. Then, the offspring’s chromosome can
take the value of either parents or a new mutated value
4.
Dominance recheck:
The performance results of the adjusted population are rechecked and classified to find
the best traits and the non-dominated solutions
5.
Increase population:
If all individuals of the current populations are optimum, or non-dominated, five new
offsprings are created
6.
Repeat:
The algorithm is repeated from step 2 and it can be terminated by the number of
generations or the number of dead runs given by the user. The algorithm also ends if the
entire decision space is searched. [51]
In its learning nature, Artificial Neural Network shares features with Reinforcement Learning
[61], Ant Colony Optimisation [62, 63] and Evolutionary Algorithms, making the latter similarly
suitable for simulation-based supply chain processes optimisation [39, 55, 64-66]. This
simulation-based optimisation [67] experiments with multiple scenarios have the objective of
researching, finding and improving the parameters to get the best fitting results, hence
maximising the performance metrics of a simulated system. This performance is usually
described as an objective function that will try to minimise or maximise metrics, such as
simultaneously minimising the WIP and the backlog of demands BL [34-36, 68, 69].
The NSGA-II algorithm (Non-dominated Sorting Genetic Algorithm) was also tested for the
optimisation processes involved in this research. It was designed according to the work of Deb
et al. [70-73] and the optimisation results were similar to the ones achieved by the optimiser
within Extendsim. Premature convergence of the data points on the Pareto frontier may become
an issue as the size of the test increases. [74, 75]
2.2.2.
Performance Metrics
Some of the common metrics for the evaluation of production control strategies are throughput
![Figure 2-13. Second-order stochastic dominance: Option A second-order stochastically dominates option B [92]](https://thumb-us.123doks.com/thumbv2/123dok_us/806261.2601927/46.892.266.661.125.372/figure-second-stochastic-dominance-option-second-stochastically-dominates.webp)