26 November 2014
Version of attached le: Accepted Version
Peer-review status of attached le: Peer-reviewed
Citation for published item:
Moreno-Garca, P. and Gulcur, M. and Manrique, D.Z. and Pope, T. and Hong, W. and Kaliginedi, V. and Huang, C. and Batsanov, A.S. and Bryce, M.R. and Lambert, C. and Wandlowski, T. (2013) 'Single-molecule conductance of functionalized oligoynes : length dependence and junction evolution.', Journal of the American Chemical Society., 135 (33). pp. 12228-12240.
Further information on publisher's website: http://dx.doi.org/10.1021/ja4015293
Publisher's copyright statement:
This document is the Accepted Manuscript version of a Published Work that appeared in nal form in The Journal of the American Chemical Society copyright c2013 American Chemical Society after peer review and technical editing by the publisher. To access the nal edited and published work see http://dx.doi.org/10.1021/ja4015293.
Additional information:
Use policy
The full-text may be used and/or reproduced, and given to third parties in any format or medium, without prior permission or charge, for personal research or study, educational, or not-for-prot purposes provided that:
• a full bibliographic reference is made to the original source
• alinkis made to the metadata record in DRO
• the full-text is not changed in any way
The full-text must not be sold in any format or medium without the formal permission of the copyright holders. Please consult thefull DRO policyfor further details.
This document is confidential and is proprietary to the American Chemical Society and its authors. Do not copy or disclose without written permission. If you have received this item in error, notify the sender and delete all copies.
Single-Molecule Conductance of Functionalized Oligoynes: Length Dependence and Junction Evolution
Journal: Journal of the American Chemical Society Manuscript ID: ja-2013-015293.R2
Manuscript Type: Article Date Submitted by the Author: 08-Jul-2013
Complete List of Authors: Moreno-Garcia, Pavel; Universität Bern, Departement für Chemie und Biochemie
Gulcur, Murat; University of Durham, Chemistry Manrique, David; Lancaster University , Physics Pope, Thomas; Lancaster University, Physics
Hong, Wenjing; Universität Bern, Departement für Chemie und Biochemie Kaliginedi, Veerabhadrarao; University of Bern, Chemistry and
Biochemistry
Huang, Cancan; University of Bern, Chemistry and Biochemistry, Batsanov, Andrei; Durham University, Chemistry
Bryce, Martin; University of Durham, Chemistry Lambert, Colin; Lancaster University, Physics
Wandlowski, Thomas; Universität Bern, Departement für Chemie und Biochemie
Single-Molecule Conductance of Functionalized Oligoynes: Length
Dependence and Junction Evolution
Pavel Moreno-García,1,4,† Murat Gulcur,2,† David Zsolt Manrique,3,† Thomas Pope3,†, Wenjing Hong,1 Veerabhadrarao Kaliginedi,1 Cancan Huang,1 Andrei S. Batsanov,2 Martin R. Bryce,2,* Colin Lambert3,*and Thomas Wandlowski1,*
1
Department of Chemistry and Biochemistry, University of Bern, Freiestrasse 3, CH-3012, Bern, Switzerland
2
Department of Chemistry, Durham University, Durham DH1 3LE, UK 3
Department of Physics, Lancaster University, Lancaster LA1 4YB, UK 4
Instituto de Física, Benemérita Universidad Autónoma de Puebla, Apartado Postal J-48, Puebla 72570, México
[email protected], [email protected]; [email protected] †
These authors contributed equally to the work.
Abstract
We report a combined experimental and theoretical investigation of the length dependence and anchor-group dependence of the electrical conductance of a series of oligoyne molecular wires in single-molecule junctions with gold contacts. Experimentally, we focus on the synthesis and properties of diaryloligoynes with n = 1, 2 and 4 triple bonds, and the anchor dihydrobenzo[b]thiophene (BT). For comparison, we also explored the aurophilic anchor group cyano (CN), amino (NH2), thiol (SH) and 4-pyridyl (PY). Scanning-tunneling-microscopy break junction (STM-BJ) and mechanically-controllable break junction (MCBJ) techniques are employed to investigate single molecule conductance characteristics. The BT-moiety is superior as compared to traditional anchoring groups investigated so far. BT-terminated oligoynes display a 100 % probability of junction formation and possess conductance values which are the highest of the oligoynes studied and, moreover, are higher than other conjugated molecular wires of similar length. Density functional theory (DFT)-based calculations are reported for oligoynes with n = 1 - 4 triple bonds. Complete conductance traces and conductance distributions are computed for each family of molecules. The sliding of the anchor groups leads to oscillations in both the electrical conductance and the binding energies of the studied molecular wires. In agreement with experimental results, BT-terminated oligoynes are predicted to have a high
3 4 5 6 7 8 9 10 11 12 13 14 15 16 17 18 19 20 21 22 23 24 25 26 27 28 29 30 31 32 33 34 35 36 37 38 39 40 41 42 43 44 45 46 47 48 49 50 51 52 53 54 55 56 57
electrical conductance. The experimental attenuation constants βH range between 1.7 nm -1
(CN) and 3.2 nm-1 (SH) and show the following trend: βH(CN) < βH(NH2) < βH(BT) < βH(PY) ≈
βH(SH). DFT-based calculations yield lower values, which range between 0.4 nm -1
(CN) to 2.2 nm-1 (PY).
Keywords: Oligoynes, Polyynes, Molecular rods, Single-molecule conductance, MCBJ, STM, DFT
Introduction
Conjugated polyyne molecules are of interest as a family of carbon rich backbones.1-3 They comprise an array of sp-hybridized carbon atoms with alternating single and triple bonds and almost cylindrical electron delocalization in a one-dimensional chain.2,4-5 Polyynes and shorter sp
oligomers (oligoynes) have been proposed for molecular electronics applications (wires, switches, non-linear optics, etc.).6-7 Their study is therefore of both fundamental and economic interest. Unlike oligo(phenylenevinylene) (OPV)8-10 and oligo(phenyleneethynylene) (OPE),11-14 the conjugation over the oligo/polyyne carbon backbone is not interrupted by phenyl rings or by bond rotations.15 Theoretical studies have predicted that polyynes should have excellent intramolecular electron- and charge-transport properties, exhibiting efficient molecular wire behavior.16-18 In this regard, experimental studies are very much an open issue.
Polyynes possess reduced stability with increasing length of the sp-chain. The main strategies to stabilize longer derivatives are to terminate the chains with bulky aryl or organometallic groups,18-21 or to shield the polyyne backbone.22-23 Without such stabilizing groups, polyynes which are longer than eight acetylenic carbons (i.e. tetrayne derivatives) tend to decompose or polymerize rapidly at room temperature.24-25 By using very bulky tris(3,5-di-t-butylphenyl)methyl end groups, polyynes comprising up to 44 contiguous carbons have been characterized under normal laboratory conditions.26 Optical spectroscopic studies in solution showed that these systems exist as alternating single and triple bonds with a very low HOMO-LUMO gap.
A standard protocol for accurately assessing the charge transport through single or a few molecules is to anchor the molecule(s) between metal electrodes (often gold) and to study the electronic properties of the metal-molecule-metal junction by scanning tunneling microscopy (STM) or mechanically controllable break junction (MCBJ) methods.25-31 This requires molecules to be terminated by functional groups, which have relatively high binding strengths to gold, e.g.
3 4 5 6 7 8 9 10 11 12 13 14 15 16 17 18 19 20 21 22 23 24 25 26 27 28 29 30 31 32 33 34 35 36 37 38 39 40 41 42 43 44 45 46 47 48 49 50 51 52 53 54 55 56 57
thiol,32-33 pyridyl34-36 and amino.37 However, functional groups at the terminal positions can react (inter- or intra-molecularly) with the sp-backbone to form polymer-like structures38 and the bulky terminal groups, which are known to stabilize longer polyynes, are not suitable for anchoring the molecules to metal surfaces. Therefore, it remains a considerable challenge to synthesize oligoynes or polyynes with end-groups which will anchor the molecule to gold (as well as to other conducting leads), and will be stable to purification and handling under ambient conditions. Fundamentally new aspects of synthetic oligoyne chemistry need to be developed to enable these π−systems to be exploited in molecular junctions. In this context, the first examples were stable 4-pyridyl (PY) end-capped derivatives up to a C8 (tetrayne) chain length (PY(–C≡C)n–PY; n = 1,
2, 4). Their electrical properties were studied in STM-BJ experiments.39 Subsequently a molecule with a C8 chain between two bulky triarylphosphine-Pt(II) centers bearing thiol end groups was studied in MCBJ experiments.40 Two very recent papers reported single molecule charge transport characteristics of short-chain (n = 1) tolane derivatives.36,41 However, these reports do not address the challenge of the synthesis, characterization and electrical measurement of longer analogs which is the focus of the present article. We now describe, for the first time, a comprehensive family of diaryloligoyne molecular wires Ar(–C≡C)n–Ar, n = 1, 2, 4, with five
different terminal functionalities (Scheme 1).
Ar Ar Ar = H2N NC HS S Ar Ar Ar Ar n= 1 n= 2 n= 4 N SH* Ar1 Ar2 A r4
* SH1,SH2andSH4were isolated as the bis(thioacetate) derivatives
NH2 CN BT
PY
Scheme 1. Structures of the molecules discussed in this work and their nomenclature.
We focus on the diaryloligoynes (n = 2, 4) under ambient laboratory conditions. Comparisons are made with the corresponding diarylacetylene (tolane) derivatives (n = 1). We explore charge transport characteristics and address the effect of the molecular length on the conductance of these families of oligoynes by performing single-molecule transport measurements for the stable derivatives using complementary scanning tunneling microscopy and mechanically controlled break junction techniques, STM-BJ34,36 and MCBJ.8,42 DFT-based calculations provide additional insights into the electronic structure of our molecular junctions. The paper will particularly
3 4 5 6 7 8 9 10 11 12 13 14 15 16 17 18 19 20 21 22 23 24 25 26 27 28 29 30 31 32 33 34 35 36 37 38 39 40 41 42 43 44 45 46 47 48 49 50 51 52 53 54 55 56 57
demonstrate the superior structure and electronic properties of the dihydrobenzo[b]thiophene (BT) anchoring group attached to a carbon rich backbone for charge transport studies in (single) molecular junctions.
EXPERIMENTAL SECTION Synthesis of Diaryloligoynes
Diarylacetylene (tolane) compounds Ar1 were synthesized by Sonogashira couplings between the corresponding arylacetylene and aryl iodide derivatives.43 Compounds PY2, NH22 and CN2 derivatives were synthesized by oxidative dimerization of arylacetylenes.44-45 The diarylbutadiyne derivatives SH2 [as the bis(thioacetate) derivative], BT2 and all diaryltetrayne derivatives Ar4
were synthesized by dimerization of trimethylsilyl-protected precursor compounds under Eglington-Galbraith coupling conditions [Cu(OAc)2.H2O, pyridine, methanol] (Scheme SI-1).
44-47
We have also synthesized the dihydrobenzo[b]thienyl (BT) end-capped compounds BT1, BT2
and BT4, which to our knowledge is the first series of molecules to incorporate this anchor group The use of this anchor group was motivated by a recent report on the transport properties of compound 1 in metal-molecule-metal junctions.48
S S
1
During the preparation of this manuscript Szafert et al. reported the synthesis of CN4 using similar methodology.49
The reported synthetic route to 1 (by reduction of the parent benzo[1,2-b:4,5-b’]dithiophene) is not applicable to the functionalized derivatives required for the BT series in the present work, so a new synthetic strategy for functionalization of dihydrobenzo[b]thiophene was required. The syntheses of compounds BT1, BT2 and BT4 starting from the novel iodo derivative 2a are shown in Scheme 2. 3 4 5 6 7 8 9 10 11 12 13 14 15 16 17 18 19 20 21 22 23 24 25 26 27 28 29 30 31 32 33 34 35 36 37 38 39 40 41 42 43 44 45 46 47 48 49 50 51 52 53 54 55 56 57
Scheme 2. Synthesis of BT1, BT2 and BT4. (i) TMSA, [Pd(PPh3)4], CuI, (i-Pr)2NH, THF, rt, 4 h, 95%; (ii) TBAF, THF, rt, 15 min, 92%; (iii) 2a, [Pd(PPh3)4], CuI, (i-Pr)2NH, THF, rt, 4 h, 75%; (iv) Cu(OAc)2.H2O, pyridine, MeOH, rt, 12 h, 86%; (v) HC≡C–C≡C–TMS, [Pd(PPh3)4], (i-Pr)2NH, THF, rt, 4 h, 78%; (vi) Cu(OAc)2.H2O, pyridine, MeOH, rt, 12 h, 77%.
The diyne derivatives Ar2 are all stable to storage in air at room temperature. An initial aspect of the work was to establish how the stability of the tetrayne derivatives Ar4 is dependent on the functionality on the head groups, as this will determine which derivatives are suitable for molecular junction formation. Earlier work showed that primary amines readily react with oligoyne chains,38 and that 2-aminophenyl end-capped tetrayne reacts intramolecularly to form indole derivatives in the presence of a copper salt.47 We have found that compounds PY4, CN4
and BT4 are all very stable under ambient conditions. NH24 is light sensitive and less stable, which precluded the use of this molecule in junction formation in the present study. Compound
SH4 [bis(thioacetate) derivative] decomposed rapidly and it could not be purified. However, a UV-Vis absorption spectrum of the reaction mixture (Figure S4 in SI) showed a significant red shift compared to SH2 and the vibronic features are consistent with the formation of the tetrayne
SH4. The X-ray crystal structures of CN4, BT4 and BT2 are discussed in the Supporting Information (SI).
Conductance-Distance Measurements
The transport properties of single molecular wires were studied using STM-BJ33-34 and complementary MCBJ8,42 measurements in solution, at room temperature and under argon. The
3 4 5 6 7 8 9 10 11 12 13 14 15 16 17 18 19 20 21 22 23 24 25 26 27 28 29 30 31 32 33 34 35 36 37 38 39 40 41 42 43 44 45 46 47 48 49 50 51 52 53 54 55 56 57
STM-BJ approach is based on the repeated formation and breaking of a vertical (single) molecule junction between an atomically-sharp gold STM tip and a flat Au(111) substrate, and the simultaneous monitoring of the current iT or conductance G = iT/Vbias at constant bias voltage
Vbias.34 The MCBJ technique relies on the formation and rupture of molecular junctions between horizontally suspended gold wires.42
The STM-BJ experiments were carried out with a modified Molecular Imaging Pico SPM equipped with a dual-channel preamplifier and housed in an all-glass argon-filled chamber.13,50 The current (iT) - distance (∆z) measurements were performed with a separate, lab-built analog ramp unit. For further technical details we refer to our previous work.13,51 The sample electrodes were Au(111) disks, 2 mm height and 10 mm in diameter, or gold single crystal bead electrodes. The Au(111) substrates were flame-annealed before each experiment. The STM tips were uncoated, electrochemically etched gold wires (Goodfellow, 99.999 %, 0.25 mm diameter). The solutions were prepared from 1,3,5-trimethylbenzene (TMB, Aldrich, p.a.) and tetrahydrofuran (THF, Aldrich, p.a.), volume ratio 4 : 1, containing 0.1 mM of the target molecules. The substrate surface was inspected by STM-imaging before the start of each set of iT - ∆z measurements. Typically, we recorded up to 10000 individual traces with a pulling rate of 58 nm s-1.
The MCBJ experiments are based on the trapping of individual molecules between two atomically sharp gold wires (99.999%, Goodfellow, 100 µm diameter), freely suspended and supported on a sheet of spring steel. The latter is bent by a pushing rod, whose vertical movement is controlled by a stepper motor in combination with a piezo stack. The usual moving rate of the pushing rod was 3 to 150 nm s-1, which translates into an opening respective closing rate of 0.1 to 5 nm s-1. Typically, we recorded up to 2000 stretching cycles to obtain statistically significant data.
The high mechanical stability of the MCBJ set-up allowed also the simultaneous acquisition of current - bias voltage characteristics (iT - Vbias) during the stretching process. We reduced the piezo rate in these experiments to 10 nm s-1, and swept Vbias continuously between -1.00 V and + 1.00 V with 40 V s-1. We recorded 500 data points per iT - Vbias curve and acquired ca. 25 traces per second. Typically, we measured 20 to 50 individual curves during the various stages of one single breaking cycle. Further technical details of our MCBJ set-up as well as of our measuring routines are described in refs.36,42. Finally, we note that the solutions were the same as in the complementary STM-measurements. 3 4 5 6 7 8 9 10 11 12 13 14 15 16 17 18 19 20 21 22 23 24 25 26 27 28 29 30 31 32 33 34 35 36 37 38 39 40 41 42 43 44 45 46 47 48 49 50 51 52 53 54 55 56 57
Theoretical Methods
Electronic and transport calculations of the five oligoyne series with BT, SH, PY, NH2, CN anchor groups were performed with the ab-initio code SMEAGOL52-53, which uses the Hamiltonian provided by the DFT code SIESTA54 in combination with the non-equilibrium Green’s function formalism. SIESTA employs non-conserving pseudo-potentials to account for the core electrons, and a linear combination of pseudo-atomic orbitals. SMEAGOL divides the entire nanoscale junction into three parts; the left and the right bulk electrodes simulated by multiple gold layers grown along the (111) direction and the “extended molecule” that consists of the molecule and gold pyramids modeling the tip and the electrode. SMEAGOL uses the Hamiltonian derived from SIESTA to calculate self-consistently the density matrix, the transmission coefficients T(E) of the electrons from the left to the right lead and the iT - Vbias characteristics. Further details about the above computation methods, the energy level alignment and simulations of the conductance versus distance traces are given in the SI.
Results and Discussion
Dihydrobenzo[b]thienyl-capped oligoyne series (BT): Conductance Measurements.
STM-BJ and MCBJ Conductance Measurements.
Figure 1A displays three typical sample sets of conductance (G) versus distance (∆z) stretching traces, plotted in a semi-logarithmic scale, as recorded for the three dihydrobenzo[b ]thiophene-capped oligoynes BT1, BT2 and BT4 in TMB/THF using the STM-BJ approach. After formation of the contact between the gold tip and the Au(111) substrate, the tip was withdrawn with a rate of 58 nm s-1. All curves show initially a step-like decrease of the conductance from 10 G0up to 1
G0; G0 = 2e 2
/h = 77.5 µS being the quantum of conductance. Subsequently, the conductance decreases by several orders in magnitude, which is assigned to the “jump out of contact”.55 The gold contacts retract suddenly by (0.5 ± 0.1) nm, the so-called snap-back distance ∆zcorr (see SI and ref. 36, 55-56 for details). Additional features, such as single and multi conductance plateaus are observed at G ≤ G0, which are attributed to the formation of (single) molecular junctions. The noise level is reached at G < 10-6G0 in the STM-BJ experiments.
3 4 5 6 7 8 9 10 11 12 13 14 15 16 17 18 19 20 21 22 23 24 25 26 27 28 29 30 31 32 33 34 35 36 37 38 39 40 41 42 43 44 45 46 47 48 49 50 51 52 53 54 55 56 57
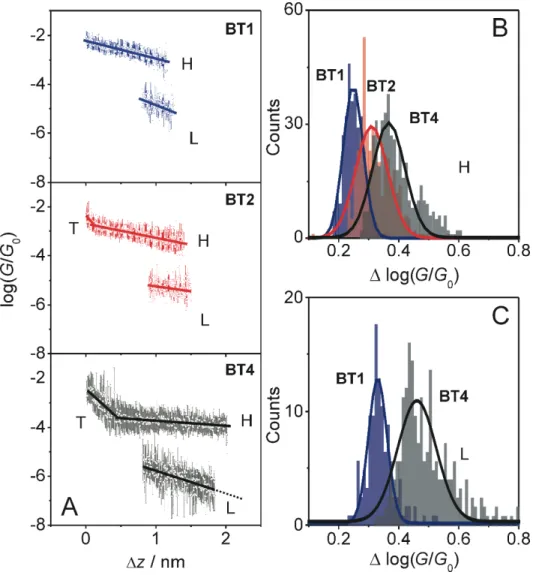
Figure 1. (A-C) Conductance measurements of BT-end-capped oligoynes in TMB/THF (4 : 1, v/v) employing a STM-BJ (A-C) and a MCBJ (D-F) set-up. (A,D) Typical conductance distance traces of BT1,
BT2 and BT4. (B,E) 1D conductance histograms and (C,F) 2D conductance histograms generated from 2000 individual curves. The conductance traces were recorded with Vbias = 0.035 V and a stretching rate of 58 nm s-1 (STM) or 5 nm s-1 (MCBJ). The asterisk indicates the noise level of the set-up. The small spike at log(G/G0) ≈ -2 in panel B is an artifact related to the switching of the amplifier stage.
3 4 5 6 7 8 9 10 11 12 13 14 15 16 17 18 19 20 21 22 23 24 25 26 27 28 29 30 31 32 33 34 35 36 37 38 39 40 41 42 43 44 45 46 47 48 49 50 51 52 53 54 55 56 57
Several thousands of individual G - ∆z traces were recorded and subsequently analyzed further by constructing all-data point histograms (without data selection), to extract statistically significant results. Figure 1B displays the corresponding one-dimensional (1D) histograms of BT1, BT2 and
BT4 in a semi-logarithmic scale. We observe well-defined conductance peaks GH, which shift towards lower values with increasing number of C≡C- units. Gaussian fits lead to (316 ± 136)· 10 -5
G0, (81 ± 9)·10-5G0 and (20 ± 6)·10-5G0 as most probable conductances of BT1, BT2 and BT4, respectively. We notice that the values of most probable high conductances GH were found to be independent on the oligoyne concentration down to 100 nM. Furthermore, the shape of the individual stretching traces, in particular the conductance plateaus in the GH region, the fluctuations of the conductances as well as the most probable characteristic displacement upon junction elongation ∆zH* (see Figure 2 for definition) do not reveal a significant concentration dependence. Only the probability of junction formation changes with oligoyne concentration due to the limited availability of the target molecules. For further details we refer to SI, Chapter 2.1 (Figure S18), which describes the characteristics of molecular junctions formation of BT1 for concentrations ranging between 1 µM up to 1 mM as a representative case study. These observations provide strong evidence in support of the formation of single molecular junctions under our experimental conditions.
In addition, BT1 and BT2 revealed a second, rather broad and lower conductance feature GL with maxima at (0.8 ± 0.2)·10-5 G0 and (0.30 ± 0.03)·10
-5
G0 for BT-concentrations larger than 0.01 mM (Figure S18), respectively. The STM-BJ experiments did not resolve a low conductance GL for the longest oligoyne BT4, most probably due to superposition with the noise level.
The above analysis was extended by constructing two-dimensional (2D) conductance vs. displacement histograms.51,57 This representation provides direct access to the evolution of molecular junctions during the formation, stretching and break-down steps. Figure 1C displays, as a typical example, the data for BT1. (The corresponding plots of BT2 and BT4 are shown in SI). The individual G - ∆z traces were aligned by setting the common origin to 0.7 G0. The data of Figure 1C reveal quantized conductance features at G ≥ 1 G0. They correspond to the breaking of gold-gold contacts. Additional high-density data clouds are observed in 3.3·10-4G0 ≤ GH ≤ 10
-2 G0 and 10-6G0 ≤ GL ≤ 3.2·10 -5 G0, centered on 3.2·10 -3 G0 and 10 -5
G0, respectively. These regions represent the high and the low conductance states of derivative BT1. The 2D histogram in Figure 1C demonstrates further that both the high and the low conductances decrease monotonously with increasing relative displacement (or junction elongation) ∆z.
3 4 5 6 7 8 9 10 11 12 13 14 15 16 17 18 19 20 21 22 23 24 25 26 27 28 29 30 31 32 33 34 35 36 37 38 39 40 41 42 43 44 45 46 47 48 49 50 51 52 53 54 55 56 57
The results of the STM-BJ experiments are supported by corresponding MCBJ-measurements (c.f. Figure 1D to 1F and SI). Table 1 compiles the most probable conductance values of GH* and
GL* of the three BT-derivatives. The conductances GH are significantly higher than reported values of other conjugated molecular wires of similar length.10,13,58-60 We also note that the higher sensitivity of our MCBJ set-up allowed an estimate of the most probable low conductance of
BT4, which was obtained as GL* ≈ 0.1·10-5G0.
Stretching Distance and Junction Formation Probability
Analyzing the evolution of a molecular junction upon stretching provides additional information about stability and transitions between the two conductance states H and L. We constructed relative displacement (∆z) histograms36 by calculating the displacement from the relative zero position at 0.7 G0 (Gmax as upper limit) to the end of the high (low) conductance region of every individual trace. The lower limit(s) Gmin is defined as one order of magnitude beneath the most probable high (low) conductances GH* (GL*) respectively. Both values were obtained from analyzing the 1D histograms (Figure 1).
Figure 2. (A) Characteristic displacement histograms from STM-BJ experiments as analyzed for BT1, BT2
and BT4 in the high conductance region. (B) Comparison of characteristic-displacement histograms of BT1
obtained from the high (H: 0.7 G0 - 3.2·10-4G0) and in the low (L: 0.7 G0 - 10-6G0) conductance regions of the 2D conductance vs. displacement histograms (Figure 1 and SI).
Figure 2A displays the characteristic displacement histograms of BT1, BT2 and BT4 in the high conductance region H, and Figure 2B illustrates, as an example, the characteristic-displacement histogram of BT1 extended into the stability range of the low conductance state L. The data of
3 4 5 6 7 8 9 10 11 12 13 14 15 16 17 18 19 20 21 22 23 24 25 26 27 28 29 30 31 32 33 34 35 36 37 38 39 40 41 42 43 44 45 46 47 48 49 50 51 52 53 54 55 56 57
Figure 2A show uniform normal distributions with well-defined maxima. The maxima correspond to the most probable characteristic distances ∆z*, which are measures of the most-probable plateau lengths of the H conductance states of the three molecules. Gaussian fits to the experimental data revealed the following values of ∆zH*: (0.88 ± 0.01) nm (BT1), (1.06 ± 0.08) nm (BT2) and (1.43 ± 0.10) nm (BT4), Table 2. The widths of the three distributions appear to increase with molecular length, which suggests larger variations in junction geometry of BT4 as compared to BT1. No stretching trace shorter than 0.5 nm was found, indicating that no direct tunneling traces through the solution were observed.51 Therefore, we conclude that the molecular junction formation probability in the high conductance H-state of BT1, BT2 and BT4 approaches 100%. Extending the analysis to 0.1 GL* reveals a second maximum in the characteristic-displacement distributions, which is attributed to the most probable characteristic characteristic-displacement
∆zL* of the low conductance state L. Figure 2B shows the corresponding data. We obtained (1.1 ± 0.2) nm, (1.3 ± 0.1) nm and (1.6 ± 0.2) nm for BT1, BT2 and BT4, respectively (Table 2). Evaluating these data reveals further that all traces transform from the H-state into the L-state upon elongation of the molecular junction before it breaks completely and reaches the noise level.
The most-probable absolute displacements zH* or zL* in an experimental molecular junction formed between a gold STM-tip and an Au(111) surface are obtained by adding the snap-back distance ∆zcorr(c.f. refs.36,55-56 and SI) to the relative displacement ∆z: zi* = ∆zi* +∆zcorr, i = H, L. Referring to our previous work with short tolane molecules PY1, NH21, CN1 and SH1
36
we used ∆zcorr = (0.5 ± 0.1) nm. Table 2 shows a comparison between the resulting values of zH* and zL* and the theoretical estimations of the corresponding electrode displacements of fully-extended junctions just before breaking (denoted LJ
rel
= LJ – 0.25 nmin Table 2 and S2). This comparison
demonstrates that the experimental values of zH* are typically smaller than the theoretical estimates of LJ
rel
. On the other hand, zL* is significantly larger than zH* and almost equal to LJ rel
. The relationship between LJ
rel
and a variety of other relevant lengths is addressed in Table 2, Table S2 and Figure 6.
Conductance Decay and Variation with Displacement
To gain further insight into the evolution of the molecular conductance upon stretching, we calculated the most probable conductances Gst at each relative displacement position ∆z from Gaussian fits to cross sections of the 2D histograms37 (Figure 3A). The individual conductance-distance traces, G versus ∆z, and the 2D histograms, such as shown in Figure 1, demonstrate that
3 4 5 6 7 8 9 10 11 12 13 14 15 16 17 18 19 20 21 22 23 24 25 26 27 28 29 30 31 32 33 34 35 36 37 38 39 40 41 42 43 44 45 46 47 48 49 50 51 52 53 54 55 56 57
(i) the plateaus of molecular junctions extend over much longer distances than steps in the Au - Au nanocontacts36 and (ii) that the conductances change during the stretching process by one to two orders in magnitude. These characteristics indicate that there are changes in conformation and contact geometry or aggregation (e.g. π-stacking, solvation) during the formation and elongation of a molecular junction until rupture. Figure 3A to 3C display the statistically averaged conductances versus relative displacement master curves log(Gst/G0) vs ∆z together with the standard deviations for BT1, BT2 and BT4 trapped between two gold electrodes in the high and in the low conductance states, respectively.
Figure 3. (A) Statistically averaged conductance-distance traces (circles) with variation indicated by the standard deviation (bar) and fitting of the traces (line) of BT1, BT2 (STM-BJ) and BT4 (MCBJ). (B) Distribution of variations in conductance ∆log(G/G0) with reference to the mean values (solid lines in panel A) at different positions in the H conductance and (C) in the L conductance range during stretching of BT1,
BT2 and BT4. The data of BT2 nearly coincide with BT1 in panel (C) and are therefore not shown.
3 4 5 6 7 8 9 10 11 12 13 14 15 16 17 18 19 20 21 22 23 24 25 26 27 28 29 30 31 32 33 34 35 36 37 38 39 40 41 42 43 44 45 46 47 48 49 50 51 52 53 54 55 56 57
We observed that Gst decreases in the high conductance state linearly with slopes of 0.84 nm-1 (BT1), 0.61 nm-1 (BT2) and 0.31 nm-1 (BT4). The slope decreases with molecular length. Compounds BT2 and BT4 show additional regions in 0 ≤ ∆z ≤ 0.11 nm and 0 ≤ ∆z ≤ 0.30 nm, which reflect contributions of through space tunneling at the beginning of the stretching process, and interfere with the molecular junction conductance in these regions. Upon increasing the distance between the gold contacts, the contributions due to direct tunneling decrease, and the slope δlog(Gst/G0)/δ(∆z) is exclusively determined by the conductance through the molecular junctions. Transition into the low conductance state L is manifested in the master curve by a coexisting range, which indicates a sequential transition of the molecular junction from H to L, followed by an additional range in the displacement plot that only reveals the L-state until rupture.
Changing the oligoyne concentration from 1 mM to 1 µM does not lead to modifications of the plot of the statistically averaged most probable conductance Gst versus the relative displacement position ∆z, except that no low conductance features and a much lower background contribution in the 1D logarithmic histogram were found for BT concentrations below 0.1 mM. These observations strengthen the argument for the formation of single molecule junctions under our experimental conditions. For the original data and further details we refer to SI, Figure S18.
The distributions of the variation in conductance as shown in Figure 3B and 3C were obtained by decomposing the 2D histograms (Figure 1 and SI) into 1D histograms at different relative displacements ∆z and subsequent Gaussian fits.36 The resulting distributions are rather narrow in displacement regions dominated by the high conductance H - state (Figure 3B), and broaden in the L-state region (Figure 3C). Particularly large fluctuations are observed in the transition region. We also notice that increasing the molecular length L causes a systematic broadening of variations in the entire displacement region ∆z, which clearly indicates a lower stability and less uniform (single) molecular junctions.
Effect of molecular length and anchoring group on the conductance
We investigated next the influence of molecular length (n = 1, 2, 4) and anchoring group on conductance and stability of oligoyne-type molecular junctions following the methodology described above for the three BT-terminated compounds. The key parameters are summarized in Tables 1 and 2. The original experimental data are shown in SI. In the following paragraph we
3 4 5 6 7 8 9 10 11 12 13 14 15 16 17 18 19 20 21 22 23 24 25 26 27 28 29 30 31 32 33 34 35 36 37 38 39 40 41 42 43 44 45 46 47 48 49 50 51 52 53 54 55 56 57
will describe experimental results and correlations, which will be subsequently compared with electronic structure and ab-initio transport calculations.
Most probable single junction conductances
The PY-terminated oligoynes revealed up to three distinct conductance features upon stretching the molecular junctions,36,39 which lead to most probable high (GH*), mid (GM*) and low (GL*) conductance values. All three regions were resolved for molecule PY1. We obtained the following results: GH*(PY1) = (39 ± 9)·10
-5
G0, GM*(PY1) = (7.9 ± 2.4)·10 -5
G0 and GL*(PY1) = (0.15 ± 0.08)· 10-5G0. The data of the high and medium conductance states agree with literature reports39, 61 within half an order of magnitude. In the case of the longer oligoynes, PY2 and PY4, only two and one distinct conductance regions were observed, which leads to GH*(PY2) = (17.4 ± 1.3)·10-5G0, GM*(PY2) = (3.2 ± 1.4)·10
-5
G0 and GH*(PY4) = (3.9 ± 1.1)·10 -5
G0 (Figure 4, Table 1). No further conductance regions could be resolved for PY2 and PY4 due to limitations in the sensitivity of our setup.
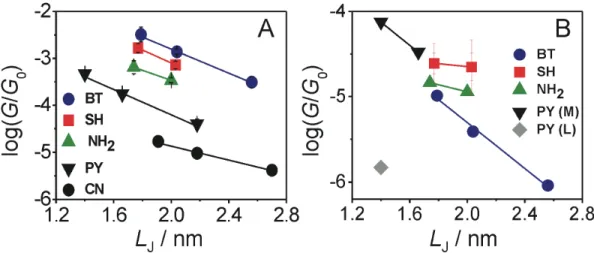
Figure 4. Most probable single junction conductance values GH* (A) and GL* (B) of the five families of oligoynes as determined from the analysis of 1D and 2D conductance histograms in dependence on the length parameter LJ(see Figure 6 and SI for definition).
Oligoyne molecular wires end-capped with NH2- and SH-anchoring groups demonstrated limited chemical stability for chain lengths n > 2 (see SI). For the shorter members of both families, we found two conductance regions with the most-probable values GH* and GL* shown in Table 1. The high conductance value of the NH2-terminated oligoynes with n = 1 is in good agreement with literature data.59,62 Published results of the corresponding dithiolate derivatives SH158 and
SH263 could not be confirmed. Possible reasons might be related to data selection58,63 or a
3 4 5 6 7 8 9 10 11 12 13 14 15 16 17 18 19 20 21 22 23 24 25 26 27 28 29 30 31 32 33 34 35 36 37 38 39 40 41 42 43 44 45 46 47 48 49 50 51 52 53 54 55 56 57
different experimental geometry intrinsically existing in the iT versus time measurements, which is the methodology chosen in ref.63. Just one region with rather well-defined most probable single junction conductance data GH* was found for the CN-terminated rods CN1, CN2 and CN4 (Figure 4, Table 1 and SI). The junction formation probability of this family decreases with increasing molecular length.
Figure 4 displays the dependencies of the most probable conductances GH* and GL* versus the characteristic length LJ. LJ is the DFT-predicted distance between the centers of the two apex gold atoms in a fully extended molecular junction. The corresponding data are compiled in Table 2. For further details we refer to Figure 6 and the discussion in SI.
The analysis of the most probable high conductance values GH* demonstrates an exponential dependence on distance for oligoynes with PY, CN and BT anchoring groups according to GH* =
GC·exp(-βH·LJ). GC represents an effective contact conductance reflecting the electronic coupling at the molecule-electrode interface. βH is the attenuation constant, which characterizes the electronic coupling in a specific molecular backbone in function of its length. The experimentally determined βH values range between (1.7 ± 0.1) nm-1 (CN) to ~3.18 nm-1 (SH). The following trend is observed βH(CN) < βH(NH2) < βH(BT) ≈ βH(PY) < βH(SH) (Table 1). We notice that the data set of the NH2 and SH-endcapped oligoynes are rather limited. NH24 and SH4 could not be measured successfully due to limited stability of these compounds under our experimental conditions.
The experimental values of the decay parameter βH of our study compare with those of other molecular bridges as follows: saturated alkanes10,33-34 (7 - 11 nm-1) > oligophenyls64-65 (OP, 3.5 - 5 nm-1) > oligo(phenylene-ethynylenes)13,58-60 (OPEs, 2.0 - 3.4 nm-1) > oligophenyleimine66 (OPI, 3 nm-1) > carotenoid polyenes67-68 (1.7 - 2.2 nm-1) > oligo(phenylene-vinylenes)10,69 (OPVs, 1.7 - 1.8 nm-1) > benzene-furan oligoaryls69 (1.1 - 1.3 nm-1) > oligothiophenes70 (OT, 1.0 nm-1) > carbodithioate-capped OPEs58 (CT, 0.5 nm-1) > porphyrin oligomers63 (0.4 nm-1) > pyridyl-capped oligoynes39 (0.06 nm-1). Our βH values are in the same range as those of typical conjugated wires, such as OPEs, OPVs and OPIs. We could not confirm the low βH values reported by Wang et al. in a previous study with PY-terminated oligoynes39. These conductance data are based on the analysis of iT versus time traces in the low bias regime, and differences in the most probable conductances may arise from differences in the statistical treatment of the data and from differences in tip geometries, which affect the position of the Fermi energy relative to the frontier orbitals.
3 4 5 6 7 8 9 10 11 12 13 14 15 16 17 18 19 20 21 22 23 24 25 26 27 28 29 30 31 32 33 34 35 36 37 38 39 40 41 42 43 44 45 46 47 48 49 50 51 52 53 54 55 56 57
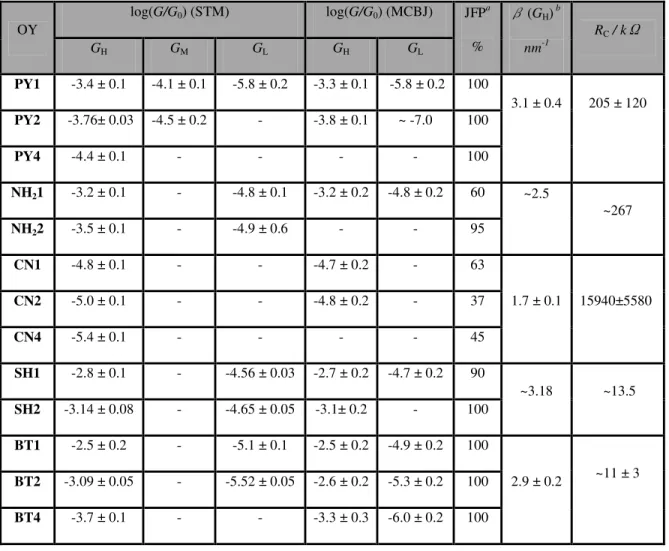
Table 1: Most probable conductance values of oligoyne (OY) derivatives as obtained from STM-BJ and MCBJ experiments. OY log(G/G0) (STM) log(G/G0) (MCBJ) JFPa % β(GH) b nm-1 RC / kΩ GH GM GL GH GL PY1 -3.4 ± 0.1 -4.1 ± 0.1 -5.8 ± 0.2 -3.3 ± 0.1 -5.8 ± 0.2 100 3.1 ± 0.4 205 ± 120 PY2 -3.76± 0.03 -4.5 ± 0.2 - -3.8 ± 0.1 ~ -7.0 100 PY4 -4.4 ± 0.1 - - - - 100 NH21 -3.2 ± 0.1 - -4.8 ± 0.1 -3.2 ± 0.2 -4.8 ± 0.2 60 ~2.5 ~267 NH22 -3.5 ± 0.1 - -4.9 ± 0.6 - - 95 CN1 -4.8 ± 0.1 - - -4.7 ± 0.2 - 63 1.7 ± 0.1 15940±5580 CN2 -5.0 ± 0.1 - - -4.8 ± 0.2 - 37 CN4 -5.4 ± 0.1 - - - - 45 SH1 -2.8 ± 0.1 - -4.56 ± 0.03 -2.7 ± 0.2 -4.7 ± 0.2 90 ~3.18 ~13.5 SH2 -3.14 ± 0.08 - -4.65 ± 0.05 -3.1± 0.2 - 100 BT1 -2.5 ± 0.2 - -5.1 ± 0.1 -2.5 ± 0.2 -4.9 ± 0.2 100 2.9 ± 0.2 ~11 ± 3 BT2 -3.09 ± 0.05 - -5.52 ± 0.05 -2.6 ± 0.2 -5.3 ± 0.2 100 BT4 -3.7 ± 0.1 - - -3.3 ± 0.3 -6.0 ± 0.2 100 a
JFP represents the single molecular junction formation probability. bThe β values were obtained using the average conductance values from STM and MCBJ-measurements and the characteristic length LJ (see Figure 6 for details of the definition of LJ). The β values of the NH2 and SH families are tentative because they are based on measurements of just two derivatives each. The contact resistance RC per contact site was obtained from the ordinate intersection at LJ = 0 based on the length dependence of log(G/G0) (c.f. Figure 4A).
We also observed that the effective contact resistances RC = 1/GC, determined by extrapolating the GH* versus LJ dependencies towards LJ → 0, lead to the following sequence: RC(BT) ≈
RC(SH) < RC(NH2) ≈ RC(PY) << RC(CN) (Table 1). The values of βH and RC demonstrate that the different anchor groups control the strength of the electronic coupling to the metal leads, but also the position of the energy levels involved in the electron transport across the single molecule junction as well as their coupling into the wire backbone. These aspects will be discussed in detail in the theory section.
3 4 5 6 7 8 9 10 11 12 13 14 15 16 17 18 19 20 21 22 23 24 25 26 27 28 29 30 31 32 33 34 35 36 37 38 39 40 41 42 43 44 45 46 47 48 49 50 51 52 53 54 55 56 57
Finally, we mention that a decay value of the low conductance region was accessible experimentally only for one molecular family, βL(BT) = (3.1 ± 0.2) nm
-1
. The other oligoyne derivatives did not allow the extraction of statistically-reliable values. However, at a qualitative level, we may state that the data available for several PY- , NH2-, SH- and BT- molecular wires lead to an effective βL-value clustering around (3.0 ± 0.5) nm
-1
. The absolute values of the corresponding most probable conductances GL* are less dependent on the nature of the anchoring group as compared to GH* (for further details see SI).
The widths of the distribution-variation of the junction conductances at various elongations in the high as well as in the low conductance regions increase in the following order: PY < BT < NH2 < SH < CN for oligoynes with n = 1 and n = 2 (Figure 3B and SI). This trend confirms our previous results with tolanes (n = 1), and is attributed to (i) the simultaneous influence of non-uniform binding geometries (in particular for members of the SH-family) and (ii) a decrease in binding energy/junction stability (CN).36 The width of the distribution increases also with the molecular length L within each family, which is particularly attributed to the second factor (Figure 3C and SI). The analysis of the low conductance state results in a larger variation of the respective conductance data (Figure 3C and SI), which correlates with the weaker interaction between the different molecules and a larger variation in possible binding geometries in these junctions. However, the overall trend is the same as that in the high conductance region.
Stretching Distance and Junction Formation Probability
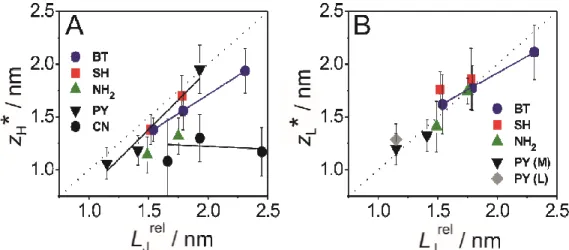
Figure 5. Dependence of the most probable characteristic length zi* of molecular junctions, i= H,L, on LJ rel (see Figure 6 for definition of LJrel) in the (A) high conductance range 0.7 G0 < G < 0.1 GH and in the (B) low conductance range 0.7 G0 < G < 0.1 GL. Each data point represents the average value of measurements carried out using at least three different bias values Vbias (0.025 V to 0.170 V). The error bars represent their standard deviations. 3 4 5 6 7 8 9 10 11 12 13 14 15 16 17 18 19 20 21 22 23 24 25 26 27 28 29 30 31 32 33 34 35 36 37 38 39 40 41 42 43 44 45 46 47 48 49 50 51 52 53 54 55 56 57
Following the strategy outlined for BT-capped oligoynes we constructed relative displacement histograms of all derivatives (SI), and analyzed the characteristic length distributions upon stretching in the high-conductance range, and up to the low-conductance region. We obtained the most probable relative characteristic distances ∆zi*, the absolute stretching length zi* (i = H, L) and the junction formation probabilities. These results are summarized in Figure 5 and in Tables 1 and 2.
Table 2. Characteristic lengths of oligoyne derivatives and molecular junctions as obtained experimentally and/or computed by DFT (see Figure 6 and SI for definitions).
OY La LJ b LJ relc ΔzH* d z H*= ΔzH* + zcorr e ΔzL* d z L* = ΔzL* + Δzcorr e zL*-zH* nm nm nm nm nm nm nm nm PY1f 0.98 1.40 1.15 0.56 ± 0.05 1.06 ± 0.05 0.69 ± 0.05 1.19 ± 0.05 0.13 ± 0.05 PY2f 1.24 1.66 1.41 0.68 ± 0.04 1.18 ± 0.04 0.82 ± 0.05 1.32 ± 0.05 0.14 ± 0.05 PY4 f 1.76 2.18 1.93 1.45 ± 0.13 1.95 ± 0.13 - - - NH21 1.26 1.74 1.49 0.68 ± 0.07 1.18 ± 0.07 0.91 ± 0.10 1.41 ± 0.14 0.23 ± 0.14 NH22 1.52 2.00 1.75 0.82 ± 0.07 1.32 ±0.07 1.24 ± 0.02 1.74 ± 0.02 0.42 ± 0.07 CN1 1.49 1.91 1.66 0.58 ± 0.3 1.10 ± 0.3 - - - CN2 1.76 2.18 1.93 0.80 ± 0.12 1.30 ± 0.12 - - - CN4 2.28 2.70 2.45 0.67 ± 0.13 1.17 ± 0.13 - - - SH1 1.31 1.77 1.52 0.88 ± 0.04 1.38 ± 0.04 1.26 ± 0.07 1.76 ± 0.07 0.38 ± 0.07 SH2 1.57 2.03 1.78 1.10 ± 0.09 1.60 ± 0.09 1.36 ± 0.20 1.86 ± 0.19 0.26 ± 0.19 BT1 1.31 1.79 1.54 0.88 ± 0.01 1.38 ± 0.01 1.1 ± 0.2 1.62 ± 0.18 0.24 ± 0.18 BT2 1.56 2.04 1.79 1.06 ± 0.08 1.55 ± 0.08 1.3 ± 0.1 1.77 ± 0.11 0.22 ± 0.11 BT4 2.08 2.56 2.31 1.43 ± 0.10 1.93 ± 0.11 1.6 ± 0.2 2.11 ± 0.16 0.18 ± 0.16 a
DFT result for the distance L from the center of one anchor atom at one end of a fully extended isolated molecule to the center of the anchor atom at the other end. bLJ = L+0.42 nm is the maximum possible length of the corresponding junction (see Figure 6 and Table S2 of SI). cLJ
rel
= LJ-0.25 nm is the corresponding electrode separation using the same definition zero of length used to define zH* and zL* . As shown in Table S2, this is almost identical to the length of a fully-extended junction just before breaking, obtained from DFT simulations of junction stretching. dEstimated from the experimental relative displacement histograms. e∆zcorr is the snapback distance = 0.5 nm. fFor the PY series the data in the ∆zL* column are for the characteristic length of the middle conductance range ∆zM*.
Analyzing the relative displacement (∆zi) distribution allows quantification of the junction formation probability (JFP),36 e.g. the percentage of successfully created molecular junctions out of all traces recorded (Table 1). These values reach 100% for PY, BT and SH. Comparing the five molecular families reveals the following trend: CN < NH2 < SH ≈ PY ≈ BT. This sequence may be considered as a measure of the stability of the respective junctions. A more detailed analysis of the different breaking pathways indicates that single molecular junctions with SH, PY and BT
3 4 5 6 7 8 9 10 11 12 13 14 15 16 17 18 19 20 21 22 23 24 25 26 27 28 29 30 31 32 33 34 35 36 37 38 39 40 41 42 43 44 45 46 47 48 49 50 51 52 53 54 55 56 57
termini break with a high percentage in the low conductance state, while NH2 and CN-terminated wires rupture already upon elongation in the high conductance region (see SI for details). This trend represents an additional stability marker of the respective molecular junction.
DFT Calculations and Analysis of Junction Evolution
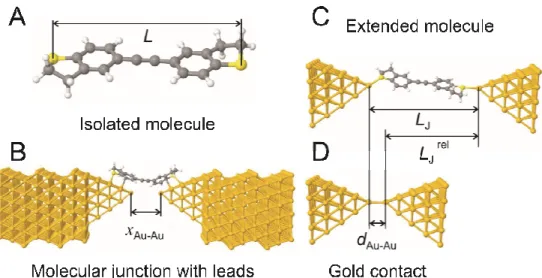
Figure 6. Schematic representation of the “extended molecule” of BT1 in contact with conducting leads. The Figure illustrates the relevant distances and lengths L, xAu-Au, LJ, dAu-Au and LJ rel, which were computed after the DFT-based structure has relaxed. L is the distance from the centre of an anchor atom at one end of the fully-extended isolated molecule to the centre of the anchor atom at the other end. At an arbitrary stage during the theoretical junction stretching, the theoretical electrode separation xAu-Au is defined as the distance between the center of the two gold apex atoms. LJ is defined to be the value of xAu-Au when the junction breaks. The distance dAu-Au 0.25 nm is the electrode separation of a monatomic gold contact, when the junction has the conductance G0. This is the gold-gold distance at which the bond between apex atoms is neither compressed nor stretched. LJ rel is the theoretically estimated relative displacement of a junction containing a fully extended molecule, arising when the zero of relative displacement (∆z = 0) corresponds to an apex-atom separation of dAu-Auand is defined as LJ rel = LJ - dAu-Au (see SI Table S2). Panel B shows the structure of the gold electrodes used in the simulations.
To provide further insight into the experimentally-observed trends and the evolution of molecular junctions, we performed theoretical calculations using a combination of DFT and a non-equilibrium Green’s function formalism. For each of the molecular families, corresponding to the five distinct anchor groups, each junction was regarded as an “extended molecule” composed of a single molecule attached to two (111) directed pyramids of 35 gold atoms. For a junction geometry such as that shown in Figure 6, we defined the electrode separation xAu-Au to be the center-to-center distance between the apex atoms of the two opposing pyramid tips. To generate complete pulling curves for each molecule, fifty initial values of electrode separation (denoted
3 4 5 6 7 8 9 10 11 12 13 14 15 16 17 18 19 20 21 22 23 24 25 26 27 28 29 30 31 32 33 34 35 36 37 38 39 40 41 42 43 44 45 46 47 48 49 50 51 52 53 54 55 56 57
x0Au-Au ) were chosen in increments of 0.04 nm, with the shortest distance approximately equal to the molecular length L minus the thickness of four layers of gold at both sides, i.e. ~ L - 1 nm. For geometry optimization, the first two layers at the base of each pyramid were fixed and the remaining three layers of each pyramid (closest to the molecule) were allowed to relax. Geometry optimization was carried out using the DFT package SIESTA53 (for further details see SI). After geometry optimization the electrode separation changed slightly from the initial value x0Au-Au to a final value xAu-Au.
Binding geometry and binding energies
For each initial tip separation x0
Au-Au, the molecule was positioned with its anchor rings facing the
surface of the pyramids and approximately 0.2 nm away from the local pyramid surface (Figure 6). To avoid artefacts in the geometry optimization due to symmetry, the molecule was initially slightly shifted from the mid-point (0.1 nm) towards one of the electrodes. A selection of these relaxed geometries is shown in Figure 7 for the case of BT4 single-molecule junctions.
To demonstrate qualitatively the energy changes during the stretching process we computed the junction energy EJ, which is defined as the total energy of the relaxed extended molecule (obtained from SIESTA) relative to the total energy of the fully broken junction when the molecule binds only to one of the electrodes (for example BT-VI in Figure 7). We investigated fifty different junction geometries for each oligoyne derivative. Figure 8 displays the junction energies for BT4 plotted against the electrode separation. To compare junction energies of molecules with different backbone lengths we define the quantity xn = xAu-Au - ∆(n-1), where n is the number of triple bonds in the molecule and ∆ = 0.26 nm. The latter represents the change in length of a molecule when n increases by unity. Results for the PY, CN, NH2 and SH families are shown in the SI (Figures S37, S39, S41, S43).
The fact that the plots of a single family, independent on the molecular length, collapse onto a single curve demonstrates that energies are primarily determined by the anchor group and are only weakly dependent on the length of the oligoyne bridge.
3 4 5 6 7 8 9 10 11 12 13 14 15 16 17 18 19 20 21 22 23 24 25 26 27 28 29 30 31 32 33 34 35 36 37 38 39 40 41 42 43 44 45 46 47 48 49 50 51 52 53 54 55 56 57
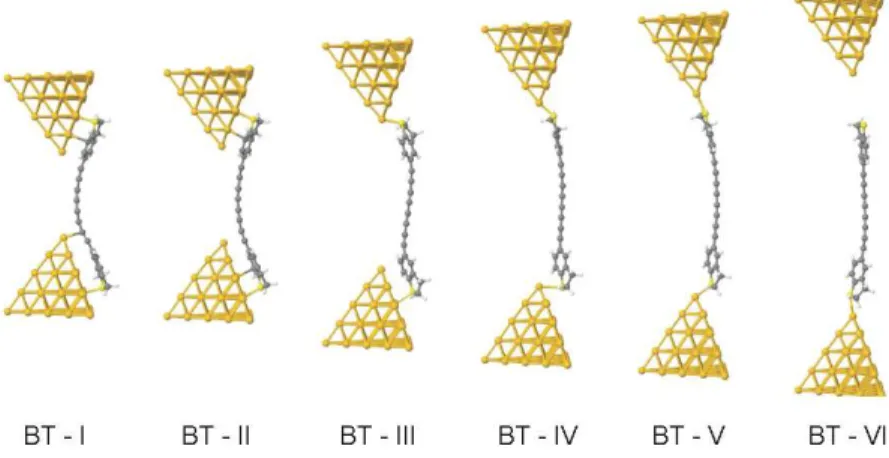
Figure 7. Examples of junction evolution of oligoyne derivatives BT4 showing key configurations.
In all cases, as the anchor group slides across the pyramidal tip (SIDE configurations), the junction energy was found to oscillate as a function of xn, with a period which approximately coincides with the gold layer spacing. In an attempt to quantitatively relate to experiments we computed the binding energies between the molecule and the two gold electrodes using the counterpoise method in (i) the fully broken configuration (for example BT-VI shown in Figure 7), denoted as Eb
VI
, and in (ii) the bridge stage (for example BT-V in Figure 7), denoted as Eb V
(Table 3).
Figure 8. Junction energies for the BT series as a function of the scaled electrode separation xn = xAu-Au - ∆(n-1), where n is the number of triple bonds and ∆ = 0.26 nm, the change in length of a molecule when n increases by unity. 3 4 5 6 7 8 9 10 11 12 13 14 15 16 17 18 19 20 21 22 23 24 25 26 27 28 29 30 31 32 33 34 35 36 37 38 39 40 41 42 43 44 45 46 47 48 49 50 51 52 53 54 55 56 57
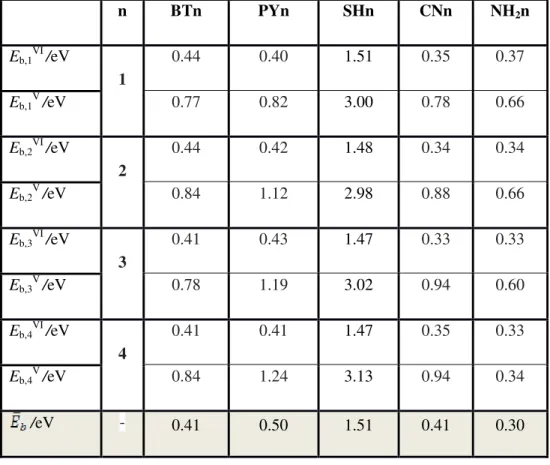
Table 3. Binding energies calculated between a molecule and two electrodes for n=1,2,3,4 cases for two configurations.
n BTn PYn SHn CNn NH2n Eb,1 VI /eV 1 0.44 0.40 1.51 0.35 0.37 Eb,1 V /eV 0.77 0.82 3.00 0.78 0.66 Eb,2 VI /eV 2 0.44 0.42 1.48 0.34 0.34 Eb,2 V /eV 0.84 1.12 2.98 0.88 0.66 Eb,3VI/eV 3 0.41 0.43 1.47 0.33 0.33 Eb,3 V /eV 0.78 1.19 3.02 0.94 0.60 Eb,4 VI /eV 4 0.41 0.41 1.47 0.35 0.33 Eb,4 V /eV 0.84 1.24 3.13 0.94 0.34 /eV - 0.41 0.50 1.51 0.41 0.30
Typically, we find that EbVI is approximately half of EbV because only one of the anchor-gold bond breaks at junction rupture. Across the five anchoring groups we obtained the following trend in the average binding energies Au-N(NH2) < Au-S(BT) ≈ Au-N(CN) ≈ Au-N(PY) << Au-S(SH). The NH2 anchor binds least strongly, due to steric hindrance caused by the amino group hydrogen atoms. If the binding energies are an indicator of the probability of junction formation, then the above results suggest that BT, PY and SH should form junctions with a higher probability than NH2, in agreement with the experimentally observed low junction formation probability for NH2. On the other hand, our experimental findings for the low junction formation probability of CN do not correlate with the theoretically predicted high binding energy of the CN group on gold. This suggests that other factors affect the junction formation, such as competition with solvent molecules and the resilience of an anchor group to defects in the gold leads. Typically we find that the thiol binds with the largest binding energy, although in the calculation we did not cap the molecule with hydrogen after separation from the gold.
3 4 5 6 7 8 9 10 11 12 13 14 15 16 17 18 19 20 21 22 23 24 25 26 27 28 29 30 31 32 33 34 35 36 37 38 39 40 41 42 43 44 45 46 47 48 49 50 51 52 53 54 55 56 57
Junction evolution
We now describe details of junction evolution, movies of which are presented in the SI. Figure 7 shows snapshots of relaxed geometries for BT4. Geometries for PY4,NH24, CN4 and SH4 are shown in Figure S35 of the SI.The initial electrode separations xoAu-Au are: 0.62 nm (PY), 0.905 nm (NH2), 1.132 nm (CN), 0.968 nm (SH) and 0.956 nm (BT). Initially the carbon atoms at opposite ends of the oligoyne chain tend to bind directly to the tip of the gold pyramids. As shown in Figure 7, BT-I is an exception, for which no direct bond between the chain and the gold electrodes was found. Upon increasing the separation xAu-Au the molecules undergo a sequence of sliding configurations during the stretching simulation, with the aromatic rings facing the surface of the gold pyramids, as shown in Figures 7 and S35. When the electrode separation xAu-Au reaches approximately two thirds of the molecular length L the anchor atom on one side jumps to the top position of one pyramidal gold contact while the other end of the molecule continues to slide down the gold surface as before. Examples are BT-III (Figure 7) and NH2-III, PY-III, CN-III, SH-III (SI, Figure S35). In some cases, such as PY-IV, CN-IV, SH-IV (SI, Figure S35), the molecule contorts to bind to atop positions of the gold pyramid. This feature is particularly pronounced for the PY- and CN-end-capped series. As the electrode separation approaches the molecular length L, the molecules jump into the gap and bind to an apex gold atom of both pyramids (BT-V, PY-V, NH2-V, CN-V, SH-V) before the leads are too far apart to bridge, and the junction is broken (BT-VI, PY-VI, NH2-VI, CN-VI, SH-VI).
To relate the experimentally-measured most-probable breaking lengths, zi*, with the theoretically-computed lengths, Table 2 shows the comparison between the experimentally-measured lengths zH*, zL* and the computed length LJ
rel
where LJ rel
is the maximum possible length of a junction containing a fully-extended molecule. The most probable experimental stretching lengths in the high conductance regime, zH*, are smaller than LJ
rel
, whereas the low-conductance values of zL* are approximately equal to LJ
rel
. The average differences zL*- zH* vary between 0.13 nm for PY up to 0.38 nm for SH, and are comparable with the 0.24 nm height of a typical monatomic gold step. Literature reports suggest that strong interactions between contact leads and the anchoring group could cause major rearrangements or even the pulling-out of gold atoms.36,71 The formation of a fully extended molecular junction may also be followed by the creation of intermolecular π-stacking assemblies in the gap.72-73
Comparison of zH*, with LJ rel
(Table 2) demonstrates that in the high-conductance regime, none of the oligoyne derivatives assumes a fully stretched molecular junction between the two gold leads. Based on this comparison between zH*, with LJ
rel
, we propose that the high-conductance region
3 4 5 6 7 8 9 10 11 12 13 14 15 16 17 18 19 20 21 22 23 24 25 26 27 28 29 30 31 32 33 34 35 36 37 38 39 40 41 42 43 44 45 46 47 48 49 50 51 52 53 54 55 56 57
involves SIDE configuration and multi-coordinated sites near the tip of the adjacent gold pyramids. We may distinguish between two groups of oligoynes. The ratio of zH*/LJ
rel
is rather high (> 90%) for molecular junctions composed of PY-, SH- and BT-endcapped derivatives indicating stable, slightly tilted (with respect to a fully upright) configurations. The corresponding ratios of NH2 (< 80%) and CN (< 65%) derivatives are lower. We also notice that junctions formed by longer molecular wires appear to be less stable than shorter ones as indicated by the lower junction formation probability and a lower ratio zi*/ LJ
rel .
Since the values of zL* are comparable with LJ rel
, we suggest that the experimentally observed low conductance states represent junction configurations sampled after the “jump” of the anchor atom on one side of the top position of a gold pyramid while the second atom (anchor group) continues to slide down the gold surface until complete rupture. These regions are depicted by the configurations BT-III (Figure 7) and PY-III, SH-III (Figure S35) and by those samples at larger electrode separations. A low conductance region was also found for the NH2 end-capped oligoynes (Figure 4 and SI), which might indicate that the transition from a SIDE-SIDE into an atop-SIDE junction configuration may take place even at an earlier stage of junction elongation.
Transmission curves and single junction conductances
With the above qualitative understanding of junction evolution in end-capped oligoynes, we discuss next the theoretical transmission curves and electrical conductances. The underlying DFT mean-field Hamiltonian was used to compute the quantum mechanical electron transmission coefficient T(E) via the SMEAGOL package. For such transport calculations the base layers of the pyramids were attached on both sides to eight layers of (111)-oriented bulk gold with each layer consisting of 6 x 6 atoms and a layer spacing of 0.235 nm (Figure 6). These layers were then used to extend the gold electrodes to infinity. Figure 9A shows selected plots of T(E) versus the energy (E-EF) for the BT4. The corresponding plots of T(E-EF) versus (E-EF) for the entire other families of molecules are shown in SI, Figures S36 to S45.
The conductance was then obtained from the electron transmission coefficient T(E) evaluated at the Fermi energy EF multiplied by a scaling factor A (see below). We note that DFT does not usually predict correctly the alignment of the frontier molecular energy levels in the junction relative to the Fermi energy. To overcome this deficiency, self-energy and screening corrections are required.55,74-75 However, these corrections are typically obtained for locally optimal
3 4 5 6 7 8 9 10 11 12 13 14 15 16 17 18 19 20 21 22 23 24 25 26 27 28 29 30 31 32 33 34 35 36 37 38 39 40 41 42 43 44 45 46 47 48 49 50 51 52 53 54 55 56 57
configurations in vacuum between rather flat contacts. These conditions do not match our experimental situation (in solution with either one (STM) or two (MCBJ) pyramid-shaped contacts). The correction depends sensitively on the precise coordination of the bridging gold atom, on the relative strengths of binding to the two gold electrodes and on the position and orientation of the image-charges.75 In view of these uncertainties we adopted the more empirical approach, which involves computing the iT - Vbias characteristics for a range of Fermi energies EF in the vicinity of the DFT-predicted Fermi energy EF
DFT
and adjusting the Fermi energy EF so that DFT-SMEAGOL-computed current-voltage characteristics agree with the experimentally-measured iT - Vbias curves. The method was introduced for tolanes (oligoynes with n = 1) in ref.
36
and is detailed in the SI.
Employing this approach, we estimated the following corrections in EF-EF DFT
: -0.2 eV (BT), -0.65 eV (PY), 0.1 eV (SH), -0.2 eV (NH2) and -1.0 eV (CN) (see SI for details). To obtain a reasonable fit, it was also necessary to multiply the computed electron transmission coefficient by a single common scaling factor A, which accounts empirically for (i) the fact that real electrodes contain defects and (ii) the well-known deficiencies in DFT. The latter include particularly the absence of van der Waals interactions, which could increase the distance between the anchors and the gold electrodes and thereby decrease the conductance relative to the Generalized-Gradient Approximation (GGA) values. Comparing experimental and computed data of the five oligoyne families, we obtained A = 0.10 (see also ref.36). This scaling factor is smaller than that in our previous calculations,36 because we fitted a single scaling parameter to five families of molecules instead to data from only four individual molecules. Furthermore, we also used an improved model for the electrodes in the present work (Figure 6). For the same reason the corrections in EF are slightly modified. The corrections to EF indicate that the transport through molecular junctions of PY- and CN-endcapped oligoynes is due to non-resonant tunneling through the tails of the respective LUMO states. This is in agreement with results reported for related molecules.39,51,55 Transport through junctions with SH, NH2 and BT-termini appears to proceed via the tail of the nearby HOMO state, which is also supported by data obtained with similar molecular wires.48,62,76 We computed single-molecule junction conductances as a function of the electrode separation x Au-Au for the five oligoyne families. The complete set of data including the generated movies illustrating the evolution of the junction configurations and the corresponding transmission functions of the five oligoynes is given in the SI.
3 4 5 6 7 8 9 10 11 12 13 14 15 16 17 18 19 20 21 22 23 24 25 26 27 28 29 30 31 32 33 34 35 36 37 38 39 40 41 42 43 44 45 46 47 48 49 50 51 52 53 54 55 56 57
Figure 9. (A) Scaled transmission curve log(A·T(E)) vs (E-EF) obtained for BT4 at various stages of the stretching process and (B) the corresponding scaled conductance log(G/G0) vs xAu-Au trace (scaling factor 0.10, see text for details). The vertical dotted line in panel (A) marks the shifted Fermi energy EF. The thin horizontal line in panel (B) shows the median of the marked conductance points. The roman-numeral dotted lines in panel (B) correspond to various geometries shown in Figure 7 (BT-I to BT-VI). Panel (C) shows the histogram generated from data plotted in (B).
As an example, Figure 9A displays selected (out of 50) scaled transmission curves of BT4
computed at various stages of the stretching processes. Panel 9B shows the electrical conductances at each electrode separation xAu-Au obtained by evaluating the scaled transmission coefficient A·T(E-EF) at the Fermi energy E = EF. Specific values of log(G/G0) at various stages of the pulling process (Figure 7) are indicated by the vertical dotted lines in Figure 9B. The evolution of the dimensionless junction conductance traces with the electrode separation xAu-Au demonstrates that the conductance generally decreases with xAu-Au and that the lengths of the plateaus increase with molecular length L (Figure 9 and Figures S36, S38, S40, S42 and S44 in SI). Both trends agree with our experimental observations (Figure 1, Figure 4 and Table 2, see also SI). A more detailed evaluation of the computed conductance curves suggests that the fluctuations increase upon approaching the transition from SIDE-SIDE to SIDE-atop configurations of the junction (Figure 7), which could be attributed to the characteristic properties of the high and low conductance regions.
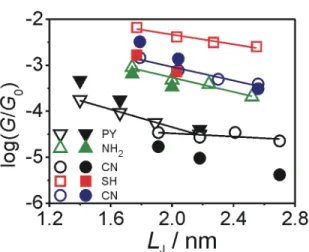
The conductance values plotted in Figure 9B were then used to construct conductance histograms (Figure 9C). The most probable conductance values of the high conductance state log(G/G0) for each family of molecules are plotted as a function of LJ in Figure 10. The slopes of these curves yield the computed values βΗcomp (BT)= 1.7 nm-1, which is slightly smaller than the experimental values βH(BT)= (2.9 ± 0.2) nm -1 (Table 1, Figure 4). 3 4 5 6 7 8 9 10 11 12 13 14 15 16 17 18 19 20 21 22 23 24 25 26 27 28 29 30 31 32 33 34 35 36 37 38 39 40 41 42 43 44 45 46 47 48 49 50 51 52 53 54 55 56 57
Figure 10. Plot of the most probable experimental (full symbols) and computed (open symbols and lines) conductance values log (G/G0) versus the characteristic junction length LJ for each family of molecules.
The plots of log(G/G0) versus LJ for the other oligoyne families are shown in Figure 10, and yield the following computed βΗvalues for the high conductance regions: βH
comp (PY) = 2.2 nm-1, βH comp (NH2)= 1.8 nm -1 , βH comp (SH) = 1.2 nm-1 and βH comp
(CN) = 0.4 nm-1. The trends in the computed conductances are in qualitative agreement with experimental data although the theoretical βH
comp
values are consistently smaller than the experimental ones. Within the present theory of phase-coherent tunneling, the latter is a reflection of the well-known tendency for DFT to underestimate the size of the HOMO-LUMO gap, which leads to an underestimation of the decay rate of the transmission coefficient with length. Furthermore, the theoretical calculations were performed in vacuum, whereas the experiments were carried out in the presence of solvent. In the case of NH2 and thiol-terminated oligoynes differences may also arise, because estimates of
βH(NH2) andβH(SH) arebased on only two experimental conductance values (n = 1, 2). We also note that the binding energies and transport calculations do not explain the experimentally-observed lower stability of the CN-terminated molecular junctions as compared to those with PY anchors.
In contrast with the theoretical pulling curves, which contain rather flat plateaus, the experimental conductance-trace curves tend to decrease during stretching. This difference is likely to arise, because the shape of the tip is unknown and is modelled theoretically as a regular pyramid. In practice, other shapes may arise. The presence of a solvent may also tend to displace the molecule, particularly at longer separations. Furthermore in the simulations, the Fermi energy is assumed