Florida Seagrass Manager’s Toolkit
Florida Fish and Wildlife Conservation Commission Florida Marine Research Institute
100 Eighth Avenue SE St. Petersburg, FL 33701-5095
Florida Seagrass Manager’s Toolkit
A publication of the Florida Fish and Wildlife Conservation Commission funded in part by the Florida Department of Environmental Protection, Florida Coastal Management Program, pursuant to National Oceanic and Atmospheric Administration award number NA17OZ2330 with additional support from the Federal Aid in Sport Fish Restoration Program. The views expressed herein are those of the authors and do not necessarily reflect the views of NOAA, DEP or their sub agencies.
Contents
List of Tables ...ii
List of Figures ...ii
Acknowledgments...iii
Preface Objectives...iv
Intended audience ...iv
Document format ...iv
Chapter 1. Introduction Florida’s seagrass species ...1
Importance of seagrass habitats ...4
Importance of effective seagrass management ...5
Defining and addressing management issues ...7
The importance of spatial scale...10
Chapter 2. Mapping and Monitoring Tools Background ...11
Sources of imagery, mapping, and related data ...11
Sources of monitoring data ...16
Chapter 3. Protection and Restoration Tools Background ...19
Public education and outreach ...19
Water quality management ...21
Management of boating impacts...24
Permitting of dredge and fill and other construction activities ...32
Chapter 4. Replanting and Other Damage-Repair Tools Planting ...34
Stimulating regrowth in damaged areas...36
Chapter 5. Some Emerging Issues ...39
References and Suggested Reading ...42 Appendix A. Regions of Florida containing significant seagrass resources... A-1 Appendix B. Seagrass distribution within local regions ... B-1 Appendix C. What is dredge and fill?... C-1 Appendix D. Permitting a single family dock ... D-1
List of Tables
Table 1. Problem-solving process ...7
Table 2. Recent API-based seagrass mapping programs ...14
Table 3. Florida seagrass monitoring programs...17
List of Figures Figure 1. Seagrass species occurring in the shallow coastal waters of Florida ...2
Figure 2. Regional extent of Florida’s nearshore seagrass beds, 1995 ...3
Figure 3. Problem-solving flowchart for resource management issues ...9
Figure 4. Target-setting process used in management of Tampa Bay nitrogen loads ...22
Acknowledgments
This report was prepared for the Florida Fish and Wildlife Conservation Commission by Gerold Morrison (Environmental Protection Commission of Hillsborough County).
Thanks are extended to Kim Barry, Nancy Diersing, Mark Fonseca, Lauri MacLaughlin, Mary Tagliareni, and Fritz Wettstein (National Oceanic and Atmospheric Administration); Seth Blitch (Florida Department of Environmental Protection); Bob Day and Robert Virnstein (St. Johns River Water Management District); Nick Ehringer (Hillsborough Community College); Eric Fehrmann (Pinellas County Department of Environmental Management); Holly Greening (Tampa Bay Estuary Program); Roger Johansson (City of Tampa); Graham Lewis (Northwest Florida Water Management District); Robin Lewis (Lewis Environmental Services, Inc.); Gary Milano (Miami-Dade County Department of Environmental Resources Management); Ron Phillips (FMRI); Thomas Ries (Scheda Ecological Associates, Inc.); Dave Tomasko (Southwest Florida Water Management District); and Pat Wells (Florida Department of Environmental Protection) for providing guidance, information and advice during the preparation of this document, and to the authors of the Sargent et al. (1995) and Stowers et al. (2002) studies for kind permission to reproduce maps and other graphics.
PREFACE Objectives
This Toolkit addresses a broad set of topics – protecting and restoring Florida’s seagrass resources. A large amount of information is available on these topics, and the biggest challenge in assembling the Toolkit has been to limit the document to a manageable size. The material chosen for inclusion was selected to meet the project’s two main objectives:
• To help readers identify and define the seagrass management issues they face; and • To provide an introduction to some of the management practices that are available for
addressing those issues.
A large number of technical publications are available that, while not directly applicable to management-related objectives, are valuable sources of background information and technical insights. Due to space constraints only a few of these publications could be discussed in the text. Several are noted in the References and Suggested Reading section that begins on page 36. Interested readers are encouraged to view this document as a small tip of a very large iceberg, and explore the broader literature on seagrass ecology, physiology and management to the greatest extent possible. The technical literature is the best available source of detailed,
comprehensive knowledge that seagrass managers need to keep their skills and understanding up to date.
Intended Audience
This Toolkit is written for resource managers and other professionals directly involved in seagrass management, and for decision- makers and citizens who have an interest in the subject.
Document format
The Toolkit consists of five chapters:
1. Introduction
Describes the ecological importance of Florida’s seagrass habitats and the need for effective management. Outlines a basic problem-solving model that can be used to identify and develop appropriate responses to resource management issues. Discusses the importance of spatial and temporal scale in seagrass management.
Section 2. Mapping and Monitoring Tools
Describes the types and sources of mapping and monitoring data that are available to support seagrass management efforts in Florida.
Section 3. Protection and Restoration Tools
public education and outreach programs, community-based resource management programs, and traditional regulatory programs such as permitting of dredge and fill and dock
construction projects on sovereign submerged lands.
Section 4. Replanting and Other Damage-Repair Tools
Describes some methods currently being used to restore seagrass habitats on relatively small spatial scales, to repair damage caused by propeller scars, vessel groundings, and other localized anthropogenic impacts.
Section 5. Some Emerging Issues
SECTION 1. INTRODUCTION Florida’s Seagrass Species
Seagrasses are a relatively small group of flowering plants that have adapted to survive and reproduce in the marine environment. They are present in all coastal states of the U.S., with the exception of Georgia and South Carolina where a combination of freshwater inflows, high turbidity and tidal amplitude restricts their occurrence (Thayer et al. 1997). The three most abundant species in Florida’s nearshore waters are Thalassia testudinum, Syringodium filiforme, and Halodule wrightii (Zieman and Zieman 1989).
Thalassia testudinum (“turtle grass”) is our largest seagrass species, with long strap-shaped leaves and robust rhizomes (Fig. 1). In the marine environment extensive meadows are usually dominated by this species, in combination with Syringodium filiforme. Syringodium (“manatee grass”) can be distinguished by its cylindrical leaves which, because they are brittle and buoyant, are frequently broken off from the parent plant and dispersed widely by winds and currents.
Halodulewrightii (“shoal grass”) has flat, narrow leaves and a shallow root system. It is thought to be an early successional species in the development of seagrass beds in the Gulf and
Caribbean, and is a dominant species in many estuarine environments. Halodule is able to survive more frequent and prolonged exposure during periods of low tide, and is often the predominant species at the shallow-water fringe of large meadows. In some areas Halodule also dominates the deep-water edge of many meadows, and in some cases may exhibit different growth forms in the two depth zones (Zieman and Zieman 1989).
Three additional species (Halophila engelmannii, Halophila decipiens, and Halophila
johnsonii) are also found in Florida’s coastal waters. Halophila engelmannii is often present in meadows dominated by Thalassia and Syringodium, but also occur in deeper areas where these species are absent (Iverson and Bittaker 1986). H. decipiens has been found at depths of up to 90 m near the Dry Tortugas (Zieman 1982), and forms single-species stands (to depths of 20 m or more) beyond the deep edge of the extensive Thalassia/Syringodium meadows in the Big Bend region (Zieman and Zieman 1989). Halophila johnsonii is a relatively newly-described species that is morphologically similar to H. decipiens (Eiseman and McMillan 1980). Because of its highly restricted geographic range (northern Biscayne Bay to Sebastian Inlet, on Florida’s east coast), and potential vulnerability to extinction due to chance disturbance events, H. johnsonii
has recently been listed as a threatened species (NMFS 2000).
A seventh species, Ruppia maritima (widgeon grass), is a euryhaline plant that is common in fresh water habitats. In the marine environment it occurs primarily in low-salinity areas, where it can easily be confused with Halodule. In a sense Ruppia may be considered a freshwater plant that is capable of tolerating saline conditions, rather than a true seagrass (Zieman 1982).
Figure 1. Seagrass species occurring in the shallow coastal waters of Florida (from Sargent et al. 1995, based on drawings by Mark D. Moffler).
Figure 2. Regional extent of Florida’s nearshore seagrass beds (Source: Sargent et al. 1995).
The distribution of seagrasses in Florida’s coastal waters (Fig. 2) are affected by a number of environmental factors, including water temperature, water clarity, salinity, tidal current
velocities, wave energy, and the physical and chemical characteristics of sediments. Livingston (1990) gives the following statewide overview:
“Turtle grass (Thalassia testudinum) is temperature- limited and does not occur along the northeast Florida coast. The northward limit of Syringodium filiforme
and Halophila engelmanii is the Indian River west of Cape Canaveral. Shoal grass (Halodule wrightii) and widgeon grass (Ruppia maritima) appear in various inlets along the Florida east coast. Farther south, from Biscayne Bay to the Dry Tortugas, turtle grass forms extensive beds. Along the western Gulf coast, in the region from Tarpon Springs to Cape Romano, sea grasses are found primarily inside of barrier islands, though there is little such development in the Ten Thousand Islands area. The most diverse associations of sea grasses and marine algae in the Gulf of Mexico are found off the southwest coast of Florida. Two of the most extensive sea grass beds in continental North America occur along the southwest and north Florida Gulf coasts. Coverage in Florida Bay approximates 5000 km2, while the beds lining the north Florida Gulf coast (Apalachee Bay) cover 3000 km2. The northern beds form an almost continuous band, from 10 to 35 km wide, at depths from 1 to 5 m. Scattered beds occur along inshore areas of the northwest Florida (Panhandle) coast.”
Importance of Seagrass Habitats
Seagrass meadows are among the most productive ecosystems on earth, performing a number of critically important ecological functions (Thayer et al. 1997). They represent one of Florida’s most valuable estuarine and marine habitats, whose ecological and economic importance rests on a number of factors (Zieman and Zieman 1989):
• high productivity and growth: seagrass plants are capable of very rapid growth (e.g., leaf growth rates up to 5 mm per day) and high levels of primary productivity;
• food and feeding pathways: the organic matter produced by seagrasses can follow either of two pathways through estuarine and marine foodwebs: direct grazing by herbivorous animals; or consumption of the detritus formed by decaying seagrass material;
• shelter: seagrass meadows serve as critically important “nursery areas” for the immature stages of many commercially and recreationally important fish and shellfish species, including pink shrimp (Farfantepenaeus [formerly Penaeus] duorarum), stone crab (Menippe mercenaria), blue crab (Callinectes sapidus), bay scallop (Argopecten irradians), spotted sea trout (Cynoscion nebulosus), red drum (Sciaenops ocellatus), striped mullet (Mugil cephalus), common snook (Centropomus undecimalis), and in the southern part of the state, several species of snappers and grunts (Livingston 1990; Zieman and Zieman 1989).
• habitat stabilization: seagrasses stabilize sediments in two ways —the leaves and plants reduce wave energy and current velocities near the sediment-water interface, allowing sedimentation of suspended particles and inhibiting sediment resuspension; and roots and rhizomes form an interlocking matrix that helps to retard scouring and erosion; and • nutrient dynamics: seagrasses produce detritus, promote sedimentation and provide
organic material to the sediments, helping provide a conducive environment for nutrient recycling.
Seagrass habitats are subject to a number of natural and manmade disturbances including storm scour, uprooting and overgrazing by animals, infection by pathogens and parasites, stress due to water quality degradation and reduced water clarity, physical impacts from dredge and fill operations, prop dredging, vessel wakes and groundings, and physical and toxicological impacts due to spills of oil and other toxic materials. Regardless of the cause, reductions in the quantity or quality of seagrass habitats can have a number of negative environmental impacts including reduced primary and secondary productivity, reduced habitat availability for fish and shellfish, and increases in shoreline erosion, sediment mobility, and water column turbidity (Thayer et al. 1997).
Importance of Effective Seagrass Management
In addition to their ecological and aesthetic value, seagrass meadows are critically important habitats for a large number of fish and shellfish species, many of which support economically important commercial or recreational fisheries. Several protected species, including green sea turtles and West Indian manatees, also rely on seagrass meadows as feeding and resting sites. Without successful management these habitats can be damaged or lost.
In recent decades researchers and managers have documented regional declines in seagrass abundance in many parts of the world. Kemp (2000) gives the following summary:
“The geographical scope of this trend is staggering, and most of these declines appear to be related to human- induced disturbances, many of which are related to reductions in light available for plant photosynthesis…
Major epicenters for seagrass losses are adjacent to areas of dense human habitation, including Europe…Australia...and North America. At local scales, seagrass losses have been attributed to dredging for maintenance of navigational channels…harvest of shellfish…discharges of silt… turbidity plumes…and scouring associated with motorboat propellers…and boat moorings.
Although significant temporal changes in seagrass growth may be related to hydrologic changes associated with natural climatologic cycles… human manipulations of regional hydrology may also be (at least partially) responsible for recent massive reductions in seagrass abundance.”
Seagrass losses have also been documented in Florida’s nearshore waters. Losses due to discharges of thermal effluents from electric power plants have occurred in Crystal River, Biscayne Bay, and in the vicinity of Key West (Fonseca et al. 1998). In the Indian River Lagoon, seagrass acreage declined by about 18% between the early 1940s and the early 1990s, primarily in areas adjacent to highly developed shorelines and uplands (Virnstein 1999). In the greater Charlotte Harbor area—which includes San Carlos Bay, Pine Island Sound and Matlacha Pass, as well as Charlotte Harbor proper—Harris et al. (1983) estimated that a 29% decline in seagrass acreage occurred between1944 and 1982, largely associated with coastal construction activities. In Sarasota Bay an estimated 30% acreage decline, associated with coastal
construction and water clarity reductions, is thought to have occurred over roughly the same period (Tomasko et al. 1996).
A dramatic instance of seagrass decline began in western Florida Bay during the summer of 1987 (Hall et al. 1999). Seagrasses in the bay were apparently subjected to decreased light availability due to widespread, persistent microalgal blooms and resuspended sediments. Bay-wide surveys carried out in 1984 and 1994 indicated that the biomass of turtle grass, manatee grass, and shoal grass declined by 28%, 88%, and 92%, respectively, during that 10- year period. The spatial patterns of seagrass loss suggested that chronic light reductions and “die-off” (rapid, unexplained plant mortality) were the most likely causes for decline. Although the loss rate has slowed considerably in recent years, die-off has continued in parts of the bay. Hall et al. (1999) noted that “if die-off and persistent water-column turbidity continue in Florida Bay, the long-term future of seagrasses in the bay is uncertain.”
In Tampa Bay approximately 46% (18,400 acres) of the existing seagrass beds were lost between 1950 and 1982, due to the combined effects of dredging and water pollution (Haddad 1989). Acreage losses in Tampa Bay over longer time periods are difficult to estimate, due to the sparseness of data from the years prior to 1950, but may have been as large as 81% (Lewis et al. 1991).
Between 1982 and 1997 Tampa Bay regained approximately 5,160 acres of seagrass, apparently in response to management efforts that led to reduced nutrient loads and increased water clarity. Reduced nutrient loads and increased seagrass acreage were also observed in Sarasota Bay during the same period. Seagrass acreage then declined in both estuaries,
apparently in response to the heavy rainfall and increased river flow and stormwater runoff that occurred during the 1997-1998 El Niño event (Johansson 2002a). Seagrass acreage increased once again in Tampa Bay during the 1999-2002 mapping period, as water clarity improved during the relatively dry years that occurred following the cessation of the 1997-1998 El Niño event. During this period the total mapped acreage in the bay increased by 1,237 acres, to 26,078 acres. In Sarasota Bay the total mapped acreage declined slightly between 1999 and 2002, from 11,850 acres to 11,703 acres. Seagrass “thickening” occurred in both estuaries during the 1999-2002 mapping period, through a net increase in the acreage of “continuous” (as opposed to “patchy”) beds in both areas (D. Tomasko pers. comm.).
Taken together, the seagrass acreage trends seen in west-central Florida recent decades appear to offer grounds for cautious optimism. “Cautious” because of the declines that have been seen
in so many areas, and “optimism” because of the evidence that those trends can be reversed—in some areas, at least—by sound management actions.
Defining and Addressing Management Issues
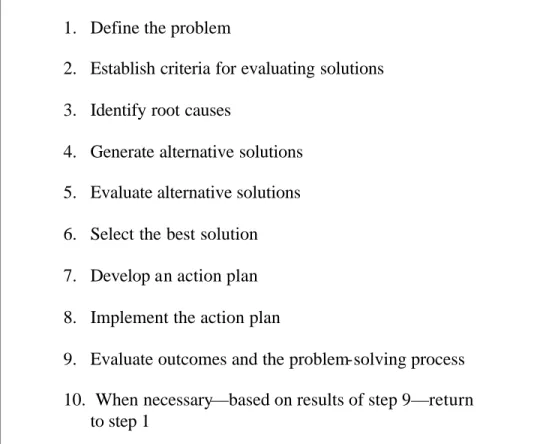
Resource managers are primarily problem-solvers, working with stakeholder groups to “identify and close the gap between some desired situation and the current situation” (Schwarz 1994). Managers who approach problem-solving in a methodical way are more likely to develop workable solutions. The basic approach shown in Table 1 is a commonly- used model for
problem identification and resolution.
Table 1. Basic problem-solving model. (Source: Schwarz 1994)
1. Define the problem
2. Establish criteria for evaluating solutions 3. Identify root causes
4. Generate alternative solutions 5. Evaluate alternative solutions 6. Select the best solution 7. Develop an action plan 8. Implement the action plan
9. Evaluate outcomes and the problem-solving process 10. When necessary—based on results of step 9—return to step 1
The initial step—defining the problem—is often the most critical. Before addressing it, it is often helpful for environmental resource managers to separate their project areas into two categories:
• Restoration sites, where significant anthropogenic impacts have already occurred and a consensus exists supporting efforts to restore some or all of what has been lost; and • Protection sites, where the primary issue is resource protection and the prevention of
After restoration and protection sites have been distinguished, the problem- identification step can be applied separately to each area.
Whenever possible, the “problem” should be identified quantitatively and in terms of a desired outcome (NRC 2000). For restoration areas the problem description could be phrased in terms of the gap between the existing and desired situations, for example:
“Since 1980 seagrass acreage in Mud Bay has declined from 100 acres to 50 acres. Consensus exists for restoring the acreage back to at least 90% of its 1980 value.”
For protection sites the problem can usually be stated in terms of the existing situation that needs to be maintained, for example:
“Mud Bay currently contains 50 acres of grassbeds containing a mix of Thalassia, Syringodium and Halodule. Consensus exists for maintaining this acreage and species mix from any reductions caused by anthropogenic impacts.”
Phrasing the problem in this way is also helpful in the second step of the process—establishing criteria for evaluating solutions—because it ensures that quantitative evaluation criteria will be incorporated in the problem-solving process.
Subsequent steps are self-explanatory, and are described in detail in a number of publications addressing problem solving and group facilitation (e.g., Schwarz 1994). A summary of the approach is shown in flowchart form in Figure 3.
Establish quantitative, consensus-based management goals are goals currently being met? No Yes Conservation Track Restoration Track develop/refine conservation strategy implement strategy perform regular monitoring and assessment develop/refine restoration strategy implement strategy perform regular monitoring and assessment making satisfactory progress toward goals? Yes No
The Importance of Spatial Scale
Seagrass management involves a number of spatial and temporal scales, and different approaches are needed to address the issues that arise on different scales. Virnstein (2000) provides the following examples, drawn from experience in the Indian River Lagoon:
Large-scale approaches
• mapping and monitoring: mapping based on remote sensing data, producing maps of seagrass extent at a waterbody-wide or regional scale. (At these scales, beds smaller than ½ to 1 acre may not be mapped, and the “deep edge” of a bed may be mapped with an error of tens to hundreds of yards). Monitoring focused on ground-truthing remote sensing data and maps produced using those data.
• management: based on large-scale seagrass depth and water clarity targets, developed using a weight-of-evidence approach drawing on the best available information (e.g., historical aerial photography; monitoring of transects in apparently un- impacted or minimally- impacted [“healthy”] areas).
Medium (meso) to small-scale approaches
• mapping and monitoring: mapping based on data obtained from multiple transects randomly placed along a section of shoreline, allowing statistical estimates of seagrass acreage (or percent cover) to be developed for the entire sampling area. Monitoring focused on describing and detecting changes in the local depth distribution, density and species composition of existing seagrass beds.
• management: based on large-scale seagrass depth and water clarity targets, scaled down as necessary for applicability to local segments of the water body or region.
Site-specific (micro) scale approaches
• mapping and monitoring: mapping based on grid-based techniques, with resolutions as fine as 1 m2, for mapping individual seagrass beds. High- frequency (e.g., daily to continuous) monitoring of light and light attenuation. Weekly monitoring of water quality. Quarterly monitoring of seagrass density, biomass, productivity and epiphyte load within individual beds using fixed transects.
• management: based on an understanding of empirical relationships between factors such as light attenuation, turbidity, epiphyte loads, and seagrass density and biomass at the site level.
In principle, the problem–solving approaches described in Table 1 and Fig. 3 are helpful in addressing management issues arising on each of these spatial scales. In practice, though, careful and conscientious use of these tools is usually most important at the larger (e.g.,
waterbody to regional) scales, where managers are working with a variety of stakeholder groups to identify and then achieve consensus-based goals. Once management goals and strategies have been developed for the larger scales, actions needed at the smallest scales are often obvious within the larger-scale framework. For example, use of the replanting techniques and other restoration tools to repair damage to individual seagrass beds caused by propeller scars, vessel groundings, or other localized impacts (described in Chap. 4 below) will not, in most cases, require a conscious application of the approaches shown in Table 1 and Figure 3.
SECTION 2. MAPPING AND MONITORING TOOLS Background
Mapping and monitoring data, providing information on the acreage, species composition, condition, and spatial and temporal variability of seagrass habitats, play a critically important role in the management process. This type of assessment information is needed in several stages of the problem-solving approach outlined in Section 1:
• discriminating between conservation and restoration areas, and defining the underlying “problem” that will be addressed by a management effort;
• developing appropriate management goals; and
• evaluating the effectiveness of management strategies and actions.
Assessment information is also needed to evaluate localized impacts to seagrass habitats caused by human activities (such as vessel grounding or propeller scarring incidents), to estimate the ecological and economic costs associated with those impacts, and to assess the success of habitat restoration projects that are carried out to mitigate or ameliorate those impacts (e.g., Fonseca et al. 2000).
If adequate funding can be obtained to support them, long-term mapping and monitoring data are a particularly helpful component of coastal management programs, allowing analysts to detect trends in acreage, condition or species composition and determine the magnitude and extent of trends that are observed (e.g., Hall et al. 1999). When combined with long-term water quality data, long-term assessment data can also provide helpful insights into potential
mechanisms driving observed seagrass trends (e.g., Johansson 2002a).
Assessments of acreage and condition have traditionally been carried out using a combination of aerial photography and on-site monitoring (e.g., Virnstein 1992, Ries 1992, Tomasko 1992, Hall 1992, Orth 1992), and these continue to be the primary methods available to managers. Research is currently underway on a variety of remote sensing techniques (e.g., Kovach et al. 2002, Sabol et al. 2002), one or more of which will presumably become available for regular use in seagrass management programs in the near future.
In addition to selecting appropriate mapping and/or monitoring techniques, managers undertaking an assessment effort must also consider the spatial and temporal scales on which data will be collected.
Sources of imagery, mapping and related data
During the past several decades, aerial photographs and seagrass coverage maps based on digitized photographic images—an approach known as aerial photographic interpretation
pubic-domain sources of historical and recent seagrass distribution maps, and other information on seagrass status and trends, include:
Federal agencies
• NOAA Coastal Services Center, Benthic Habitat Mapping program (http://www.csc.noaa.gov/crs/bhm)
Provides benthic habitat maps of Apalachicola Bay, Estero Bay, Florida Bay, Florida Keys, Indian River Lagoon, and deep seagrass beds on Florida’s West Continental Shelf. Data are georeferenced and validated. The files are provided to the user in ARC/INFO® Export or ArcView® Shapefile format. All files are zipped, using PKZIP®, for quicker downloading. Each zip file contains the polygon files and the Federal Geodetic Data Committee (FGDC) compliant metadata file. Projection and datum information, as well as classification system, are included in the metadata records.
• USGS National Wetlands Research Center (http://sdms.nwrc.gov/pub.metrec.html)
Downloadable GIS maps of Apalachee Bay SAV (1992), Choctawhatchee Bay SAV (1992), Florida Panhandle coastal habitats (1996), Pensacola Bay SAV (1960’s, 1992), Saint Andrew Bay, and Tampa Bay habitats (1956, 1972, 1982).
State and regional agencies
• Florida Marine Research Institute (FMRI) (http://floridamaine.org/seagrass)
GIS maps, data, technical reports and public education/outreach products. • Southwest Florida Water Management District (SWFWMD)
(http://www.swfwmd.state.fl.us/data/dataonline.htm)
Downloadable GIS maps showing seagrass acreage in Clearwater Harbor, Tampa Bay, Sarasota Bay, Lemon Bay and Charlotte Harbor for time periods between 1988 and 1999.
Universities
• Florida Institute of Technology
(http://probe.ocn.fit.edu/SAVproject/SAV.html)
Description of development of protocol to use hyperspectral imagery to map seagrass. • Florida International University
(http://serc.fiu.edu/seagrass/!CDreport/DataHome.htm) Seagrass monitoring data from the Florida Keys
• University of Miami
(http://library.miami.edu/netguides/environ_fla.html)
Links to sites that provide data and background information on Florida habitats and resource management issues.
Non-governmental organizations
• ESRI Conservation Program Resources
(http://www.conservationgis.org/links/marine2.html)
Links to sites that provide data and background information on national resource management issues.
Private-sector entities—primarily utilities and other companies operating industrial facilities with permitted discharges to nearshore waters—have also funded seagrass mapping efforts from time to time. Depending on company policies and the purpose and scope of the mapping effort, the resulting images and maps may be made available to researchers and resource managers.
Table 2. Recent API-based seagrass mapping programs (source: FMRI). For regularly- updated statewide information on mapping programs employing API and other methods (e.g., transects, acoustic sensors), visit the seagrass projects inventory section of the FMRI website at
http://www.floridamarine.org. Area Time Period Data Sources Perdido Bay 1940 — 1987 1992 USGS USGS Pensacola Bay 1961 1992 USGS USGS Gulf Islands National Seashore
1956 — 1987 1999 USGS USGS Choctawhatchee Bay 1992 USGS
St. Andrew Bay 1992 USGS
St. Joseph Bay 1992 USGS Apalachicola Bay 1992 USGS Big Bend/Springs Coast region
1984 1992 1999 MMS/USGS/FMRI USGS SWFWMD St. Joseph Sound Clearwater Harbor Tampa Bay 1999 – present 1999 – present 1950 — 1982 1988 — present SWFWMD SWFWMD FMRI SWFWMD Sarasota Bay 1988 1994 — present SWFWMD Charlotte Harbor 1988 1992 — present SWFWMD
Pine Island Sound/ Matlacha Pass 1982 1999 FMRI SFWMD/ FMRI Estero Bay 1990 planned FMRI
Rookery Bay NERR
Table 2 (cont.) Area Time Period Data Sources Ten Thousand Islands/ Rookery
Bay 1987 USGS Keys/Florida Bay 1992, 1995a NOAA/FMRI Biscayne Bay 1991 1997 FMRI
National Park Service Lake Worth
1990 2001
Palm Beach County Palm Beach County Hobe Sound
1996-present SFWMD Indian River Lagoon
1986-present SJRWMD/SFWMD St. Johns River 1999 SJRWMD a
Sources of monitoring data
In Florida, monitoring of seagrass condition has been done in relatively localized areas such as individual bays, estuaries, parks or other management units rather than on a regional or statewide scale. The projects have typically been carried out by local governments, water management districts, or state or federal resource management agencies. A listing of some recent monitoring efforts, compiled by FMRI staff, is provided in Table 3.
The designs of local monitoring programs vary depending on their objectives (e.g., Avery 2000, 2002). Careful thought must be given to the design of any monitoring effort—before it is undertaken—to ensure that the data collected will be appropriate and adequate to address the management questions of interest. Information on the statistical aspects of monitoring program design is available from a number of sources (e.g., Cochran and Cox 1957, Cochran 1977, Gilbert 1987). The U.S. EPA has provided guidance on the design of estuarine water quality monitoring programs (EPA 1991). Two recent symposium volumes (Bortone 2000, Greening 2002) include extensive discussions of seagrass monitoring programs that have been or are currently being conducted in various parts of Florida.
Most recent seagrass monitoring programs have included one or more of the following components:
• seagrass species composition • shoot density
• shoot morphology • standing crop • productivity
• epiphyte loads (e.g., species composition, biomass) • water quality (hydrographic and chemical parameters) • water transparency
• light attenuation/PAR
• water depth (e.g., at deep edge of seagrass bed)
In addition to these frequently- monitored parameters, topics of emerging interest in recent years have included the presence/absence of plant pathogens such as Labyrinthula sp. (Blakely 2002) and the potential effects that sediment chemistry (Carlson et al. 2002) on the distribution and abundance of individual seagrass species.
Table 3. Recent seagrass monitoring programs (source: FMRI). For regularly- updated statewide information, visit the seagrass projects inventory section of the FMRI website at
http://ww.floridamarine.org. Area Initiation Date Data Sources Perdido Bay
Pensacola Bay System
1997 2000 2001 U.S. EPA FDEP
Escambia County, Dept. Parks and Recreation Choctawhatchee Bay St. Andrew Bay 2000
Gulf Coast Community College St. Joseph Bay
Apalachicola Bay
Big Bend/Springs Coast region 1996 1998 FDEP/CAMA SRWMD St. Joseph Sound 1998
Pinellas County, Dept. Environ. Mgmt. Tampa Bay 1997 1997 1998
City of Tampa/Bay Studies Group Manatee County, Environ. Mgmt. Dept. Pinellas County, Dept. Environ. Mgmt. Sarasota Bay 1997 SWFWMD Lemon Bay 1998 FDEP/CAMA Charlotte Harbor 1998 FDEP/CAMA Pine Island
Sound/Matlacha Pass/ San Carlos Bay/ Caloosahatchee River/ Estero Bay 1998 1999 2002 FDEP/CAMA SFWMD FDEP/CAMA Rookery Bay 1998
FDEP/CAMA; Rookery Bay NERR Ten Thousand Islands
1998
Florida International University
Table 3 (cont.) Area Initiation Date Data Sources
Florida Bay & Florida Keys 1989 1993 1999 1995 Univ. Virginia Miami-Dade County NOAA/USF/FMRI
Florida International University Biscayne Bay 1985 Miami-Dade County Lake Worth 1999
Palm Beach County Hobe Sound
1998
Loxahatchee River Environmental Control District
Indian River Lagoon
1983 1994 2001 SJRWMD SJRWMD/SFWMD NMFS/FMRI St. Johns River 1983 1994 DYNAMAC SJRWMD
SECTION 3. PROTECTION AND RESTORATION TOOLS BACKGROUND
Existing seagrass beds can be impacted by a variety of human activities. During the past several decades in Florida the activities causing the most widespread seagrass losses appear to have been:
• excessive discharges of nutrients/sediment to rivers and estuaries, from a variety of point and non-point sources, leading to eutrophication, reductions in water clarity, and large-scale reductions in seagrass acreage due to reduced light availability; and
• dredge-and-fill projects carried out on submerged lands, causing the physical removal or burial of seagrass meadows and other aquatic habitats during the construction of waterfront subdivisions, causeways, jetties, wharfs, and other large water-related structures.
As these large-scale impacts have been controlled more effectively, the more localized effects of other activities have become more evident, particularly in local areas that have experienced large increases in residential construction and recreational and commercial boating traffic:
• prop dredging, the inadvertent or intentional operation of power boats in shallow seagrass areas, produced “prop scars” or unvegetated channels through the beds.
• dock construction, which can reduce the light available for seagrass growth, particularly in areas where numerous docks have been built to accommodate new residential or recreational users.
The following section describe several approaches that have been used in different parts of the state to provide better management of these activities and reduce their negative impacts on seagrass habitats. The topics are covered in order of increasing regulatory involvement, from a completely voluntary public outreach program in the Florida Keys, to a largely voluntary water quality management program that is currently in use in Tampa Bay, to the partially voluntary/ partially regulatory management of boating activities in many portions of the state, to the completely regulatory management of dock construction and coastal dredge and fill activities.
PUBLIC EDUCATION AND OUTREACH Case Study: Florida Keys
The Florida Keys region contains over 1.4 million acres of seagrass — one of the largest seagrass communities in the world. In addition to their ecological value, these habitats play an important role in the local economy, supporting water-related tourism and recreation and valuable commercial and recreational fisheries for shrimp, blue crab, stone crab, spiny lobster, yellowtail snapper, and gray snapper.
The Seagrass Outreach Partnership is a group of education/outreach professionals, resource managers and other concerned organizations who joined together to plan an
education program highlighting the status of seagrass habitats in the Keys. Members include the Coral Shores High School Marine Studies Class, Florida Department of Environmental
Protection/Office of Coastal and Aquatic Managed Areas, Everglades National Park, Florida Fish and Wildlife Conservation Commission/Florida Marine Research Institute, Florida Keys Guides Association, Florida Keys National Marine Sanctuary, Florida Park Service, Monroe County Cooperative Extension Service/4-H Program, Monroe County/Department of Marine Resources, Ocean Conservancy, U.S. Fish and Wildlife Service/Florida Keys National Wildlife Refuges, University of Florida/Sea Grant Extension, and World Wide Sportsman. The member organizations are working to assess the state of seagrass health, threats to seagrass communities, and techniques for reaching audiences with information on these topics.
The group developed a "seagrass outreach toolbox" (which is available on the Internet at
http://www.fknms.nos.noaa.gov/edu/seagrassmonth/welcome.html) for organizations and individuals that are involved in education and outreach to the boating public, including rental boat operators, dive boat operators, teachers, Coast Guard Auxiliary, Power Squadron, boat sales businesses, non-profit organizations, and anyone who interacts with people who buy, rent, or use boats in the Keys.
The purpose of the toolbox is to provide everything necessary to spread the word about the value of and dangers to seagrass communities in the Keys. It currently includes:
• a list of organizations that can provide information and/or programs on seagrass habitats and minimum impact boating;
• a list of educational products available that contain information on seagrass habitats; • news articles with facts and figures pertaining to seagrass communities such as costs
associated with prop dredging;
• a graphic depicting the "alive" status of seagrass and the damage vessels can do in seagrass communities;
• a seagrass fact sheet for quick reference when preparing presentations or news articles; • message sheets detailing the economic value of seagrass communities, safe boating skills,
citizens’ connection to seagrass habitats, costs associated with seagrass damage, and the biology and ecology of seagrass habitats;
• photographs suitable for reproduction which show both healthy and damaged seagrass beds;
• brochures providing safe boating tips and information on the nature of seagrass habitats; and
• an 8- minute video providing information on safe boating in the Florida Keys and seagrass and coral reef habitats.
Several of the Outreach Partnership’s participating organizations are active in coastal management throughout Florida, and the program has the potential to become a statewide education/outreach initiative.
WATER QUALITY MANAGEMENT Case Study: Tampa Bay
As noted earlier, eutrophication and reduced water clarity caused large reductions in seagrass acreage in the Tampa Bay estuary between the 1950’s and early 1980’s (Haddad 1989). In 1991 the Tampa Bay Estuary Program (TBEP)—an EPA-sponsored partnership that includes the city and county go vernments of the Tampa Bay watershed as well as the Tampa Bay Regional Planning Council, Southwest Florida Water Management District, Florida Fish and Wildlife Conservation Commission, and the Florida Department of Environmental Protection—identified seagrass restoration as a priority management issue.
The approach used by the TBEP participants to develop water quality targets for seagrass restoration in Tampa Bay, which is summarized in Fig. 4, may prove applicable to other estuaries where anthropogenic nutrient enrichment is an important factor affecting water clarity, light attenuation, and seagrass survival and growth.
As the initial step in this process, the participants selected numerical seagrass restoration goals. Analysis of digitized aeria l photographs from State archives indicated that approximately 40,000 acres of seagrass had been present in Tampa Bay in 1950. Aerial photography shot in 1982 indicated that seagrass coverage had been reduced to about 21,600 acres, almost 50% below the benchmark 1950 period. Some of this loss had been caused by dredging and filling within existing seagrass beds, and was considered non-restorable. But most of the losses appeared to have been caused by increased turbidity and decreased water clarity, which reduced the amount of sunlight available in lower portions of the water column. These larger acreage losses were potentially restorable through water quality management actions.
Studies indicated that by managing the tonnage of nitrogen that is discharged to the bay each year—from sources such as rainfall, stormwater runoff and discharges of treated wastewater from sewage treatment plants—water clarity could be improved to and maintained at levels that would support larger seagrass acreages. Encouragingly, the studies were supported by local experience. Through the Grizzle-Figg Act (403.086 Florida Statutes), the Florida Legislature had required that all sewage treatment plants discharging to Tampa Bay, Sarasota Bay and Charlotte Harbor provide advanced wastewater treatment (AWT) prior to discharge. The City of Tampa upgraded its sewage treatment plant to AWT in 1989, greatly reducing the amount of nitrogen entering the bay from that source. St. Petersburg implemented a wastewater reuse program whic h eliminated almost all of that city's direct wastewater discharges to the bay. Improvements to sewage treatment plants in Pinellas, Hillsborough and Manatee counties also
Fig. 4. Approach used to develop nutrient management targets and seagrass restoration goals for Tampa Bay.
Step
Determine appropriate water clarity targets
Step 3. Estimate Chl-a
concentration and N loading targets Step 4.
Implement projects and track progress toward
targets and goals
Step 1. Select seagrass acreage recovery goals
helped spark the bay's recovery. By the early 1990’s, water clarity in some of the most impacted portions of the bay had already begun to improve (Johansson 1992).
In 1996 the TBEP participants adopted a bay-wide minimum seagrass coverage goal of 38,000 acres. This goal represented 95% of the estimated 1950 seagrass coverage, minus the non-restorable areas. At the time of its adoption the goal involved the protection of 25,600 acres of existing seagrasses and the restoration of an additional 12,350 acres throughout the bay
(Greening 2001).
Water quality modeling studies were carried out to better define the relationship between nitrogen inputs and bay water clarity (Janicki and Wade 1996, Wang et al. 1999). These studies suggested that the average annual tonnage of nitrogen entering the bay during the years 1992-1994 was not excessively high, and was at a level that should allow the seagrass acreage goals to be met, over time, in at least three of the bay’s four largest segments. As their initial nitrogen management strategy the TBEP participants therefore adopted a “hold the line” approach, seeking to maintain average annual nitrogen loads at or below the levels that were estimated to have occurred during the years 1992-1994 (Johansson and Greening 2000; Greening 2002).
Because of anticipated population growth in the watershed, “holding the line” on nitrogen loads at 1992-1994 levels was expected to require significant management actions by the TBEP
partners, who would need to prevent or compensate for the additional loads produced by the additional watershed residents.
In addition to carrying out those actions, the participants are continuing to monitor water quality, water clarity, and seagrass coverage in the bay. Annual average chlorophyll-a
concentrations and Secchi disk depths are reviewed at the end of each year and compared to target levels. Seagrass acreage is assessed every 2-3 years using aerial photography provided by the Southwest Florida Water Management District. The adequacy of the underlying water quality and water clarity models, and the “hold the line” nitrogen management strategy, are re-examined every 5 years.
It remains to be seen whether seagrass acreage in Tampa Bay can be returned to early-1950’s levels. In recent decades acreages have fluctuated upward and downward, with a generally upward trend, in all bay segments. Between the years 1982 and 1997, a net gain of
approximately 5,200 acres occurred. Following the El Niño event of 1997-1998 bay-wide coverage declined to about 24,800 acres, eliminating almost 40% gains achieved since the late 1980s (Johansson 2002). Field reports suggest that acreage has increased once again during the 1999-2002 period, and managers are awaiting updated aerial photographs and coverage maps to quantify the anticipated gains.
Seagrass-based water quality management in other Florida estuaries
Water quality targets for seagrass restoration and maintenance are currently being developed for the Indian River Lagoon (Virnstein and Morris 2000; Virnstein et al. 2002) and have been proposed for development in portions of Pensacola Bay (Schwenning 2001).
The Sarasota Bay National Estuary Program has successfully implemented a “technology-based” approach to water quality management (SBNEP 1995). Under this approach, numerical seagrass acreage goals and water quality targets are not developed. Instead, each of the major point and non-point pollutant sources in the contributing watershed are encouraged to apply “best available technology” (BAT) to reduce their discharges of nutrients, TSS, and other potential contributors to light attenuation. The presumption is that cumulative reductions in pollutant loadings will, over time, lead to improvements in water clarity and increasing seagrass coverage. Assuming that all major sources use BAT, the reductions in pollutant loadings will presumably be the best that can be achieved given the technology currently available. Using this approach, Sarasota Bay achieved an estimated 47% reduction in annual nitrogen load since 1990, and an estimated 18% increase in seagrass coverage since 1988 (Kurz et al. 2000).
MANAGEMENT OF BOATING IMPACTS
Scarring of seagrass beds, primarily by boat propellers, has occurred throughout Florida and appears to be increasing as the state’s human population and the number of registered vessels have increased (Sargent et al. 1995). Regrowth of seagrasses into propeller scars can be slow. Average rates for turtle grass, which shows the slowest regrowth rates, have been estimated at about 2-5 years in the Florida Keys, 4-6 years in upper Tampa Bay, and more than 7.5 years in middle Tampa Bay (Dawes and Andorfer 2002).
The ecological impacts of low to moderate levels of scarring have not been widely investigated and are not entirely clear. A recent field study found no significant differences in the densities of several common fish and invertebrate species in scarred vs. unscarred areas in Charlotte Harbor and Tampa Bay (Bell et al. 2002). However, given the high scarring rates observed in many shallow-water seagrass habitats, and the potential impacts of heavy scarring on the survival of the plants themselves, it appears prudent for managers to deve lop effective methods for addressing the issue. Sargent et al. (1995) provided the following overview:
“The Florida Department of Environmental Protection recognized the need to reduce scarring of seagrasses by boats, and committed resources to address the issue. As one component of this effort, the Florida Marine Research Institute (FMRI) investigated the distribution of scarred seagrass beds in shallow nearshore areas of Florida’s coastal counties. Aerial photography was used to locate
seagrass scarring. Aerial surveys were then conducted in 1992 and 1993 to confirm the location of scarred seagrasses.
During aerial surveys, observations of scarred seagrasses were recorded on National Oceanic and Atmospheric Administration nautical charts and U.S. Geological Survey quadrangle maps. Scarring intensity was categorized as light, moderate, or severe. Areas with substantial scarring recognizable on 1:24,000-scale aerial photography were delineated on the maps with polygons that were assigned a scarring intensity. Polygons categorized as light contained less than 5 percent scarring, those categorized as moderate contained 5 to 20 percent scarring and those categorized as severe contained more than 20 percent scarring.
The information acquired in the survey was incorporated into the FMRI’s Marine Resources Geographic Information System (MRGIS), which produces maps and tabular products so that geographically based data can be effectively disseminated to resource managers, appropriate regional and county governments and other interests (e.g., conservation groups and private citizens).
Scarred seagrasses were observed in all areas of the state, mostly in shallow coastal waters less than six feet deep. More than 173,000 acres of the Florida's 2.7 million acres of seagrasses were scarred, most of it lightly. This is a conservative estimate of scarring because FMRI mapped groups of scars, not isolated, individual propeller scars. The total seagrass acreage in Florida (2.7 million acres) includes areas in the Florida Keys that have sparse seagrass and hardbottom with dense-seagrass patches. Excluding these areas, seagrasses totaled approximately 1.9 million acres. Also, these totals do not include sparse, deep Halophila beds that are offshore in the Big Bend region.
The greatest acreage of moderate and severe (M/S) scarring occurred in areas having denser human populations and more registered boats. The Florida Keys (Monroe and Miami- Dade counties), Tampa Bay (Hillsborough, Manatee and Pinellas counties), Charlotte Harbor (Lee County) and the north Indian River Lagoon (Brevard and Volusia counties) had the greatest M/S scarring. Monroe County, which includes most of the Florida Keys, had the greatest acreage of M/S-scarred acreage of all the counties in the survey. The Panhandle and Big Bend regions had little M/S-scarred acreage, but in the western Panhandle embayments, M/S scarring was prevalent in the few acres of seagrasses.”
Sargent et al. (1995) noted that all boating user-groups appeared to play a role in scarring seagrasses. The most severe individual instances of scarring were apparently caused by large commercial vessels, but on a cumulative basis the most widespread scarring appeared to be caused by smaller boats. They recommended that management programs addressing seagrass scarring be based on a four-pronged approach incorporating:
(1) boater education;
(2) channel marking and signage; (3) limited- motoring-zones; and
(4) effective enforcement of boating regulations.
Sargent et al. (1995) also no ted that mapping and monitoring of managed areas are essential for evaluating the effectiveness of management efforts, and suggested that regional or statewide management plans might be needed to provide adequate protection for large areas of seagrass habitat that fall within the jurisdictions of multiple local governments.
Seagrass management programs in many part of Florida are currently addressing the issue of boating impacts, and have included one or more of the components recommended by Sargent et al. (1995):
(1) Boater Education
Efforts to educate boaters on the locations of shallow seagrass beds—and the importance of seagrasses to estuarine fish and shellfish communities—have been undertaken by many local governments, the FFWCC, FDEP, several National Estuary Programs and Estuarine
Research Reserves, and the Florida Keys National Marine Sanctuary. “Boaters Guides,” which include bathymetric charts showing the locations of shallow seagrass beds and other sensitive aquatic habitats, along with text explaining the importance of those habitats, have been developed for Apalachicola Bay, Biscayne Bay, Charlotte Harbor, Choctawhatchee Bay, Citrus County, Indian River Lagoon, Lake Worth Lagoon, Lee County, Saint Joseph Bay, Tampa Bay, and the Upper Florida Keys. Many of these guides can be downloaded from the FMRI website (http://www.floridamarine.org/products/products.asp) and are distributed in printed form by a number of organizations in the vicinity of each waterbody. Educational signs, which have been erected at a number of boat ramps, have also been used to provide information on the locations and importance of sensitive aquatic habitats in the vicinity of the ramps.
The Citizens Advisory Committees (CACs) associated with several National Estuary Programs have implemented boater education programs in an effort to reduce boating impacts to seagrass meadows and their inhabitants, including manatees. In the Tampa Bay region, multi-stakeholder users groups (e.g., the Cockroach Bay Users Group, at http://c-bug.org) have been established for some portions of the bay where seagrass scarring has been particularly intense. One focus of these groups has been an effort to identify potential non-regulatory management actions that might be used to provide better protection for existing seagrass beds.
(2) Channel Markers and Other Signage
Efforts to provide more effective marking of navigation channels have been used in many parts of the state to reduce scarring caused by boaters who inadvertently motor onto shallow vegetated flats. Because seagrass beds in shallow waters can also be impacted by the erosive effects of boat wakes and pressure waves, signage designating slow-speed or no-wake zones has also been used as a protective measure in the vicinity of shallow grassbeds. In many cases channel marking and other signage has been used in combination with motor exclusion or caution zones to protect heavily-scarred areas, a multi-pronged approach that is described in more detail below.
(3) Designation of Internal Combustion No-Entry or Slow-Speed Zones
Smith (1998) summarized 11 boating management areas that had been established in Florida prior to 1998 for the purpose of seagrass protection:
• Merritt Island NWR, No Entry Zone, Brevard County
• No Motor Power Zones Lee County
• Virginia Key, No Entry Zone, Miami- Dade County
• Pansy Bayou, No Entry Zone, Sarasota County
• J.N. “Ding” Darling National Wildlife Refuge, No Entry Zone, Lee County
• John Pennekamp Coral Reef State Park, No Combustion Motor Operation Zones, Monroe County
• Lignumvitae Key State Botanical Site, No Combustion Motor Operation Zones, Monroe County
• Gulf Islands GeoPark, Combustion Motor Exclusion Zones Pinellas County
• Weedon Island Aquatic Management Area, Combustion Motor Exclusion and Shallow Water Caution Zones
Pinellas County
• Fort DeSoto Wetland and Aquatic Habitat Management Area, Combustion Motor Exclusion and Shallow Water Caution Zones Pinellas County
• Cockroach Bay Aquatic Preserve, Combustion Motor Exclusion Zones, Hillsborough County
More recently, the Florida Keys National Marine Sanctuary (http://www.fknms.nos.noaa.gov) has designated a number of combustion motor exclusion and other protective zones to reduce boating impacts to seagrass and coral reef habitats in areas under its jurisdiction.
Case Study: Fort DeSoto Management Area
Levels of seagrass scarring in the Fort DeSoto management area, located near the mouth of Tampa Bay (Fig. 5) were monitored by Pinellas County before and after the establishment of four types of management zones (Stowers et al. 2002):
• Exclusion zone (no use of internal combustion engines);
• Caution zone (engine use allowed, but penalties imposed for damage to seagrasses; • Idle speed zone (e.g., allowing engine use within exclusion zones to provide access to
specific campsites) ; and • Control zone (no protection).
At the same time an active boater education campaign—which included expanded signage within the management area and at local boat ramps and local marinas—was carried out explaining the project’s rationale and methods.
Within the Ft. DeSoto management area, scarring rates within each zone were evaluated using low-altitude aerial photography and then digitized and interpreted by a seagrass specialist. Aerial photographs were taken in 1992 immediately prior to the establishment of the
management zones, in 1992 immediately following their establishment, and annually thereafter. Anecdotal information indicated that scarring in the area had increased substantially prior to 1992 (Stowers et al. 2002). Immediately following establishment of the management zones, the
rate of increase of new scarring (but not the scarring level itself) appeared to be considerably reduced in the caution and exclusion zones relative to the control zone (Stowers et al. 2002). The scarring rate remained fairly consistent over the next several years in spite of increased boating use in the area. Many signs and buoys were lost during the years 1992-1996, as a result of storms and other causes, and the scarring level in the caution zone peaked in 1996. In
response, several additional steps were taken the following year, including:
• elimination of buoys and their replacement by pilings to provide signage along zone boundaries;
• a new sign attachment method, which reduced the loss rate of signs from pilings; and • hiring of full- time law enforcement officers with shallow draft boats to patrol the
management area.
After 1996 scarring rates declined to similar levels in the exclusion and caution zone, but continued to increase in the control zone. On the basis of these results, the County eliminated the exclusion zone designation in 2002, designating all protection areas as caution zones, and is considering the possibility of expanding the caution zone designation to include previously unprotected areas (Stowers et al. 2002).
Stowers et al. (2002) highlighted the following as key elements in the Ft. DeSoto seagrass management project:
• document the problem thoroughly; • avoid assigning blame;
• get buy-in from all affected users; • follow through on promises to users; • provide feedback to users; and
The final point has been identified as an important component in the “adaptive management” approach to environmental problem-solving (e.g., Lee 1993).
(4) Enforcement of Boating Regulations
Experience suggests that many boaters will voluntarily obey regulations designed to protect seagrass resources, particularly if those regulations are deve loped through an inclusive, consensus-based process that includes an adequate level of public input. The results also suggest, however, that a certain percentage of boaters may tend to overlook, misunderstand or ignore such regulations. Consistent presence of enforcement personnel in areas of heavy boating activity appears to be one of the more effective tools available for reducing the potential impacts of this portion of the boating community on shallow seagrass habitats (Sargent et al. 1995).
PERMITTING OF DREDGE AND FILL AND OTHER CONSTRUCTION ACTIVITIES
Seagrass managers commonly deal with two aspects of Florida’s environmental permitting process, both of which are administered by FDEP:
• environmental resource permits (ERP), addressing dredge and fill projects and other activities potentially impacting wetlands; and
• sovereign submerged lands consent-of-use, addressing docks and other water-dependent structures that are proposed for construction in, on or over state-owned submerged lands.
Dredge and Fill
As explained in Appendix C, certain dredge and fill projects are also regulated by the federal government, with the U.S. Army Corps of Engineers serving as the lead permitting agency at the federal level. Other federal agencies, including the U.S. EPA, U.S. Fish and Wildlife Service, National Marine Fisheries Service, and the Florida Keys National Marine Sanctuary have authority to review and comment on permitting actions (i.e., permit issuance or denial) that are proposed by the Corps of Engineers. As an added complicating factor, within Florida portions of the ERP program have been delegated by FDEP to several of the water management districts and larger local governments.
Dock Construction Projects
The permitting process for single- family docks, which in some cases may involve an ERP permit and consent-of- use of sovereign submerged lands, is explained in Appendix D.
Unlike single-family docks, permit applications for large multi- user docks serving marinas or other water-related facilities typically trigger the federal dredge and fill permitting process as well as the state ERP/WR process. As noted earlier the federal permitting process involves the U.S. Army Corps of Engineers as the lead agency, with review by USEPA, USFWS, NMFS, and FKNMS. Federal and state reviews of these combined dredge and fill/ERP/WR applications are usually handled concurrently, as described in Appendix B.
Management Implications
For seagrass managers, two aspects of the permitting process are most relevant to their work: • the acreages and locations of seagrass beds that are impacted by permitted projects,
including impacts caused by individual projects and those brought about through the cumulative effects of multiple projects; and
• the success or failure of any mitigation efforts that permit recipients are required to carry out as a condition of permit issuance.
For projects whose individual or cumulative effects are expected to be ecologically significant, a formal impact assessment process can be used in an effort to tease apart the effects of natural variations and human impacts, and quantify the effects of the human activity. Because
environmental conditions are constantly changing and often highly variable, identification of human impacts can be difficult. Methods commonly used in impact assessment have included (Smith 2002):
• simulation models to predict the human impacts, combined with monitoring data to test model predictions;
• Before-After (BA) experimental designs, involving the collection and analysis of monitoring data at the potentially impacted site before and after the human activity; and • Before-After, Control-Impact (BACI) experimental designs, involving the collection and
analysis of monitoring data at both control and potentially impacted sites before and after the human activity.
Each of these methods has potential benefits, limitations, and costs. At present, BACI-based approaches appear to be the most widely recommended, due to their flexibility and the large number of statistical techniques that can be applied to the resulting data (Smith 2002).
The Ecological Society of Australia (2002) provides the following recommendations for the design and implementation of impact assessments:
“Where extensive monitoring programs are to be implemented, clear hypotheses should be tested using sound methods to collect data before, as well as after, the development commences. The actual methods used in a monitoring program should be tailored to test specific hypotheses related to each development. There is no single correct way to design a monitoring program. Nevertheless, the design philosophy of the "Beyond BACI" environmental impact study (refer to
Underwood, 1991; 1992) is generally recommended for detecting human impacts above that which could be attributed to natural variation. Control sites should be used, which are randomly selected areas containing habitats similar to those of the impact site but in an area not to be affected by the proposed development.
Ecological consultants should provide calculations of statistical power for surveys and/or experiments in environmental monitoring programs so that the likelihood of detecting impacts can be assessed. An estimate of the magnitude of impact should also be provided. Proposed monitoring programs should be subject to a peer review and approved prior to the final approval of the development.”
An application of a BACI-based experimental design to the assessment of dredging impacts on seagrasses is described by Long et al. (1996).
SECTION 4. REPLANTING AND OTHER DAMAGE-REPAIR TOOLS
This section addresses efforts to plant, replant or otherwise restore seagrasses on small spatial scales, in localized areas where the plants have been damaged or killed by human activities or natural processes.
As noted above, many acres of nearshore seagrass habitat have been damaged or lost in Florida during the past several decades. From a practical perspective it is obvious that many of these impacts—such as bay-wide water quality degradation or large dredge-and- fill projects—cannot be effectively addressed by planting projects alone. In many areas, however, small- scale impacts have occurred due to localized water quality problems, prop-scarring, or small dredge-and- fill projects. Researchers and resource managers have carried out a number of mitigation and restoration projects in such areas, in order to develop a better understanding of techniques that may offer promise in different geographic areas and environmental settings.
Planting
Unfortunately, a large number of seagrass planting projects have been unsuccessful and, as a general rule, conservation of existing seagrass beds has proven to be a much more cost-effective management technique. In cases where planting is necessary, however, a set of helpful guidelines has been developed by the National Oceanic and Atmospheric Administration (Fonseca et al. 1998). Those guidelines include the following steps:
• Planning
The most critical component of a successful planting effort is careful and
thoughtful planning. The issues requiring consideration vary from site to site, but several general topics arise in almost every project:
Ø Preserving genetic diversity by selecting planting stock from a variety of widely-distributed seagrass beds;
Ø Identifying project goals with respect to seagrass coverage, species composition, and the ecological function of restored or created seagrass beds;
Ø Coordinating the permitting process to avoid delays that may occur in cases where permit applications must be reviewed and approved by a number of federal, state, and local regulatory agencies; and
Ø Surveying and selecting sites to insure that resources will not be wasted by attempting to establish seagrasses in areas where adverse physical
conditions or inadequate water quality are likely to preclude long-term survival.
• Obtaining Transplant Stock
Although the development of propagation and laboratory culture techniques are areas of active research, most planting projects currently use wild plants harvested from existing seagrass beds. Care must therefore be taken to avoid excessive harvesting that may damage donor sites. As a general rule, plants from donor sites whose environmental conditions are similar to the recipient site tend to provide the highest rates of post-transplant survival and growth.
• Planting
A variety of planting methods can be used, the most common of which are: Ø stapling of bare-root plants, using metal, bamboo or wooden staples to
secure the rhizomes in the sediment at the transplant site, and
Ø plugging of small (e.g., 4”–6” diameter) cores, which include intact plants and attached sediment, collected from the donor site.
.
In a variation of the plugging method, the plugs can be transferred to peat pots which are then transplanted to the restoration site.
Each of these methods has been used successfully in a number of geographic regions and physical settings. Decisions regarding planting methods, planting densities, and the use of chemical treatments (e.g., fertilizers, plant growth hormones) in an effort to improve planting success must be made on a case-by-case basis, based on careful consideration of site conditions, project costs and the availability of fund