DigitalCommons@UNMC
DigitalCommons@UNMC
Theses & Dissertations Graduate Studies
Fall 12-15-2017
Focus: A Graph Approach for Data-Mining and Domain-Specific
Focus: A Graph Approach for Data-Mining and Domain-Specific
Assembly of Next Generation Sequencing Data
Assembly of Next Generation Sequencing Data
Julia SommerUniversity of Nebraska Medical Center
Follow this and additional works at: https://digitalcommons.unmc.edu/etd Part of the Bioinformatics Commons
Recommended Citation Recommended Citation
Sommer, Julia, "Focus: A Graph Approach for Data-Mining and Domain-Specific Assembly of Next Generation Sequencing Data" (2017). Theses & Dissertations. 242.
https://digitalcommons.unmc.edu/etd/242
This Dissertation is brought to you for free and open access by the Graduate Studies at DigitalCommons@UNMC. It has been accepted for inclusion in Theses & Dissertations by an authorized administrator of
By
Julia D. Sommer
A DISSERTATION
Presented to the Faculty of
The University of Nebraska Graduate College
In Partial Fulfillment of the Requirements
For the Degree of Doctor of Philosophy
Pathology and Microbiology Graduate Program
Specialty Track in Bioinformatics
Under the Supervision of Professor Hesham H. Ali
University of Nebraska Medical Center
Omaha, Nebraska
December 2017
Supervisory Committee:
Dhundy K. Bastola, Ph.D.
Javeed Iqbal, Ph.D.
Dario Ghersi, M.D, Ph.D. Michael R. Green Ph.D
ACKNOWLEDGEMENTS
First I would like to extend my sincere gratitude to my mentor Dr. Hesham H. Ali. I first remember working with Dr. Ali as a freshmen INBRE undergraduate scholar at the University of Nebraska at Omaha. I distinctly remember our first conversation about potential projects and Dr. Ali discussing my options of taking an easier, “low hanging fruit” project or a highly challenging but highly rewarding long-term project. He encouraged me to pursue the challenging but rewarding project. This project led me to discover my passion for science and technology, my decision to pursue graduate school, and the completion of this Ph.D. At that time and continuing to today, I was thrilled that Dr. Ali believed in me and felt that I was capable of handling such a challenging project. Dr. Ali is like this with all of his students, believing in them and bringing out the best of their talents and capabilities. Despite having an extremely busy schedule, Dr. Ali finds time for all of his students and actively goes beyond and above to support them and foster their growth both academically and personally. I thank him for all of his support during both the high times of my academic career as well as through the difficult and challenging times.
I also want to extend my gratitude to all of the members of my graduate and defense committee: Dr. Kiran Bastola, Dr. Dario Ghersi, Dr. Javeed Iqbal, Dr. Michael Green, and Dr. Tammy Kielian. I thank them for their time, invaluable insights and guidance during my Ph.D. It has been a privilege and honor to work with this committee of scientific experts.
Next I want thank others who have shaped and molded my academic career. I give special thanks to Dr. Sachin Pawaskar, with whom I collaborated with during my undergraduate and graduate career. I have thoroughly enjoyed working with Dr. Pawaskar and am a better scientist and computer programmer because of his mentorship and guidance. I thank him for reaching out to me for the next phase of my career as a postdoctoral researcher at the Defense POW/MIA Accounting Agency (DPAA). It has been wonderful to work with those at the DPAA
welcoming me to the team and teaching me about forensic anthropology.
I am so grateful to have been a part of the UNO Bioinformatics lab and for the camaraderie, encouragement, and support that I have found there. I will always remember all of the conferences traveled to, the tea times attended, and engaging conversations of the UNO bioinformatics lab. I am also thankful for the friendships and support that I found at UNMC during my Ph.D career.
I want to acknowledge the fellowships and scholarships that paved the way for my academic and postgraduate career and the opportunities that they provided. Thank you to Walter and Suzanne Scott Jr. for their generosity through the Walter Scott, Jr. Scholarship, the INBRE program (Grant number P20 RR16469 from the National Center for Research Resources, a component of the National Institutes of Health) for providing undergraduate research opportunities and support, and the UNMC graduate studies fellowship for supporting my graduate research. Thank you also to the Oak Ridge Institute for Science and Education (ORISE) for supporting my research conducted at the DPAA.
I thank my family for all of their love, support, and encouragement. First I wish to thank my wonderful husband and best friend Nathan Sommer for all of his love, humor, and support. He has been the calming force throughout the last stretches of my Ph.D, keeping anxiety and stress at bay through love and laughter. I am looking forward to our next adventures in life! I am forever grateful to my lovely mother Marcia Warnke who was the first to believe in me in all of my endeavors in life whether it was dance, track and field, or academics. I am forever grateful to my brilliant father, Mitch Warnke, who was the first to inspire my interest in science and computer programming. I miss him greatly and wish that he were here to see me complete the PhD. I am thankful to my amazing brother Nick for his support and encouragement and am very proud of his accomplishments in computer science. Thank you also to my special grandmother
Donna Fast for her love and encouragement. I extend my heartfelt gratitude for all of the love and support from my aunts, uncles, cousins, grandparents, in-laws, and friends. Finally, I thank God for being my strength and foundation through out my life and graduate career.
SPECIFIC ASSEMBLY OF NEXT GENERATION SEQUENCING DATA
Julia D. Sommer, Ph.D.
University of Nebraska Medical Center, 2017
Advisor: Hesham H. Ali, Ph.D
Next Generation Sequencing (NGS) has emerged as a key technology leading to revolutionary breakthroughs in numerous biomedical research areas. These technologies produce millions to billions of short DNA reads that represent a small fraction of the original target DNA sequence. These short reads contain little information individually but are produced at a high coverage of the original sequence such that many reads overlap. Overlap relationships allow for the reads to be linearly ordered and merged by computational programs called assemblers into long stretches of contiguous sequence called contigs that can be used for research applications. Although the assembly of the reads produced by NGS remains a difficult task, it is the process of extracting useful knowledge from these relatively short sequences that has become one of the most exciting and challenging problems in Bioinformatics.
The assembly of short reads is an aggregative process where critical information is lost as reads are merged into contigs. In addition, the assembly process is treated as a black box, with generic assembler tools that do not adapt to input data set characteristics. Finally, as NGS data throughput continues to increase, there is an increasing need for smart parallel assembler implementations. In this dissertation, a new assembly approach called Focus is proposed. Unlike previous assemblers, Focus relies on a novel hybrid graph constructed from multiple graphs at different levels of granularity to represent the assembly problem, facilitating information capture and dynamic adjustment to input data set characteristics. This work is composed of four specific
aims: 1) The implementation of a robust assembly and analysis tool built on the hybrid graph platform 2) The development and application of graph mining to extract biologically relevant features in NGS data sets 3) The integration of domain specific knowledge to improve the assembly and analysis process. 4) The construction of smart parallel computing approaches, including the application of energy-aware computing for NGS assembly and knowledge integration to improve algorithm performance.
In conclusion, this dissertation presents a complete parallel assembler called Focus that is capable of extracting biologically relevant features directly from its hybrid assembly graph.
ACKNOWLEDGEMENTS ... I ABSTRACT ... IV TABLE OF CONTENTS ... V LIST OF FIGURES ... VI LIST OF TABLES ... VII LIST OF ABBREVIATIONS ... VIII
CHAPTER 1: INTRODUCTION ... 1 Problem Statement ... 2 Purpose of Research ... 3 Research Questions ... 5 Significance of Research ... 6 Organization of Dissertation ... 7
CHAPTER 2: NEXT GENERATION SEQUENCING BACKGROUND ... 9
Next Generation Sequencing: A Brief History ... 9
Next Generation Sequencing Technologies ... 17
Sequencing by Synthesis: Illumina ... 17
Sequencing by Synthesis: Roche 454 Pyrosequencing ... 19
Sequencing by Ligation: ABI SOLiD Sequencing ... 21
Single Molecule Real Time (SMRT) Sequencing: PacBio ... 23
Nanopore Sequencing: Oxford Nanopore Technologies ... 25
FASTA/FASTQ File Format ... 27
Next Generation Sequencing Applications ... 29
Whole Genome Sequencing ... 29
RNA-Seq ... 31
Metagenomics ... 31
Cancer Genomics ... 31
Virology ... 31
CHAPTER 3: THE ASSEMBLY PROBLEM ... 33
CHAPTER 4: MAIN TERMINOLOGY AND DEFINITIONS ... 37
General Assembler Pipeline ... 37
NGS Read Preprocessing ... 37
Determining Read Overlap Relationships ... 39
Suffix Trees ... 41
Suffix Arrays ... 43
Burrows-Wheeler Transform ... 43
K-mer Enumeration Methods ... 46
Graph Theory: Concepts and Definitions ... 48
Graph Theory: Structures and Structural Metrics ... 54
Graph Theory: Interval Graph ... 59
Graph Theory for Next Generation Sequence Assembly ... 62
Overlap-Layout-Consensus Assemblers ... 62
String Graph Assemblers ... 68
Assembly Scaffolding ... 71
Assembly Quality Metrics ... 71
CHAPTER 5: LITERATURE REVIEW ... 73
Next Generation Sequencing Preprocessing Tools ... 73
Fastx Toolkit ... 73
Galaxy Toolkit ... 73
Trimmomatic Toolkit ... 74
PRINSEQ ... 75
Assembly Tools for Next Generation Sequencing Data ... 75
De Bruijn Graph Assemblers ... 76
Euler Assembler ... 76
Velvet Algorithm ... 77
ALLPATHS Assembler ... 78
SOAPdenovo ... 79
Parallel de Bruijn Graph Assembler ... 80
ABySS Assembler ... 80
Ray Assembler ... 80
Iterative de Bruijn Graph Assemblers ... 81
IDBA Assembler ... 80
SPAdes Assembler ... 82
Overlap Graph Assemblers ... 83
CAP3 Assembler ... 83
CABOG Assembler ... 83
IDBA Assembler ... 83
Mira Assembler ... 84
String Graph Assemblers ... 85
SGA Assembler ... 85
Metagenomics Assemblers ... 85
Omega Assembler ... 85
MetaVelvet Assembler ... 86
Ray Meta Assembler ... 87
MetaSPAdes Assembler ... 87
RNA-seq Assemblers ... 88
Velvet-Oasis Assembler ... 88
Trinity Assembler ... 89
SOAPdenovo-Trans ... 89
TopHat and Cufflinks ... 90
Long Read Assemblers ... 91
CANU Assembler ... 91
HINGE Assembler ... 91
CHAPTER 6: PROJECT GOALS AND OBJECTIVES ... 93
Problem Statement ... 93
Research Purpose ... 98
Algorithm Overview ... 99
Specific Aims ... 99
CHAPTER 7: FOCUS: A NEW MULTILAYER GRAPH MODEL FOR SHORT READ ANALYSIS ... 104
Introduction ... 104
Hybrid Graph Set ... 113
Hybrid Graph Filter ... 115
Results ... 116
Simulated Data Sets ... 116
Computational Environment and Algorithm Configuration ... 117
Multilayer Graph Set ... 117
Hybrid Graph Set ... 118
Assessment of Focus as an Assembler ... 124
Conclusion and Discussion ... 126
CHAPTER 8: AN EFFICIENT OVERLAP GRAPH COARSENING APPROACH FOR MODELING SHORT READS ... 128
Introduction ... 128
Methods ... 128
Graph Theoretic Model ... 128
The Graph Data Structure ... 130
Graph Coarsening ... 132
Graph Relabeling ... 137
Read Cluster Generation ... 138
Hybrid Graph Set Construction ... 137
Results ... 140
Metagenomics Clustering ... 140
Node Relabeling ... 144
Conclusion and Discussion ... 146
CHAPTER 9: GRAPH MINING FOR NEXT GENERATION SEQUENCING: LEVERAGING THE ASSEMBLY GRAPH FOR BIOLOGICAL INSIGHTS ... 148
Introduction ... 148
Methods ... 153
Hybrid Graph Data-Mining ... 153
Results ... 157
Data Sets ... 159
Repetitive and Transposable Elements are Associated with Node Characteristics ... 163
Shannon’s Index Score Distribution and Functional Gene Categories ... 163
Characterization of Biological Features on Outlier Nodes ... 165
Selection of a Threshold for High Shannon’s Index Scores ... 165
Characterization of Biological Features on High Scoring Nodes ... 167
Mining and Characterization of Transposase Associated Antibiotic Resistance Genes .... 168
Additional Features Associated with Transposase Sequences ... 172
Subsystem Analysis ... 174
In-Depth Analysis of Pathologically Relevant Subsystems ... 180
Conclusion and Discussion ... 182
CHAPTER 10: A TOLERANCE GRAPH APPROACH FOR DOMAIN SPECIFIC ASSEMBLY OF NEXT GENERATION SEQUENCING DATA ... 184
Introduction ... 184
Methods ... 185
Graph Theoretic Model ... 185
Tolerance Threshold Adjustment ... 186
Experimental Design ... 190
Coverage Depth and Assembly ... 191
Tolerance Adjustments ... 195
Conclusion and Discussion ... 198
CHAPTER 11: PARALLEL FOCUS ASSEMBLER: DISTRIBUTED ASSEMBLY GRAPH 200 Introduction ... 200
Methods ... 201
Graph Coarsening ... 201
Graph Partitioning ... 202
Greedy Graph Growing ... 203
Kernighan-Lin Refinement Algorithm ... 206
Projection of the Partition ... 209
Global K-Way Kernighan-Lin Refinement Algorithm ... 209
Parallel Graph Algorithms ... 210
Transitive Edge Reduction ... 210
Containment Removal ... 211
Error Removal ... 211
Graph Traversal ... 211
Results ... 212
Data Sets and Computational Environment ... 212
Parallel Graph Partitioning ... 214
Incorporation of Domain Specific Knowledge for Graph Partitioning ... 216
Performance of Distributed Graph Algorithms ... 219
Extracting Biological Knowledge from Graph Partitioning ... 222
Conclusion and Discussion ... 224
CHAPTER 12: PARALLEL FOCUS ASSEMBLER: ENERGY AWARE SHORT READ ALIGNMENT UTILIZING HIGH PERFORMANCE COMPUTING ... 226
Introduction ... 226
Methods ... 227
Energy Aware Scheduling ... 227
Read Overlap Detection ... 227
Read Preprocessing ... 229
Containment Clustering ... 230
Dovetail Overlaps ... 230
Parallel Implementation and EAS Model ... 233
Solution Overview ... 233
Containment Execution – Step 1 ... 233
Dovetail Execution – Step 2 ... 236
Results ... 236
Conclusion and Discussion ... 242
CHAPTER 13: DISCUSSION AND FURTHER DIRECTIONS ... 243
Conclusion ... 243
Discussion ... 247
Limitations ... 249
Future Directions ... 250
FIGURE 1.1: INNOVATIONS OF THE FOCUS ASSEMBLER ... 4
FIGURE 2.1: CHAIN TERMINATION SEQUENCING ... 10
FIGURE 2.2: HIERARCHICAL GENOME SEQUENCING ... 13
FIGURE 2.3: ILLUMINA SEQUENCING WORKFLOW ... 20
FIGURE 2.4: ROCHE 454 SEQUENCING WORKFLOW ... 22
FIGURE 2.5: SEQUENCING BY LIGATION ... 24
FIGURE 2.6: PACBIO SMRT SEQUENCING ... 26
FIGURE 2.7: NANOPORE SEQUENCING ... 28
FIGURE 2.8: FASTA AND FASTQ FORMAT ... 30
FIGURE 3.1: THE ASSEMBLY PROBLEM ... 34
FIGURE 3.2: ASSEMBLY CHALLENGES ... 36
FIGURE 4.1: GENERAL ASSEMBLER PIPELINE ... 38
FIGURE 4.2: DOVETAIL AND CONTAINMENT OVERLAPS ... 40
FIGURE 4.3: SUFFIX TREE ... 42
FIGURE 4.4: SUFFIX ARRAY ... 44
FIGURE 4.5: THE SUFFIX ARRAY BURROW-WHEELER TRANSFORM FOR A GIVEN STRING S ... 45
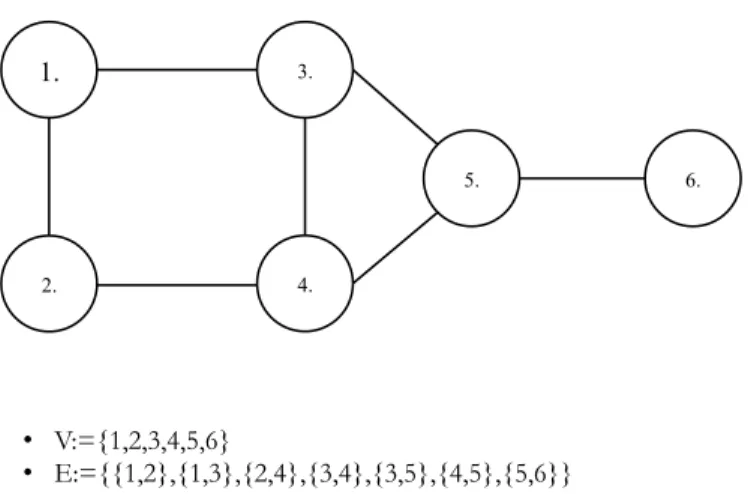
FIGURE 4.6: AN EXAMPLE OF A GRAPH ... 50
FIGURE 4.7: AN EXAMPLE OF A DIRECTED GRAPH ... 52
FIGURE 4.8: AN EXAMPLE OF A WEIGHTED DIRECTED GRAPH ... 53
FIGURE 4.9: A DISCONNECTED GRAPH ... 55
FIGURE 4.10: NODE DEGREE ... 56
FIGURE 4.11: WALKS, PATHS, AND CYCLES ... 57
FIGURE 4.12: A CLIQUE OF SIZE FOUR ... 58
FIGURE 4.13: THE INTERVAL GRAPH ... 60
FIGURE 4.14: THE TOLERANCE GRAPH ... 61
FIGURE 4.15: THE INTERVAL GRAPH AND THE OVERLAP GRAPH ... 63
FIGURE 4.16: THE OVERLAP GRAPH BEFORE AND AFTER TRANSITIVE REDUCTION ... 64
FIGURE 4.17: TYPES OF GRAPH STRUCTURES DUE TO SEQUENCING ERROR ... 66
FIGURE 4.17: DETERMINING PATHS IN THE SIMPLIFIED OVERLAP GRAPH ... 67
FIGURE 4.19: THE DE BRUIJN GRAPH ... 70
FIGURE 7.2: MULTILAYER AND HYBRID GRAPH SETS ... 108
FIGURE 7.3: HYBRID GRAPH TRIMMING ... 114
FIGURE 7.2: MULTILAYER GRAPH SET CONSTRUCTION RESULTS ... 120
FIGURE 7.4: SELECTED AND REJECTED NODE READ CLASSIFICATION ERROR RATES ... 121
FIGURE 7.5: SELECTED NODE COUNTS ... 122
FIGURE 8.1: GRAPH THEORETIC MODEL ... 129
FIGURE 8.2: GRAPH DATA STRUCTURES ... 133
FIGURE 8.3: GRAPH COARSENING ... 135
FIGURE 8.4: READ CLASSIFICATION, GRAPH RELABELING, AND GRAPH COARSENING STATISTICS ... 142
FIGURE 9.1: THE INSERTION SEQUENCE AND THE COMPOSITE TRANSPOSON ... 152
FIGURE 9.2: SHANNON’S INDEX SCORES ... 155
FIGURE 9.3: GENOMIC FEATURES AND RELATED GRAPH STRUCTURES ... 156
FIGURE 9.4: TAXONOMIC READ CLASSIFICATION ... 162
FIGURE 9.5: SHANNON’S INDEX SCORE DISTRIBUTION AND SEED SUBSYSTEM ASSIGNMENT ... 164
FIGURE 9.6: K-MEANS CLUSTERING ELBOW PLOTS ... 169
FIGURE 9.7: PHYLOGENETIC CLUSTERS OF TRANSPOSASES IN THE CROHN’S DISEASE DATA SETS WITH ANTIBIOTIC CLASS ENRICHMENTS ... 171
FIGURE 9.8: PHYLOGENETIC CLUSTERS OF TRANSPOSASES IN THE HEALTHY DISEASE DATA SETS WITH ANTIBIOTIC CLASS ENRICHMENTS ... 173
FIGURE 9.9: TRANSPOSASE ASSOCIATED SUBSYSTEM DIFFERENCES BETWEEN CROHN”S DISEASE AND HEALTHY GUT MICROBIOME SAMPLES ... 175
FIGURE 9.10: DISTRIBUTION OF GENERA FOR SIGNIFICANT SUBSYSTEMS ... 178
FIGURE 9.11: LEVEL 3 SUBSYSTEM COUNTS FOR BETA-GLUCOSIDE METABOLISM, HEME, HEMIN UPTAKE AND UTILIZATION SYSTEMS, AND MALTOSE AND MALTODEXTRIN UTILIZATION ... 181
FIGURE 10.1: GRAPH THEORY ... 187
FIGURE 10.2: COVERAGE DEPTH AND ASSEMBLY ... 194
FIGURE 10.3: OPTIMAL OVERLAP LENGTHS ... 196
FIGURE 11.1: GREEDY GRAPH GROWING ... 205
FIGURE 11.2: KERNIGHAN-LIN ... 208
FIGURE 11.3: GRAPH PARTITIONING SPEEDUP ... 215
FIGURE 11.4: HYBRID GRAPH SET VERSUS MULTILAYER GRAPH SET ... 217
FIGURE 11.5: DISTRIBUTED GRAPH ALGORITHMS ... 220
FIGURE 12.3: CONTAINMENT CLUSTERING ... 232 FIGURE 12.4: PROCESS FLOW DIAGRAM ... 234 FIGURE 12.5: EXECUTION DEPENDENCIES OF CONTAINMENT TASKS ... 235 FIGURE 12.6: EAS-EXECUTION TIME V/S NODES. EXECUTION TIME/OVERHEAD V/S NODES. SPEEDUP CURVE FOR THE ASSEMBLY PROGRAM ... 238 FIGURE 12.7: EAS ENGINE – DYNAMIC NODE ADJUSTMENTS ... 241 FIGURE 13.1: FIGURE 1.1 REVISITED – INNOVATIONS OF THE FOCUS ASSEMBLER ... 244 FIGURE 13.2: ASSEMBLY GRAPH TARGET READ ENRICHMENT ... 251
LIST OF TABLES
TABLE 7.1: HYBRID GRAPH SET AND MULTILAYER GRAPH SET COMPARISON ... 123
TABLE 7.2: ASSEMBLY COMPARISON ... 125
TABLE 8.1: SIMULATED DATA SETS ... 143
TABLE 8.2: BACTERIAL READ DATA SETS ... 145
TABLE 8.3: READ OVERLAPPING RUNTIME (8 NODES) ... 145
TABLE 8.4: GRAPH COARSENING RUNTIME (SERIAL MERGE-SORT) ... 145
TABLE 9.1: DATA SET CHARACTERISTICS ... 160
TABLE 9.2: SEQUENCE FEATURES ON NODES WITH THE HIGHEST SHANNON’S INDEXES ... 166
TABLE 9.3: SUBSYSTEMS THAT WERE NOT SIGNIFICANTLY DIFFERENT BETWEEN CROHN’S DISEASE AND HEALTHY MICROBIOME SAMPLES ... 179
TABLE 10.1: ESCHERICHIA COLI DATA SET CHARACTERISTICS ... 192
TABLE 10.2: TOLERANCE ASSEMBLY RESULTS ... 197
TABLE 11.1: DATA SET CHARCTERISTICS ... 213
TABLE 11.2: EDGE CUT FOR MULTILEVEL AND HYBRID GRAPH SETS ... 218
TABLE 11.3: ASSEMBLY STATISTICS ... 221
ABI
Applied BiosystemsBAC
Bacterial Artificial ChromosomeBWT
Burrows-Wheeler TransformBWM
Burrows-Wheeler MatrixDOE
Department of EnergyDNA
Deoxyribonucleic acidHEM
Heavy Edge MatchingHGP
Human Genome ProjectNGS
Next Generation SequencingOVL
OverlapOTU
Operational Taxonomic UnitsOLC
Overlap-Layout-ConsensusSA
Suffix Array
STS
Sequence Tagged SiteTIGR
The Institute for Genomic ResearchNIH
National Institute of HealthYAC
Yeast Artificial ChromosomeCHAPTER 1
INTRODUCTION
Since its inception in 2005, Next Generation Sequencing (NGS) has revolutionized the biomedical sciences. Biological sequence data is now being produced at unprecedented rates. This is both a blessing and a curse, as researchers now have potentially unlimited amounts of biological data to work with. However, with this deluge of biological data comes the challenge of processing and transforming this data into usable information. Genomes can range from several thousand to several billion base pairs (bp) in length. Current sequencing technologies can only sequence a few hundred to a few thousand bp at a time depending on technology used. These short sequencing fragments are called reads. While these reads might be small in comparison to the source genome, they are produced at an extremely high coverage of the original sequence. For example if a genome were sequenced at 50x coverage, then theoretically each position in the genome would be coverage by fifty reads if coverage were uniform. The data sets output by next generation sequencing technologies are enormous in size and contain millions to billions of reads in random order. In many projects, these reads must be ordered and merged into a representation of the original target sequence before downstream analysis.
The Assembly Problem:
Given a read data set, utilize overlap relationships between reads to find an ordering of the reads that corresponds to the original target sequence. The optimal result of short read assembly is the complete and error free reconstruction of the original target sequence.
software tools called assemblers to orient and merge the reads into contigs, which are stretches of contiguous sequence representing consecutive regions in the genome. These assembly tools rely on mathematical models called graphs to support the assembly process.
1.1 Problem Statement
The focus of current assemblers is primarily on assembly; the assembly graph serves primarily as an inert scaffold for the assembly process. However, in contrast we propose that as a structural model the assembly graph is able to capture a wealth of biologically relevant information from the input data set. The assembly process actually loses information as individual reads are merged into contigs; the global relationships between reads and any alternate assemblies are lost. There is so much rich information contained in the assembly graph that is lost as reads are merged into flat contigs.
Second, assemblers that have been developed are very generic in nature and do not take input data characteristics into consideration. Many assembly tools are like a black box, with the input data set having little influence on the assembly process. All assemblers will produce an output given an input data set; however, it is unlikely that one-sized-fits all approaches will produce optimal results in all situations.
Finally, as sequencing throughput continues to increase there is a great need for high performance computing methods to meet researcher needs. Several assembly tools have implemented parallel methods for next generation sequencing assembly. However, parallel methods for next generation sequence are often naïve in nature. These parallel methods are also data agnostic. Further, naïve parallel applications might utilize unnecessary computational resources with minimal gains in computational speed-up times.
1.2 Purpose of Research
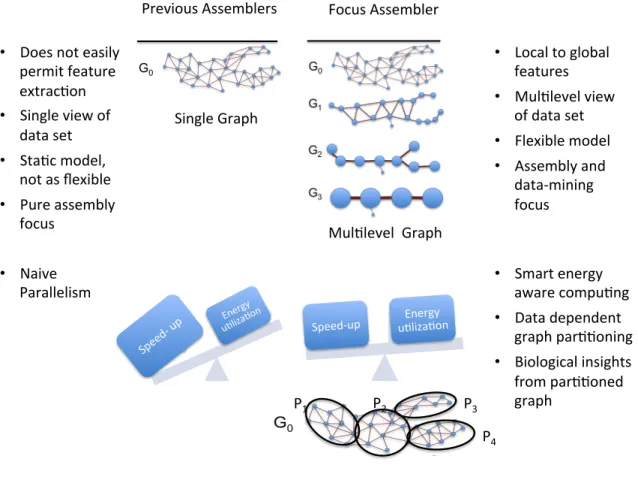
The major result of this dissertation is an innovative bioinformatics tool called Focus. Focus is a flexible, graph theoretic model for both analyzing and assembling next generation sequencing data. This assembler relies on a novel graph theoretic platform to provide an innovative representation of read data sets. Unlike previous models that use a single graph to model the assembly graph, Focus utilizes a multiset of graphs across a spectrum of granularity. A single graph is only capable of providing a single view of the read data set; however, a multset of graphs is able to capture both local and global information at different scales of granularity. In this dissertation, we demonstrate that 1) The novel graph multiset is a powerful data-mining support, allowing for the extraction of biologically relevant features from input read data sets. 2) The Focus assembler is an intelligent, customizable and domain-specific approach that can be tailored to the input data set resulting in better assemblies. 3) Smart, energy-aware parallel computing approaches are developed on the Focus platform, leading to more efficient computational utilization while still meeting researcher deadlines. A high performance computing approach with a distributed assembly graph implemented in the Focus assembler not only improves assembly runtime but also reveals community structure in metagenomics data sets. Figure 1.1 highlights the some of the major differences between the Focus assembler and previous approaches.
In addition to introducing the Focus NGS assembly and analysis program, this dissertation also discusses further developed analytical approaches and case studies in metagenomics, a field stemming from next generation sequencing applied to study microbial environmental communities.
Energy u)liza)on Speed-up
Previous Assemblers Focus Assembler
Single Graph Mul)level Graph • Local to global features • Mul)level view of data set • Flexible model • Assembly and data-mining focus
• Does not easily permit feature extrac)on • Single view of data set • Sta)c model, not as flexible • Pure assembly focus • Naive
Parallelism • Smart energy aware compu)ng
• Data dependent graph par))oning • Biological insights from par))oned graph P4 P3 P2 P1
Figure 1.1: Innovations of the Focus assembler in comparison to previous assembly approaches.
The top of this figure shows the novel multilevel graph approach of the Focus assembler. The bottom of this figure focuses on parallel computing and the distributed assembly graph of the Focus assembler.
1.3 Research Questions
The purpose of this research is to provide an intelligent, customizable, and domain-specific approach for the assembly and biologically relevant feature extraction from next generation sequencing reads. To achieve this goal, several research questions must be answered.
1) How should the graph theoretic model be developed to represent and support the assembly process?
2) How can this graph model be adapted to facilitate graph-based data-mining of input read data sets?
3) What genomic features present in an input next generation sequencing data set are associated with extractable graph structures?
4) How can assembly and graph parameters be tuned according to domain-specific characteristics of the input read data sets?
5) How can we use data-specific information to improve next generation sequence assembly?
6) What assembly processes can be modified to have a parallel implementation?
7) How can the assembly graph be efficiently distributed across multiple compute nodes for parallel computing?
Additional supporting questions are as follows.
• What methods and data structures will the Focus assembly tool use to handle the massive amounts of read data?
• How will the quality of assemblies produced by Focus and other assemblers be evaluated?
• Will reads be trimmed and cleaned by the Focus assembler before assembly?
• Which methods will be used to detect and remove erroneous information from the graph model during assembly?
• What types of sequencing data will the Focus algorithm be developed to analyze and assemble?
1.4 Significance of Research
This research is significant because it provides a novel approach for assembly and analysis of next generation sequencing data. Direct data-mining of sequencing data using the assembly graph is an innovative approach that will allow researchers to discover novel data features in their sequencing data. In this research, graph-mining is shown to be capable of discovering numerous biologically relevant features, such as antibiotic resistance gene distributions in healthy and disease-associated gut microbiomes. Besides data-mining, the Focus assembler is capable of performing assembly as a secondary task, making it a flexible and useful tool.
Further, this Focus assembler tool is an intelligent, customizable, domain-specific approach for the analysis and assembly of next generation sequencing data. Most previous assemblers are black-boxes that do not take any of the input data set characteristics into consideration. This alternate concept of tailoring computational algorithms to their input data is beneficial to the research community as a whole and may lead to better results produced by customized software systems.
The Focus assembler introduces novel approaches for parallel sequence assemble, also built upon the concept of customization to input data characteristics. The Focus assembler utilizes
domain-specific features of the input data set to improve graph partitioning over compute nodes on a high performance computing cluster. We have also developed an energy-aware approach for determining overlap relationships between reads. As the volume of biological data continues to increase, there is a growing need for computational resources. It will become important to the research community to balance limited computational resources with required deadlines.
In conclusion, the Focus assembler presents a data-centric, graph data-mining platform that is also a next generation sequencing read assembly tool. Focus encapsulates parallel computing methods that are intelligent and data-dependent, leading to better performance. The data-dependent distributed assembly graph is shown in this research to reveal community structure in metagenomics data sets.
1.5 Organization of Dissertation
Here the organization of this dissertation as a roadmap for the reader is briefly described. In chapter two, a background survey is presented covering 1) a brief history of next generation sequence and 2) an overview of current sequencing technologies. In chapter three, the problem of next generation sequence assembly is introduced and formally defined. Next, supporting terms, definitions, and theoretical background are discussed in chapter four. In chapter five, a literature review of previous assembly approaches for next generation sequence assembly is given. Following this, the problem statement of the dissertation is discussed along with the four specific aims that this dissertation will address. Chapter six introduces the Focus assembly algorithm with chapter seven describing Focus’s technical implementation details. Chapter seven is mostly algorithmically and computationally focused on the underlying structure and organization of the Focus assembler. The next chapter is devoted to the Focus assembly and analysis tool as a data-mining support. The customization of the Focus assembler according to input data characteristics is then explored using a tolerance graph approach. Addressing the final aim, a parallel, energy-aware implementation of the read overlapping module of the Focus assembler is discussed. A
CHAPTER 2
NEXT GENERATION SEQUENCING BACKGROUND
2.1
Next Generation Sequencing: A Brief History
Next generation sequencing has its roots in Sanger sequencing [1] or chain termination sequencing, as its also called. The classical Sanger sequencing method requires a single stranded DNA sequence, a primer, and DNA polymerase, as well as two types of deoxynucleoside triphosphates (dNTPs). The first type of dNTPs was the usual set consisting of deoxyadenosine triphosphates (dATPs), deoxyguanosine triphosphate (dGTPs), deoxycytidine triphosphate (dCTPs), and deoxythymidine triphosphate (dTTPs). The second type was a modified nucleotide type (ddNTPs) that lacks a 3’ OH group. The lack of this 3’ OH group prevents the formation of a phosphodiester bond between nucleotides and therefore terminates the extension of a growing DNA chain.
The original Sanger sequencing approach was a two-step process. First, the DNA to be sequenced is added to four separate sequencing reactions. Each of the reactions contains all of the standard dNTPs. However, each sequencing reaction also contains one of the ddNTP types at a low concentration. As the DNA polymerase extends the growing DNA chain, ddNTPs are randomly inserted into the DNA chain. After the ddNTP is inserted the growing chain is terminated. The result of the first step of the classical Sanger sequencing method is various DNA chains of all possible lengths with known terminating nucleotides. In the second step of the classical Sanger sequencing method, polyacrylamide gel electrophoresis is used to separate the DNA chains, with each sequencing reaction in a different gel electrophoresis lane. The separated DNA chains can now be read by autoradiography to obtain the sequence of the nucleotides. This produced sequence of nucleotides is called a read. In more modern Sanger sequencing, the ddNTPs are fluorescently or radiography tagged so that automatic sequencing machines can read them. Please see Fig. 2.1 for an illustration of classical Sanger sequencing.
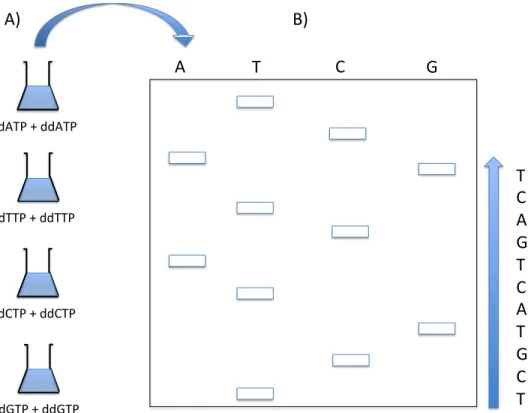
Figure 2.1: Chain termination sequencing (Classical Sanger method). A) The DNA strand to be sequenced is added to four different sequencing reactions containing: a DNA primer, a DNA polymerase, the standard four dNTPs, and a modified ddNTP (either ddATP, ddTTP, ddCTP, or ddGTP). The modified ddNTP is randomly inserted into the growing DNA chains, terminating them at different lengths. B) The terminated DNA chains are separated by gel electrophoresis, with each sequencing reaction added to a separate lane. Once the DNA chains are separated by length and visualized by UV light or autoradiography, the ordering of the nucleotides in the
DNA strand can be read.
A
T
C
G
dCTP + ddCTP dATP + ddATP dTTP + ddTTP dGTP + ddGTPT
C
A
G
T
C
A
T
G
C
T
A)
B)
The first DNA genome to be sequenced using the chain termination method was the
bacteriophage ΦX174 by Frederick Sanger and his colleagues in 1977 [1]. To sequence
bacteriophage ΦX174, Sanger used restriction enzymes to create random primers from the
ΦX174 genome. These primers were used to amplify portions of the ΦX174 genome, which were
then merged by their overlapping regions. This method was a forerunner of the shotgun sequencing method, which is introduced later in this section.
Rapidly following the publication of the ΦX174 genome, various other DNA genomes
were sequenced. In 1982, Frederick Sanger sequenced the λ bacteriophage [2]. This
bacteriophage is 48K nucleotides in length. While small, the genome of this bacteriophage was still much longer than the reads that Sanger sequences was able to produce, which were between 15 and 200 nucleotides in length [1]. During this early era of genome sequencing, two approaches were being heavily debated for sequencing larger genomes [3] . The first approach, which was favored at the time, was the directed sequencing approach. In this approach, the genome to be sequenced was cut into large fragments. These fragments were ordered and used to create a map of the genome being sequenced. The fragments were then cloned followed by sequencing.
The directed sequencing approach evolved over time into hierarchical sequencing. In hierarchical sequencing, the genome to be sequenced was fragmented into pieces and the resulting fragments were inserted into artificial chromosomes. In the earlier days of sequencing Yeast Artificial Chromosomes (YACs) were used; however; these chromosomes were prone to genomic rearrangement and chimerism [4]. The use of YACs was shifted towards the use of Bacterial Artificial Chromosomes (BACs), which resolved many of the issues that researchers were facing. On average a BAC could contain 110 kb of DNA sequencing [5]. Once a library of YAC of BAC clones was established, the next step was to identify the ordering of the clones to form a crude physical map of the genome to be sequenced. This was accomplished by using
is used to cut each of the clones. The resulting lengths of the set of fragments produced for each clone become that clone’s fingerprint. Overlapping clones could then be determined by shared fingerprint patterns between clones.
Once the ordering of the YAC or BAC clones was completed and a crude physical map of the genome was established, the large inserts were randomly fragmented again into smaller fragments that are inserted into a vector. In the early days of sequencing the M13 vector was used [7] but additional vector types became available as sequencing technologies advanced. Early M13 vectors only allowed for one end of the insert to be sequenced; however, later plasmids allowed for both ends of the insert to be sequenced to produce mate-pair reads [8]. Libraries of clones were generated for these smaller fragments, which were then sequenced using Sanger sequencing technology.
The second method, which was slowly gaining momentum in the 1980s, was the whole genome shotgun sequencing approach. In this method, the creation of the physical genome map was not conducted. Instead multiple copies of the entire genome were sheared into several thousand or million short fragments. These fragments were then inserted into plasmid vectors, cloned, and then directly sequenced. While, this approach appears simpler than hierarchical genome sequencing, there were many concerns during the early sequencing era for its applicability to larger genomes [3]. It would be over a decade before whole genome shotgun sequencing became the accepted standard approach for sequencing both small and large genomes. Please see Fig, 2.2 for a brief overview of both hierarchical and whole genome shotgun sequencing approaches.
The λ bacteriophage was the first DNA genome to be sequenced using the whole genome
shogun sequencing method. While sequencing this genome, Sanger compared both whole genome shotgun sequencing and directed sequencing.
Genomic Sequence
Large DNA Fragments (100-200 kb)
YAC or BAC Clone Libraries
BAC Clone
RestricCon Enzyme DigesCon
Gel Electrophoresis 75 kb 25 kb 15 kb Pair-wise Comparison Finger PrinCng BAC Ordering BAC FragmentaCon M13 Vector Library M13 Vector Sequencing A) B) Genomic Sequence DNA Fragments ~ 1,500 bp
Plasmid Vector Clone Library Plasmid Vector
Sequencing
Figure 2.2: Hierarchical genome sequencing. In this approach, the genome is cut into large
overlapping fragments. These fragments are inserted into BACs and a BAC clone library is generated. Fingerprinting is conducted and pair-wise comparisons of the resulting fragment lengths are used to detect overlapping regions between the BAC clones. The BAC clones are ordered according to the overlap relationships to form a physical map of the underlying genome. Further fragmentation of the BAC clones is conducted, a M13 vector clone library is generated
and sequenced. B) Whole genome shotgun sequencing. Multiple copies of the entire genome
are fragmented into small pieces. The fragments are inserted into plasmid vectors and a plasmid vector clone library is generated. The plasmid vectors are then sequenced.
sequencing approaches [3]. However, one issue that early whole genome sequencing had at the time was that there were gaps in the sequencing. The areas that were not covered by the whole genome shotgun sequencing reads had to be finished using directed sequencing methods. This issue was largely mitigating when mate-paired reads were introduced in 1991 [9]. Mate-paired reads are the product of sequencing both ends of a clone, resulting in a pair of reads with a known distance between them.
The first free living organism to be sequenced was Haemophilus Influenzae in 1995 [10].
This was accomplished by J. Craig Venter and his team at the Institute for Genomic Research (TIGR). J. Craig Venter was originally located at the National Institute of Heath (NIH) but left in 1992 to form the nonprofit private research institute TIGR for the purpose of pursuing sequencing projects [11]. Venter and his team applied the whole genome shotgun approach to sequence the
1.83 mb Haemophilus Influenzae genome. During this time, the hierarchical sequencing approach
was still primarily used because computational methods had not yet been developed to handle the large amounts of data produced by whole genome shotgun sequencing approaches. Whole genome shotgun sequencing was still seen as infeasible for genomes larger than small viruses and bacteriophages. However, J Craig Venter and his team developed novel computational methods
that provided the capability to assemble the large number of Haemophilus Influenzae shotgun
sequencing reads. These computational methods were encapsulated in a software tool called the TIGR assembler [12]. This early assembler was able to assemble roughly 25,000 sequencing read fragments in about 30 hours on a SunSPARC station that had 40 Mbytes of RAM. Venter and his team also introduced the concept of paired-end reads, which made sequencing of larger genomes possible with the whole shotgun sequencing approach. Previously, only single end reads could be obtained from the M13 vectors used in sequencing projects.
Soon after the release of the Haemophilus Influenzae genome, several more sequencing
projects were undertaken by different research groups. In 1997, the Escherichia coli genome was
completed [13]. This project had initially begun in 1992 with manual methods and was completed in 1997 as automated sequencing technologies began to become available [14]. The first
eukaryote genome to be sequenced was Saccharomyces cerevisiae in 1997 [15]. For this
sequencing project, a large international consortium was formed with roughly 600 scientists collaborating from North America, Europe, and Japan [14]. Sequencing projects continued to
increase in ambition and the sequencing of the first complete animal genome, Caenorhabditis
eligans, was published in 1998 [16].
As sequencing projects during the early to mid 1990s continued to grow in scale and complexity, sequencing technologies continued to advance and improve. In 1995, Applied Biosystems (ABI) released the ABI PRISM 310 sequencer [17]. This sequencer was introduced
capillary electrophoresis, which greatly increased the throughput and automation of the
sequencing process. During the early 1990s, fluorescent dye labeling for DNA bases was also introduced, leading to the further automation of Sanger sequencing.
In 1998, Craig Venter and Applera, which was the parent company of ABI, formed the Celera Corporation for genome sequencing. This sequencing company relied heavily on ABI’s new automated sequencing machines [14]. Celera conducted the largest sequencing project up to
that time by completing the Drosophila Melanogaster genome in 1999 using whole genome
sequencing [18]. This was heralded as a great win for whole genome shotgun sequencing; however, there was still considerable debate whether or not shotgun sequencing would be suitable for sequencing of the human genome, a project that was in the midst of development at the time [19].
The Human Genome Project (HGP) began in 1990 and spanned until 2003, when it was formally declared as complete. In 1990, the National Institutes of Health and the Department of
sequencing the human genome [20]. This was a part of a greater long-term human genome initiative of fifteen years. In the first few years of the Human Genome Project until 1993, David Galas was the leader of the DOE’s genome project and James Watson led the NIH genome project until 1993, when they were succeeded by Aristides Patrinos and Francis Collins respectively. The chosen sequencing strategy for the Human Genome Project was a map-based hierarchical approach. A new five-year plan was established in 1993 to account for rapidly changing sequencing and other biomedical technologies. Goals outlined in this plan included the completion of a 2 to 5-cM genetic map and the completion of a sequence tagged site (STS) physical map at a resolution of 100kb [20]. Other goals included supporting informatics resource development and sequence technology development. The project was anticipated to cost a total of 200 million dollars a year, adjusted for inflation.
Several important landmarks occurred throughout the Human Genome Project. The first detailed map of the human genome was completed in 1994 [21]. Moderate resolution maps for chromosome 3, 11, 12, and 33 as well as a physical map with over 15,000 STS markers were released in 1995 [22][23][24] [25][26].
In 1998, Craig Venter formed Celera Genomics to sequence the human genome, leading to a sequencing race between Celera and the Human Genome Project. The Celera human genome-sequencing project relied on the whole genome sequencing approach in contrast to map based approaches for sequencing the human genome. In 2000, both the Human Genome Project and Celera announced that they had an initial draft of the human genome soon to be released [27] [28]. The completion of the human genome opened the floodgates for numerous other sequencing projects; the next few years after the release of the human genome saw rapid advances in sequencing techniques, computational technologies, and sequencing applications.
In 2005, next generation sequencing technologies were introduced into the field of DNA sequencing [29] [30]. These sequencing technologies greatly surpassed the older Sanger sequencing technologies in both throughput and speed. Next generation sequencing technologies revolutionized nearly all areas biomedical sciences, producing unprecedented massive amounts of biological data. This new type of sequencing technology brought with it numerous challenges such as extremely high coverage, higher error rates, and shorter sequence lengths in comparison to Sanger sequencing technologies. This deluge of data spurred the rapid development of novel computational analysis approaches. The next section describes next generation sequencing technologies in detail.
2.2
Next Generation Sequencing Technologies
Several types of next generation sequencing technologies were developed from 2005 until today. Earlier next generation sequencing technologies include sequencing by synthesis (Illumina), pyrosequencing (Roche 454), and sequencing by ligation (SOLID sequencing). We also discuss newer third generation sequencing technologies including single-molecule real-time sequencing (Pacific Biosciences) and ion semiconductor (Ion Torrent sequencing).
2.2.1
Sequencing by Synthesis: Illumina
Sequencing by synthesis is the foundation of the Illumina next generation sequencing technologies. The Illumina company was the result of the merger of four other biotech companies: Illumina , Solexa (Essex, UK), Manteia Predictive Medicine (Coinsins, Switzerland), and Lynx Therapeutics (Hayward, CA, USA) [31].
According to Illumina, there are four basic steps to its sequencing workflow: library preparation, cluster generation, sequencing, and data analysis [32]. In library prep, the DNA is first purified and then fragmented. Tagmentation is often used as the method for fragmentation [33]. Tagmentation relies on adaptor-loaded transposases to randomly shear the purified input DNA sample and add adaptors to the ends of the generated fragments at the same time. The next
indices, and terminal sequences that are complementary to the flow cell oligos are added [34]. Following this step is the cluster generation using bridge amplification. The DNA fragments with added adaptors are loaded into a flow cell which is a glass slide coated with two types of adhered oligos. The adaptors of the DNA fragments are complimentary to the oligo pairs bound to the flow cell. This causes the fragments to form complementary bonds with the first type of oligo. Polymerases then bind to the primer sequences on the DNA fragments and synthesize a complementary strand. The strands are denatured and the original DNA fragment is washed away. The other end of the synthesized DNA strand then hybridizes to the other type of oligo, forming a bridge shape. Polymerases then synthesize the complementary strand of the bridge DNA, to form a double stranded bridge. These strands are then denatured and the bridge amplification process is conducted repeatedly to generate clusters for each original DNA fragment.
After bridge amplification is complete, the reverse strands are cleaved and removed. The 3’ ends of the remaining forward strands are blocked to prevent unwanted priming at that end. Now sequencing by synthesis can begin [35]. In sequencing by synthesis, a primer is extended on the 5’ end. At each extension step a mixture of all four nucleotide types are added to the reaction. These nucleotides are fluorescently tagged and blocked at the 3’ OH to prevent incorporation of more than one nucleotide. Once a nucleotide is incorporated into each growing DNA strand, the remaining free nucleotides are washed away. Imaging is used to detect which nucleotide was incorporated for each cluster. The fluorophores and 3’ OH blocks are cleaved and washed away and the processes is begun again until the sequencing cycles are complete.
Illumina sequencing platforms are capable of producing both single-end and paired end reads. Paired-end reads are obtained by sequencing both ends of a DNA fragment library, producing pairs of forward and reverse reads with a known distance between them. The current
Illumina HiSeq X platform is capable of producing 1.8 Tb of data in a single run (5.3 – 6 billion reads passing filter) [36]. Paired end read lengths can be up to 150 bps in length. Read accuracy is greater than 99.5%, with a tendency towards substitution errors [35]. Please see Fig. 2.3 for an overview of the Illumina sequencing by synthesis approach.
2.2.2
Sequencing by Synthesis: Roche 454 Pyrosequencing
The Roche 454 next generation sequencing technologies rely on sequencing by synthesis as well. The 454 Life Sciences company was founded in 2000 by Jonathan Rothberg in Connecticut. This company specialized in pyrosequencing technologies. Roche acquired 454 Life Sciences in 2007 to bolster its sequencing efforts. After six years, Roche shuttered the 454 sequencing technologies in 2013 [37].
In the 454 pyrosequencing method, DNA is sheared into fragments and an adapter sequence is ligated to the resulting fragments ends [38]. The fragments are then bound via the adapter to beads such that there is one fragment per bead. These beads are then added to an oil emulsion containing a PCR reaction mixture. Once added to the oil emulsion, the fragments are clonally amplified. After clonal amplification is completed the beads are treated to produce single stranded fragments. The beads are added to a fibre-optic slide with pictitre wells on its surface. The pictitre wells are exactly sized to hold one fragment covered bead. Once the beads have been deposited in the pictitre wells, pyrosequencing can begin.
Pyrosequencing relies on a set of four enzymes, DNA polymerase, ATP sulfurylase, luciferase, and apyrase. [38]. Two substrates are added to this reaction as well, adenosine 5’ phosphosulfate (APS) and luciferin. First a DNA primer is added to the single stranded fragments adhered to the beads in the pictitre wells. Cyclically, each of the four dNTPs are added to the reaction individually. The polymerase enzyme extends the primers of the fragments with a complementary base to the current dNTP being added.
D) E) F) G) H) I) B) C) sequencing by Synthesis J) K) A C T G C
Figure 2.3: Illumina sequencing workflow. A) Tagmentation: DNA cleavage and addition of
adaptors by transposomes. B) DNA fragments with ligated adaptors. C) Reverse cycle amplification adds additional sequence binding sites and indices. D) Glass slide covered with a lawn of two different adaptors. E) Fragments hybridize with adhered adaptors. F) The complementary strand is synthesized. G) Adaptors on other end of fragment hybridize with second adaptor sequence to form bridges. H) Bridge amplification; bridges are now double stranded. I) Bridges are denatured to form single stranded DNA. J) G-I are repeated numerous times to form clusters. K) Reverse strands are cleaved and washed away. L) Sequencing by synthesis
When the dNTP is added to the growing DNA strand being synthesized by the polymerase an inorganic PPi is released. ATP sufurylase converts the released PPi into ATP in the presence of APS. The generated ATP provides the energy to luciferase to convert luciferin to oxylucifirein, which produces light that can be detected by a sensor. In this manner, it is possible to detect which beads had fragments to which the current cycled dNTP was added.
The GS FLX Titanium system of Roche, which was launched in 2008, could produce reads up to 700 bps in length with an accuracy of 99.9% [39]. The 454 sequencing technologies had a tendency for generating errors in homopolymer runs. This system produced 0.7 G of data in a single run. Fig. 2.4 displays the 454 pyrosequencing method.
2.2.3
Sequencing by Ligation: ABI SOLiD Sequencing
The company Applied Biosystems was founded in 1981 by Sam Eletr and Andre Marion [40]. By 2002, Applied Biosystems had revenues reaching $1.6 billion dollars and was the supplier of one of the first next generation sequencing platforms, the SOLiD system. In 2008, Applied Biosystems merged with the Invitrogen Corporation to for Life Technologies Corporation. Thermo Fisher Scientific acquired Life Technologies Corporation in 2014. For SOLiD sequencing, the input DNA sample is first sheared into a fragment library of the desired size. Adaptors are ligated to the ends of the resulting fragments. Similarly to 454 sequencing technologies, SOLiD sequencing technologies uses emulsion PCR to amplify the fragment library, where each fragment is hybridized to a bead-bound primer [41]. After amplification is complete, the beads are loaded onto a glass slide and covalently attached.
The SOLiD sequencing technologies use an intricate system of octamer probes to determine the ordering of nucleotide bases in a read. The first two nucleotides of the octamer probe are any of the sixteen possible permutations of nucleotides. The next three bases are degenerate universal bases that will hybridize with any of the nucleotides. The final three bases are also degenerate but carry a fluorescent tag.
A) B) C) Pyrosequencing AGTTCTTC
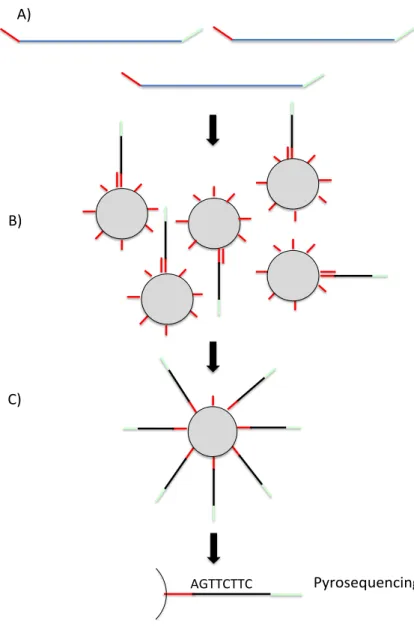
Figure 2.4: Roche 454 sequencing workflow. A) DNA is sheared and adapters are ligated to
the end of the resulting fragments. B) Each fragment is ligated to an adapter attached to a bead. (One fragment per bead.) C) The beads are emulsified in an oil-water mixture containing a PCR reaction mixture. The fragments are clonally amplified. D) Pyrosequencing is used to obtain the nucleotide ordering for each fragment.
This tag can be four different colors; each of the colors corresponds to four of the sixteen dinucleotide permutations in a two-base encoding system. First a primer hybridizes to the universal adapter, which attaches the fragments to the glass bead. The first probe is attached by ligation to the primer. The fluorescent tag is visualized and then the three end nucleotides with the tag are cleaved. The next probe is ligated to the first, visualized, and cleaved. This process is
continued for several cycles. There is a fluorescent recording for each dinucleotide at every 5th
position. To obtain the fluorescent encoding for the other bases, the primer is offset by one and the ligation process begins again. The primer is offset one nucleotide for a total of five rounds, until a fluorescent tag is determined for each consecutive dinucleotide pair in the read. The first base sequenced by the ligation method is known because it is part of the adaptor sequence. This known base along with the two-base encoding system is used to determine the remainder of the sequence of the read.
The current 5500 W Series Genetic Analyzers are capable of producing up to 320 Gb of data in a single run [42]. Read lengths can reach up to 75 for single-end reads and 50 for mate pair and paired-end reads. SOLiD sequencing by ligation is shown in Fig. 2.5.
2.2.4
Single Molecule Real-Time (SMRT) Sequencing: PacBio Sequencing
More recently, third generation sequencing technologies have been introduced to the sequencing market. These technologies are now producing reads that are much longer than reads lengths of previous next generation technologies. PacBio was founded in 2004 in California. This company introduced Single Molecule Real-Time (SMRT) sequencing [43].SMRT sequencing takes advantage of the inherent properties of the DNA polymerase to obtain long read lengths in a high throughput approach. First, hairpin adaptors are ligated to double DNA stranded templates to form structures called SMRTBells [44]. These SMRTBells are loaded onto a chip called a SMRT cell. These SMRT cells contain numerous nanophotonic visualization chambers called Zero Mode Waveguides (ZMW).
A C G T A C G T Two-base encoding 2nd base 1st base Adapter AA degenerate bases
cleaved bases with fluorescent flag
CG TG TC A) AA CG TG TC CA CC AT CT AC AT CT CA GA CC TC GG AC n n-1 n-2 n-3 n-4 B)
Figure 2.5: Sequencing by ligation. A) Two-base encoding. In the initial sequencing, a
fluorescent tag is determined for every fifth dinucleotide. B) To obtain the remainder of the sequence, the octamer probes are offset by one nucleotide for five rounds. At the n-1 position, the last base of the known adaptor is sequenced. Using the two-base encoding, this known base can be used to determine the first base of the read. This second base can then be used to determine the next base. This is continued until the sequence of the read is determined.
A polymerase is tethered to the bottom of the cylindrical ZMW, which then binds to a SMRTBell that drifts into the ZMW. Phospholinked nucleotides, where each of the four nucleotide types has a different fluorescent tag attached to the terminal phosphate, also drift into the ZMZ. During DNA synthesis, the polymerase cleaves away the terminal phosphates and fluorescent tag. While the polymerase is incorporating the nucleotide, the fluorescent tag is excited and emits light that is detected by a sensor. In this manner, the PacBio SMRT sequencing technology is able to determine the nucleotide ordering of a DNA SMRTBell.
The PacBio RS II system can produce between 35,000 and 75,000 reads per run [44]. Read lengths of the PacBio RS II system are 10,000 – 15,000 bp on average. The error rate of PacBio reads is much greater than other previous technologies at a single pass error rate of 13%. Fig. 2.6 provides an overview of the SMRT sequencing technology.
2.2.5
Nanopore Sequencing: Oxford Nanopore Technologies
Nanopore sequencing technologies are another third generation sequencing technology. Oxford Nanopore Technologies was founded in 2005 in the U.K. Their first sequencing platform, the MinION, was introduced in 2014 [45]. This company specializes in portable sequencing platforms enabled by nanopore sequencing technologies. The MinION system currently weighs less than 100g and can plug into a laptop for analysis. Oxford Nanopore Technologies also plans to release an even smaller sequencing platform called the SmidgeION, designed to be used with a smartphone.
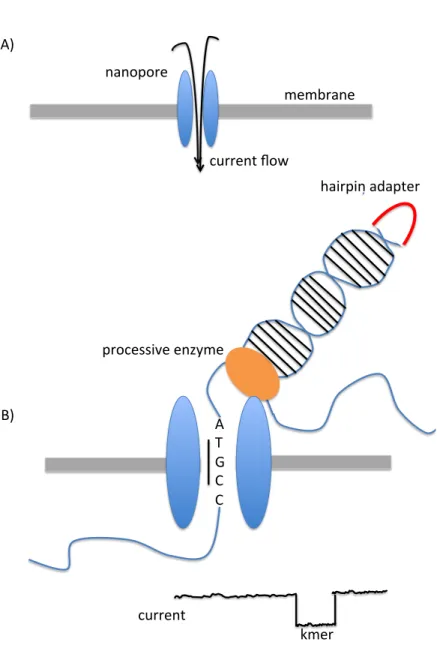
Nanopore sequencing electrophoretically guides DNA molecules through a protein nanopore [46]. These nanopores are located in an electrically resistant membrane that separates two electrolyte solutions. A small potential is generated across the membrane, which results in a current flowing through the nanopore. A molecule passing through the nanopore produces a characteristic modulation of the electrical current; this current change can be detected and used to identify the molecule.
SMRTBell hairpin adapter
double stranded DNA
ZMZ DNA template polymerase A) B) C) light source A C T
Figure 2.6: PacBio SMRT sequencing. A) Hairpin adaptors are ligated to double stranded
DNA to create SMRTBells. B) These SMRTBells diffuse into wells called Zero Mode Waveguides (ZMWs). These ZMWs are illuminated by a light source below the ZMW, allowing for a detection volume of 20 zeptoliters. The SMRTBells form a complex with a polymerase that is tethered to the bottom of the ZMW. The polymerase begins to synthesize a new DNA from the SMRTBell DNA template. C) Nucleotides labeled with fluorescent tags also drift into the ZMW. As the polymerase incorporates a nucleotide into the growing DNA chain, a light excites the fluorescent tag, which then emits a characteristic light allowing for the identification of the base.
To sequence DNA, hairpin adapters are first ligated to the ends of DNA fragments [47]. Processive enzymes are added to the DNA fragments to form complexes that are then captured by the nanopores. The processive enzyme ensures that the DNA strand passes through the nanopore in a unidirectional manner and one base at a time. The current changes induced by the DNA sequence are read 3-6 nucleotides at a time, called k-mers. In this manner, the entire DNA sequence can be read. The hairpin adapter allows for both of the strands of a double stranded DNA fragment to be read at the same time, producing more accurate results.
The MinION sequencer can produce between 5-10 Gb of sequence data in a single run. Read lengths can reach up to hundreds of kilobases [48]. However, the error rate of the nanopore sequencing technologies still remains high. A recent study found the error rate of the MinION sequencer to be 38.3% [49]. An illustration of nanopore sequencing can be found in Fig. 2.7.
2.3
FASTA/FASTQ File Format
The FASTA/FASTQ plain text formats are commonly used to represent the output of next generation sequencing technologies. This output includes both the sequence read data and its associated quality values, which represent the estimated probability of base-calling error per base. The FASTA format represents the sequence data only, while the FASTQ format represents both the sequence data and quality values.
In FASTQ format, four lines are typically used to describe a sequencing read and its associated quality data. The first line always begins with ‘@’ and contains the description or name of the read. The next line contains the sequence data, typically the IUPAC codes for DNA or RNA. The next line begins with ‘+’ and contains optional information; this line is often times left blank. Finally, the quality values formatted in ASCII characters make up the last line of the FASTQ entry. The FASTA format contains sequence information only. Each sequence entry is limited to two lines. The first line begins with ‘>’ and contains the description or name of the sequence. The next line contains sequence information.
Figure 2.7: Nanopore sequencing. A) A nanopore is inserted into a membrane separating two electrolyte solutions. A potential across the membrane results in a current running through the nanopore. Molecules passing through the nanopore create characteristic disruptions in the current. B) A processive enzyme unzips the double stranded DNA and passes single stranded DNA through the nanopore. Resulting disruptions in the current are read as sequential nucleotide kmers in the DNA sequence. A hair pin adaptor allows for both strands of the DNA to be read at the same time, producing more accurate results.
membrane nanopore current flow A) B) A T G C C current kmer hairpin adapter processive enzyme
The first FASTQ formats were used for representing Sanger sequencing reads and their
associated quality values [50]. The PHRED quality score system is defined as QPHRED = -10 x
log10(Pe), where Pe is the estimated error probability. In FASTQ files the PHRED scores are
encoded as ASCII values 33-126 = QPHRED + 33.
With the introduction of next generation sequencing technologies, several other variations of quality values were introduced. The Solexa FASTQ format was introduced in 2004.
The Solexa quality values are given by QSOLEXA = -10 x log10 (!!!!!
!) and are encoded in FASTQ
format as QSOLEXA + 66. Illumina continued to use the Solexa quality score format for sometime
but then switched back to PHRED encoding for its Ilumina 1.3+ quality score format. In FASTQ files, the Illumina 1.3+ quality scores are offset by 64. Please see Fig. 2.8 for an example of the FASTQ format.
2.4
Next Generation Sequencing Applications
With the advent of next generation sequencing in 2005 came an explosion of exciting biomedical applications. In this section, we briefly describe several examples of applications of next generation sequencing technologies. The applications of next generation sequencing technologies continue to rapidly expand as they are only limited by the imagination and innovation of research scientists.
2.4.1
Whole Genome Sequencing
Next generation sequencing technologies have allowed for the sequencing of thousands of new genomes. The ability to sequence whole genomes is the foundation that has provided massive amounts of information, revolutionizing all areas of biomedical research such as cancer genomics, infectious disease research, and many more.
FASTQ Format @read1 ATCGATAGGGATAGCGGGGCTAGAGGAAAAGGGCCC +read1 IIIIIIIIIIIIIIII...////4AIIIIIIIII;;;FDC2ABDDBBFF@###### FASTA Format >read1 ATCGATAGGGATAGCGGGGCTAGAGGAAAAGGGCCC
2.4.2
RNA-Seq
RNA-Seq is an approach using next generation sequencing technologies to conduct transcriptome profiling [51]. The transcriptome is the complete set of mRNA expressed from the genome of an organism. The ability to identify mRNA transcripts and their quantity provides important insights into areas such as organism development, disease progression, and organism response to environmental factors.
2.4.3
Metagenomics
Metagenomics is the sequencing and analysis of a community of microorganisms recovered directly from the environment [52]. The ability to sequence a community of organisms at the same time can reveal complex interactions between members, governing community homeostasis and biological function. Metagenomics also allows for the sequencing of microorganisms that are difficult to culture. Examples of biomedically important microorganism communities that have been studied using metagenomics is the human oral and gut microbiome [53][54].
2.4.4
Cancer Genomics
Next generation sequencing technologies have had a major impact on the field of cancer genomes. Paired-end reads


![Figure 4.4: A suffix array SA constructed for string S = ACGTAACGG. The lexicographical sorting of the suffixes of S is given by S[SA[j], 9]](https://thumb-us.123doks.com/thumbv2/123dok_us/749477.2594673/60.918.287.697.386.624/figure-suffix-constructed-string-acgtaacgg-lexicographical-sorting-suffixes.webp)