This thesis must be used in accordance with the
provisions of the Copyright Act 1968.
Reproduction of material protected by copyright
may be an infringement of copyright and
copyright owners may be entitled to take
legal action against persons who infringe their
copyright.
Section 51 (2) of the Copyright Act permits
an authorized officer of a university library or
archives to provide a copy (by communication
or otherwise) of an unpublished thesis kept in
the library or archives, to a person who satisfies
the authorized officer that he or she requires
the reproduction for the purposes of research
or study.
The Copyright Act grants the creator of a work
a number of moral rights, specifically the right of
attribution, the right against false attribution and
the right of integrity.
You may infringe the author’s moral rights if you:
- fail to acknowledge the author of this thesis if
you quote sections from the work
- attribute this thesis to another author
- subject this thesis to derogatory treatment
which may prejudice the author’s reputation
For further information contact the University’s
Director of Copyright Services
Analysing, visualising and supporting collaborative
learning using interactive tabletops
Roberto Martinez Maldonado
A thesis submitted in fulfilment of the requirements
for the degree of Doctor of Philosophy in
the School of Information Technologies at
The University of Sydney, Australia.
Computer Human Adapted Interaction Research Group
School of Information Technologies
Faculty of Engineering and Information Technologies
The University of Sydney, Australia
iii
Abstract
Collaboration in learning contexts can promote students to externalise their personal perspectives in order to reach shared understanding and integrate individual with group knowledge. It has been recognised that collaborative learning can enhance the capacity of thinking by triggering particular learning mechanisms that cannot be activated by individual learning. Additionally, collaboration skills are often considered to be key conditions for value generation beyond the classroom, into the workplace. However, students working together do not spontaneously collaborate, even if they are supported by computer systems. Thus, teachers have a central role in providing feedback and helping students to learn to collaborate effectively. However, in classroom environments, even in small group activities, it is challenging for teachers to provide students the attention that they may require and be aware of the process followed by each group. Teachers need tools that can provide them with coarse-grained feedback that allows them to monitor what is happening in their classes.
Multi-user pervasive shared devices have great potential for addressing this situation. In particular, interactive tabletops provide an enriched space where students can communicate face-to-face with each other and, at the same time, interact with a large work area that has access to digital content allowing the creation of persistent artefacts. Tabletops provide an environment in which students can decide whether they work in parallel, or together as a group. A slightly hidden potential of interactive tabletops, that this thesis explores, is that they can open new opportunities for capturing learner’s digital traces of activity. These data can be analysed through a variety of techniques, from simple statistics or visualisations that describe general aspects of student’s activity, to data mining and user modelling techniques that can be used to find patterns or train models of interaction. Furthermore, the analysis of such data can provide means to help teachers and researchers inspect the process followed by students and recognise patterns of group behaviour.
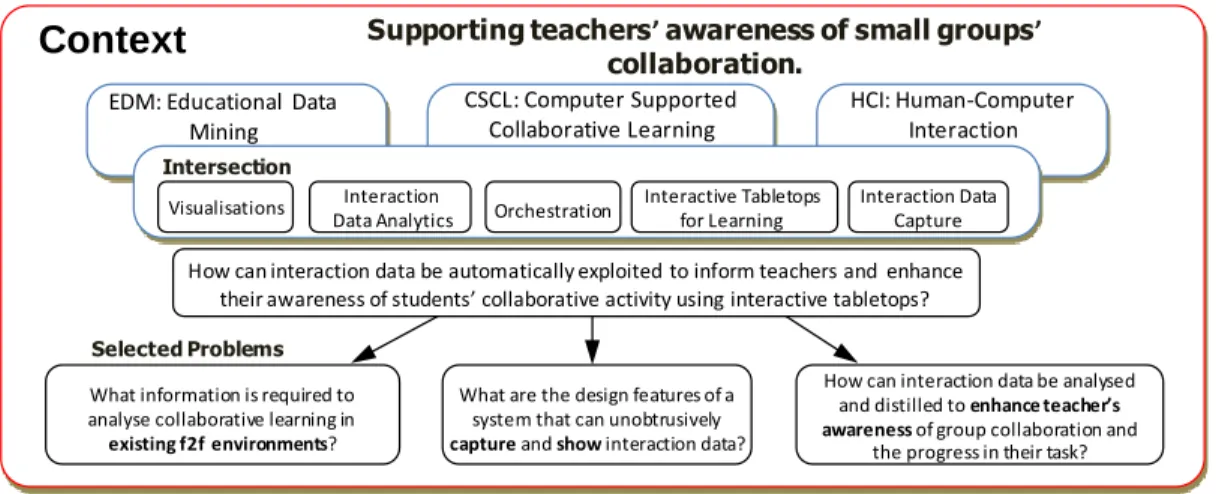
We identify a number of open issues that are currently present in each of the three fields involved in this thesis: tabletops in education from a Computer Supported Collaborative Learning (CSCL) perspective; Educational Data Mining and analytics (EDM); and research on interactive tabletop applications from a Human-Computer Interaction perspective (HCI). The intersection of these fields raises a challenging question: How can interaction data be automatically exploited to inform teachers and enhance their awareness of student’s collaborative activity using interactive tabletops? One of the first challenges is in forming a basis for the design of the tabletop environment and its associated collaborative interfaces, so that they can capture the required collaboration data. This must be done in a manner that makes it possible to do downstream analysis of the data and present it in a form that facilitates understanding of the collaborative learning processes.
The key contribution of this thesis is a novel approach to design, implement and evaluate the conceptual and technological infrastructure that captures student’s activity at interactive tabletops and analyses these data through Interaction Data Analytics techniques to provide support to teachers by enhancing their awareness of student’s collaboration. To achieve the above, this thesis presents a series of carefully designed user studies to understand how to capture, analyse and distil indicators of collaborative learning. We perform this in three steps: the exploration of the feasibility of the approach, the construction of a novel solution and the execution of the conceptual proposal, both under controlled conditions and in the wild. A total of eight datasets were analysed for the studies that are described in this thesis.
We begin with foundational exploratory studies on collocated environments that enable us to understand the requirements that are needed to analyse and discover patterns of face-to-face interaction. The results of that study, in addition to the foundations of existing literature, are used to inform a set of design requirements for building an effective tabletop environment that can
iv
tabletop to differentiate which learner is touching what and which student is speaking in a non-intrusive manner. The next contribution is the design and validation of a set of visualisations of student’s interactions that can be shown to researchers, teachers or students, to foster awareness and reflection. These visualisations also serve as building blocks to create a teacher’s dashboard that can show collaboration indicators of multiple groups, to be used either in real-time or for post-hoc analysis.
From the data analysis perspective, this thesis also contributes to the deep exploration of collaborative interactions by integrating data coming from multiple sources (touch interaction with the shared device, speech differentiation, characteristics of the artefacts and measures of learning). A series of studies in the lab offers the opportunity to analyse a large amount of detailed learner’s data. Such analysis includes the application of data mining and statistical techniques to discover meaningful patterns that can help differentiate high from low achieving groups.
Finally, the contribution that is most strongly associated with the real practice is the implementation of a solution for an authentic classroom using multiple interactive tabletops. This classroom environment offers a number of functionalities for the teacher to orchestrate the script of the classroom session and look at live-visualisations of the on-task progress of each small group. This approach can help teachers decide which group to attend next. The analysis also includes the discovery of trends in students interactions that can make visible aspects of collaborative work that may not be easily seen without the use of such technology.
Our work pioneered in a number of areas including the application of data mining techniques to study collaboration at the tabletop, a plug-in solution to add user-identification to a regular tabletop using a depth sensor and the first multi-tabletop classroom used to run authentic collaborative activities associated with the curricula.
In summary, while the mechanisms, interfaces and studies presented in this thesis were mostly explored in the context of interactive tabletops, the findings are likely to be relevant to other forms of groupware and learning scenarios that can be implemented in real classrooms. Through the mechanisms, the studies conducted and our conceptual framework this thesis provides an important research foundation for the ways in which interactive tabletops, along with data mining and visualisation techniques, can be used to provide support to improve teacher’s understanding about student’s collaboration and learning in small groups.
v
Acknowledgements
First and foremost, I would like to express my sincerest gratitude to my supervisors, Kalina Yacef and Judy Kay, for their unconditional guidance and support in this journey. I could not have had better supervisors. I learnt so much from their knowledge in their respective areas of expertise, their creativity, their discussion skills and the ways they come up with new ideas.
Four years ago, Judy gave me the opportunity to start this training process to become a researcher. I am very grateful for her support, for her endless patience, for letting me play with some of her ideas and for her remarkable trust in her students’ capabilities. Judy was my main adviser for the topics of my thesis related to HCI, student modelling and pervasive computing. I really learnt from her the innovative side of science, and our need to be open-minded and brave to explore novel and, sometimes, unconventional ideas. By contrast, Kalina taught me another side of research that is equally important. I learnt from her to think carefully about the problem, to put order in the stream of ideas and narrow down the scope of innovation to make those ideas feasible and tangible. Kalina guided me in the fields of data mining, visualisations and analytics. I am really grateful that I had the opportunity of being in the middle of two complementing styles. I learnt from Judy and Kalina that it is possible to produce many ideas and then make them happen.
Secondly, I wish to extend my sincere gratitude to the collaborators I had in this journey. A large part of my gratitude goes to Yannis Dimitriadis, from the University of Valladolid. He was very interested in my research during his sabbatical visit in Sydney. Without being his initial intention, he became my main collaborator in this project, a mentor and a friend. Also thank you for showing me the human and humble side of being a researcher. I am deeply indebted to my friend and colleague Maresa Edbauer, who made it possible to bring my research to the real world. She arranged the links with the School of Business of our university to deploy the products of my research in an authentic classroom. This thesis would not be the same without your help.
I am also grateful with my initial collaborators. Thanks Jim Wallace for letting us explore the data you collected, at the University of Waterloo, to start testing our initial ideas. Thanks Ahmed Kharrufa and Ammar Al-Qaraghuli for trusting in our ideas and pioneering with us the exploration of tabletop data using data mining techniques. I would like to thank to the co-authors from my own group (CHAI): Andrew Clayphan and Chris Ackad. Also thanks to Beat Schwendimann, from the CoCo lab, for your input in the area of concept mapping. Thanks John Kinnebrew and Gautam Biswas, for letting us use your software package that we use in some studies to analyse our data.
I would also like to thank Smart Services CRC, CONACYT (Consejo Nacional de Ciencia y Tecnologia), and Fundación Pablo García for sponsoring different parts of my candidature and my research project. I am especially grateful to The University of Sydney, through its International Office, for the World Scholars award that covered all the fees during my candidature.
I am also grateful to the following colleagues whose suggestions and encouragement were invaluable throughout my graduate career at The University of Sydney: Luiz Pizzato, Rainer Wasinger, Bob Kummerfeld, Anthony Collins, Richard Gluga, Irena Koprinska, Josiah Poon, Farahnaz Yekeh, Tina Yu, Debjanee Barua, Harry He, Peter Eades, Joshua Akehurst, Peter Goodyear, Rafael Calvo, Peter Reimann, Martin Tomitsch, Daniel Brem, Moonyati Yatid and Joseph Michaels.
I would like to express my sincere appreciation to research scientists who directly or indirectly helped me learn the many aspects of being a researcher or gave me very useful feedback
vi
Woods, Gordon McCalla, Agathe Merceron, Armin Weinberger, Emma Mercier, Alejandra Martínez Monés, Luis Pablo Prieto, Juan Muñoz, Juan Ignacio Asensio, Juan Moncada Bolon, Mario Moreno, Ulrich Von Zadow, Antonio Kruger, Patrick Baudisch, Raimund Dachselt, Hideki Koike, Kentaro Fukuchi and Florian Daiber.
Thanks are also due to the invaluable help I received from the technical staff of my school, including William Calleja, Witold Janus, Michael Rados, Greg Ryan and Arthur Scott. In the same way, I want to thank to the admin staff that was there whenever I needed to solve administrative and logistic problems, usually at last minute: Evelyn Riegler, Lyssis Pretorius, Miranda Jelbart, Shari Lee and Katie Yang.
I would also like to acknowledge the contribution of the people who participated in the experiments and the students that were keen to help us improve our deployments in the classroom.
Thank you to all of my friends and teachers in Campeche, Merida, Sydney and elsewhere in the world.
Most importantly, I would like to show my gratitude to all my family, who motivated me and supported me to do my best. Thank you to my parents, Yary and the kids for your love and permanent support through this challenging but amazing period of my life.
vii
Preface and Notes
Publications during candidature
Journal articleR. Martinez-Maldonado, Y. Dimitriadis, A. Martinez-Monés, J. Kay, and K. Yacef. Capturing and analyzing verbal and physical collaborative learning interactions at an enriched interactive tabletop.
International Journal of Computer-Supported Collaborative Learning, 8(4), 455-485 (2013b)
.
Conference papers 2013
R. Martinez-Maldonado, J. Kay, K. Yacef, M. Edbauer and Y. Dimitriadis. MTClassroom and MTDashboard: Supporting Analysis of Teacher Attention in an Orchestrated Multi-tabletop Classroom In International Conference on Computer-Supported Collaborative Learning, CSCL 2013, pages 119-128, (2013a).
R. Martinez-Maldonado, J. Kay and K. Yacef. An automatic approach for mining patterns of collaboration around an interactive tabletop. In International Conference on Artificial Intelligence in Education, AIED 2013, pages 101-110, (2013c).
R. Martinez-Maldonado, K. Yacef and J. Kay. Data Mining in the Classroom: Discovering Group’s Strategies at a Multi-tabletop Environment. In International Conference on Educational Data Mining, EDM 2013, pages 121-128, (2013d).
A. Kharrufa, R. Martinez-Maldonado, J. Kay, and P. Olivier. Extending tabletop application design to the classroom. In International Conference on Interactive Tabletops and Surfaces, ITS 2013, pages 115-124, (2013b).
A. Clayphan, R. Martinez-Maldonado and J. Kay. Open learner models to support reflection on
brainstorming at interactive tabletops. In International Conference on Artificial Intelligence in Education, AIED 2013, pages 683-686, (2013d).
2012
R. Martinez-Maldonado, J. Kay, K. Yacef, M. Edbauer and Y. DImitriadis. Orchestrating a Multi-tabletop Classroom: from design to enactment and reflection. In International Conference on Interactive Tabletops and Surfaces, ITS 2012, pages 119-128, (2012d).
R. Martinez-Maldonado, J. Kay, K. Yacef, and B. Schwendimann. Unpacking traces of collaboration from multimodal data of collaborative concept mapping at a tabletop.In International Conference of the Learning Sciences: The Future of learning, ICLS 2012, pages 241-245, (2012g).
R. Martinez-Maldonado, K. Yacef, J. Kay, and B. Schwendimann. An interactive teacher’s dashboard for monitoring multiple groups in a multi-tabletop learning environment. In Proceedings of Intelligent Tutoring Systems, ITS 2012, pages 482-492, (2012f).
R. Martinez-Maldonado, J. Kay and K. Yacef. Analysing knowledge creation and acquisition from individual and face-to-face collaborative concept mapping. In Proceedings of Conference on Concept Mapping, CMC 2012, pages 17-24, (2012c).
2011
R. Martinez-Maldonado, K. Yacef, J. Kay, A. Kharrufa, and A. Al-Qaraghuli. Analysing frequent sequential patterns of collaborative learning activity around an interactive tabletop. In 4th International Conference on Educational Data Mining, EDM2011, pages 111-120, (2011f).
R. Martinez-Maldonado, A. Collins, J. Kay, and K. Yacef. Who did what? who said that? COLLAID: an environment for capturing traces of collaborative learning at the tabletop. In ACM International Conference on Interactive Tabletops and Surfaces, ITS 2011, pages 172-181, (2011b).
R. Martinez-Maldonado, J. Kay, and K. Yacef. Visualisations for longitudinal participation, contribution and progress of a collaborative task at the tabletop. In International Conference on Computer Supported Collaborative Learning, CSCL 2011, pages 25-32, (2011d).
R. Martinez-Maldonado, J. Kay, K. Yacef, and J. Wallace. Modelling symmetry of activity as an indicator of collocated group collaboration. In 19th International Conference on User Modeling, Adaptation and Personalization, UMAP 2011, pages 196-204, (2011c).
viii
Intelligence in Education, AIED 2011, pages 196-204, (2011e).
2010
R. Martinez-Maldonado, J. Kay, and K. Yacef. Collaborative concept mapping at the tabletop. In ACM International Conference on Interactive Tabletops and Surfaces, ITS 2010, pages 207-210, (2010a).
Workshop papers
A. Clayphan, R. Martinez-Maldonado, and J. Kay. Designing OLMs for Reflection about Group
Brainstorming at Interactive Tabletops. In Workshop on Intelligent Support for Learning in Groups held at International Conference on Artificial Intelligence in Education (AIED 2013), Memphis, USA. (2013c).
R. Martinez-Maldonado, A. Clayphan, J. Kay, and K. Yacef. Designing tools for supporting teacher’s
orchestration and awareness at a multi-tabletop classroom. In Workshop on Classroom Orchestration
- held at International Conference on Learning Sciences (ICLS 2012), Sydney, Australia. (2012a). A. Clayphan, R. Martinez-Maldonado, K. Yacef, and J. Kay. Design for Negotiated Scripted Tabletop
Collaboration. In Workshop on Digital Ecosystems for Collaborative Learning (DECL 2012) - held at International Conference on Learning Sciences (ICLS 2012), Sydney, Australia. (2012).
R. Martinez-Maldonado, K. Yacef, and J. Kay. Towards providing intelligent support to enhance collaborative learning at the tabletop. In Workshop on Intelligent Support for Learning in Groups (DECL 2012) - held at International Conference on Intelligent Tutoring Systems (ITS 2012), Creete, Greece. (2012e).
R. Martinez-Maldonado, A. Clayphan, K. Yacef, J. Kay, and C. J. Ackad. Sensing, tracking and modelling with ignition - a framework for supporting classroom collaboration. In Workshop on Educational Interfaces, Software, and Technology 2012. held at CHI 2012, Austin, USA, (2012b).
C. Ackad, A. Clayphan, R. Martinez-Maldonado, and J. Kay. Seamless and continuous user identification for interactive tabletops using personal device handshaking and body tracking. In Work-In-Progress CHI '2012, Austin, USA, pages 1775-1780, (2012).
R. Martinez-Maldonado, C. Ackad, K. Yacef, and J. Kay. Designing tabletop-based systems for user modelling of collaboration. In Workshop on Adaptive Support for Team Collaboration (ASTC2011) held at International Conference on User Modeling, Adaptation and Personalization,(UMAP2011), Girona, Spain. pages 47-51, (2011a).
R. Martinez-Maldonado, K. Yacef, and J. Kay. Learning modelling of collaborative concept mapping at a tabletop applying data mining. In Workshop on Natural User Interfaces: multi-touch and gestural interactions. Melbourne, Australia. (2010b).
Selected Press:
Technology in Education magazine. A teacher, a classroom and four interactive tabletops.. term 3, 2012, page 39.
Media coverage:
The Sydney Morning Herald. The classroom, but not as we know it: technology to revolutionise schools. July 16, 2012
Other papers:
Edited proceedings:
R. Martinez-Maldonado, J. Slotta, P. Dillenbourg, A. Clayphan, M. Tissenbaum, B. Schwendimann and C. Ackad. Digital Ecosystems for Collaborative Learning: Embedding Personal and Collaborative Devices to Support Classrooms of the Future, - held at International Conference on Learning Sciences (ICLS 2012), Sydney, Australia. 2012.
Publications in Spanish:
M. Moreno and R. Martinez-Maldonado. Modelo clasificador para predecir el desempeño escolar terminal de un estudiante. In Conferencia Iberoamericana en Sistemas, Cibernética e Informática (CISCI 2011), pages 47-51, 2011.
D. Moreno, D. Cano, C. Hau, R. Martinez-Maldonado. and M. Moreno. Integración de un Tabletop utilizando Kinect como Herramienta Educativa. In Congreso Nacional de Ingenieria Electrica y Electronica del Mayab (CONIEEM2011), 2011.
Doctoral Symposium:
R. Martinez-Maldonado. Mining the collaborative learning process at the tabletop to offer adapted support. In ACM International Conference on Interactive Tabletops and Surfaces, ITS 2011, 2011. Conference Symposia:
M. Evans, J. Rick, M. Horn, C. Shen, E. Mercier, J. McNaughton, S. Higgins, M. Tissenbaum, M. Lui ,J. Slotta, A. Clayphan, R. Martinez-Maldonado. Interactive Surfaces and Spaces: A Learning Sciences Agenda. In International Conference of the Learning Sciences: The Future of learning, ICLS 2012, pages 78-85, 2012.
ix
Peer-reviewed Posters:
R. Martinez-Maldonado, K. Yacef, and J. Kay. Speaking (and touching) to learn: a method for mining the digital footprints of face-to-face collaboration. In 5th International Conference on Educational Data Mining, EDM2012, 2012
Sources & Original Work
Original material of my own from the above publications has been included in this thesis, with a citation to the appropriate publication appearing at the beginning of each chapter. Other external sources are cited, with the bibliography appearing at the end of the thesis. The background chapter (Chapter 2) contains figures from external sources, with permission from their authors. In such a case, the reference to the source of the figure is indicated in the caption.
Use of Work by Others
Two out of the eight student’s datasets that are analysed in this thesis were collected through studies conducted by fellow researchers. The first of them was collected by Wallace et al. (2009) from an interconnected multi-display collaborative environment that allows students to work face-to-face. The second dataset was collected by Kharrufa et al. (2010) and consists of the differentiated student’s logged actions at a pen-based collaborative learning tabletop application. However, the pre-processing and analysis of these data are part of the original contributions of this thesis.
Human Ethics
Studies presented in this thesis were conducted under human ethics protocol number 13061, entitled “Data Mining on the process of concept mapping at the tabletop”. It was approved by The University of Sydney Human Research Ethics Committee on 4th July, 2010. The most updated Participant information statements and consent forms can be requested by email.1
1
x
Contents
Abstract ... iii
Acknowledgements ... v
Preface and Notes... vii
Contents ... x
List of Figures... xvi
List of Tables ... xxi
1. Chapter 1: Introduction ... 1
1.1. Context and Motivation ... 1
1.2. Thesis Statement... 3
1.3. Thesis Goals ... 5
1.4. Thesis Contributions ... 6
1.5. Research Methodology and Validation Methods ... 8
1.6. Thesis Structure ... 10
2. Chapter 2: Background ... 12
2.1. Introduction ... 12
2.2. Collaborative Learning and Interaction Analysis ... 13
2.2.1. Group Cognition: Model of Collaborative Knowledge Building ... 14
2.2.2. Indicators of Collaborative Learning ... 15
2.2.3. Classroom Orchestration... 17
2.2.4. Section Summary ... 18
2.3. Tabletops for Learning... 19
2.3.1. Tabletops Affordances to Support Collaboration and Collaborative Learning ... 19
2.3.2. Tabletops Affordances for Data Capture or Context-awareness ... 23
2.3.3. Tabletop User Interfaces for Collaborative Learning ... 27
2.3.4. Tabletop-supported Collaboration Data Analysis ... 30
2.3.5. Multiple Tabletops in the Classroom ... 32
2.3.6. Section Summary ... 34
2.4. Analytics and Data Mining of Collaborative Learning... 34
2.4.1. Visualising Collaboration and Group Learner Models ... 35
xi
2.4.3. Section Summary ... 38
2.5. Learning Tool: Tabletop Concept Mapping ... 38
2.5.1. Collaborative Concept Mapping ... 40
2.5.2. Tabletop Concept Mapping ... 42
2.5.3. Section Summary ... 44
2.6. Open Issues ... 45
2.7. Chapter Summary ... 46
3. Chapter 3: Conceptual Framework ... 48
3.1. Introduction ... 48
3.2. The Conceptual Framework (TSCL-CF) ... 49
3.3. The Learning Situation ... 50
3.4. Theoretical Foundation (TF) ... 51
3.5. Data Capture Foundation (DCF) ... 52
3.5.1. Data Sensing System (SS) ... 54
3.5.2. Data Pre-processing System (DPS) ... 55
3.6. Data Analytics Foundation (DAF) ... 56
3.7. Data Presentation Foundation (DPF) ... 57
3.8. Implications for the Implementation of the TSCL-CF ... 58
3.9. Chapter Summary ... 59
4. Chapter 4: Exploring Other Datasets for Analysing Face-to-face Collaboration ... 60
4.1. Introduction ... 60
4.2. Classifying Periods of Collaboration ... 61
4.2.1. Motivation... 62
4.2.2. Context of the Study and Data Exploration ... 62
4.2.3. Categorising Collaborative Learning Behaviour ... 64
4.2.4. Evaluation ... 66
4.2.5. Section Summary ... 67
4.3. Modelling Symmetry as an Indicator of Collaboration ... 68
4.3.1. Motivation... 68
4.3.2. Context of the Study ... 68
4.3.3. Model of Symmetry as an Indicator of Collaboration ... 70
4.3.4. Evaluation of the Model of Symmetry: Clustering Groups ... 71
4.3.5. Section Summary ... 73
4.4. Mining Patterns that Distinguish High from Low Collaboration ... 73
4.4.1. Motivation... 74
4.4.2. Context of the Study and Data Exploration ... 74
xii
4.4.5. Method 2: Authorship in the post processing ... 78
4.4.6. Section Summary ... 79
4.5. Insights, Considerations and Lessons Learnt ... 80
4.6. Chapter summary... 81
5. Chapter 5: Tabletop Software and Infrastructure: CMATE and COLLAID ... 82
5.1. Introduction ... 82
5.2. Design Guidelines to Capture and Format Students Data ... 84
5.2.1. Principles for Capturing Students Data ... 85
5.2.2. Principles for Formatting and Mining Tabletop Data ... 86
5.2.3. Section Summary ... 87
5.3. CMATE: Collaborative Concept Mapping at the Tabletop ... 87
5.3.1. Design Process ... 88
5.3.2. System Final Features ... 90
5.3.3. Implementation Details... 91
5.3.4. Section Summary ... 92
5.4. COLLAID: an Enhanced Interactive Tabletop System ... 92
5.4.1. The Multimodal Environment ... 93
5.4.2. Case Study and Validation of the System ... 95
5.4.3. Section Summary ... 99
5.5. Chapter summary... 99
6. Chapter 6: Visualisation of Group Indicators and Teacher’s Dashboard ... 100
6.1. Introduction ... 100
6.2. Group Indicators and Traces of Collaboration ... 102
6.2.1. The Learning Environment ... 102
6.2.2. Dataset Description ... 104
6.2.3. Group Indicators and Data Analysis ... 104
6.2.4. Results ... 105
6.2.5. Discussion ... 106
6.2.6. Section Summary ... 108
6.3. Visualisations of Collaboration at the Tabletop ... 109
6.3.1. The Learning Environment ... 109
6.3.2. Design of Visualisations ... 110
6.3.3. Evaluation ... 112
6.3.4. Results ... 114
6.3.5. Section Summary ... 116
xiii
6.4.1. The Learning Environment ... 117
6.4.2. The Interactive Teacher’s Dashboard ... 117
6.4.3. The Class Level: Aggregated Summaries ... 117
6.4.4. The Detailed Group Level: Specific Group Summaries. ... 118
6.4.5. Evaluation ... 120
6.4.6. Results and Discussion... 121
6.4.7. Section Summary ... 123
6.5. Chapter summary ... 123
7. Chapter 7: Data Analytics of Collaboration in a Single-Tabletop Environment ... 125
7.1. Introduction ... 125
7.2. Larger-Scale Study Design: study in the lab ... 127
7.2.1. Study Design and Participants ... 127
7.2.2. Individual Concept Mapping ... 129
7.2.3. Collaborative Concept Mapping ... 130
7.2.4. Quantitative Assessment of Quality of Collaboration ... 132
7.2.5. Section Summary ... 132
7.3. Mining Traces of Student’s Activity ... 132
7.3.1. Research Questions ... 133
7.3.2. Preliminary Analysis ... 134
7.3.3. Approach ... 137
7.3.4. Distinguishing High from Low Collaboration ... 137
7.3.5. Discovering Frequent Patterns. ... 138
7.3.6. Distilling Frequent Patterns... 146
7.3.7. Discussion ... 147
7.3.8. Section Summary ... 148
7.4. Analysing Traces of the Student’s Products... 149
7.4.1. Research Questions ... 149
7.4.2. Data Description and Measures of Similarity and Collaboration ... 150
7.4.3. Evaluation and Discussion ... 151
7.4.4. Section Summary ... 152
7.5. Chapter summary ... 153
8. Chapter 8: Data Analytics of Collaboration in the Classroom ... 155
8.1. Introduction ... 155
8.2. The Learning Environment: MTClassroom and MTDashboard ... 158
8.2.1. MTClassroom Design Guidelines ... 158
8.2.2. Technical Infrastructure (Hardware)... 159
xiv
8.4. Supporting Teacher’s Design and Design Assessment ... 165
8.4.1. Practical Evaluation: from Design to Enactment ... 165
8.4.2. Results and Teacher’s Reflection ... 167
8.4.3. Section Summary ... 170
8.5. Classroom Activity Design (Tutorials 2) ... 170
8.6. Supporting Teacher’s Awareness and Control ... 172
8.6.1. Study Description... 172
8.6.2. Analysis and Discussion ... 174
8.6.3. Section Summary ... 177
8.7. Mining Student’s Actions ... 177
8.7.1. Study Description... 178
8.7.2. Methods: Sequence Mining and Process Mining ... 179
8.7.3. Sequence Mining Results ... 181
8.7.4. Process Mining Results... 183
8.7.5. Section Summary ... 184
8.8. Chapter summary... 185
9. Chapter 9: Conclusions and Future Work ... 188
9.1. Summary of Contributions... 188
9.2. Future Directions ... 193
Bibliography ... 196
A. Appendix ... 211
A.1. TSCL-CF Full Diagram ... 211
A.2. COLLAID Infrastructure and Evaluation ... 212
A.2.1. Infrastructure ... 212
A.2.2. Evaluation... 214
A.2.3. Results ... 216
A.3. Exploring User Identification with COLLAID ... 217
A.3.1. Prototype Motivation ... 218
A.3.2. Infrastructure ... 219
A.3.3. Example User View ... 220
A.4. Learning Materials for the Studies in Chapter 8 ... 222
A.4.1. Foundations of Management: Learning Material for the Case... 222
A.4.2. Foundations of Management: Suggested concepts and links ... 223
A.4.3. Foundations of Management: Master map ... 223
A.4.4. Foundations of Management: Classroom Script... 223
xv
A.4.6. Organisational Ethics: Suggested concepts and links ... 225
A.4.7. Organisational Ethics: Master map ... 226
A.4.8. Organisational Ethics: Classroom Script ... 226
xvi
List of Figures
Figure 1-1 Overview of the context, goals, contributions and evaluation of this thesis. ... 4
Figure 1-2 Research phases: associated milestones and thesis chapters... 9
Figure 1-3 Structure of the research covered in this thesis and related published papers. ... 10
Figure 2-1 Partial diagram the represents the research context and the key problems this thesis addresses. ... 13
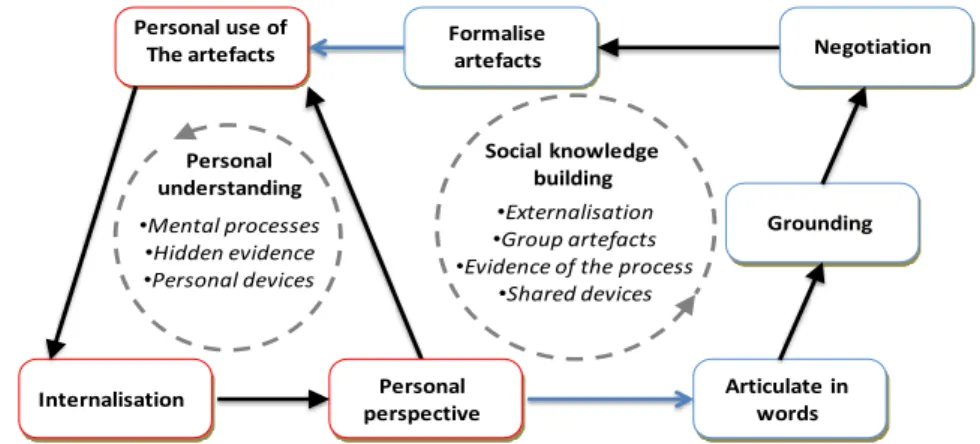
Figure 2-2 Diagram of the collaborative knowledge building process. Adapted from (Stahl, 2006)... 15
Figure 2-3 Generic Interaction Analysis processes (Dimitracopoulou et al., 2006). ... 16
Figure 2-4 The multiple faces of orchestration (Prieto et al., 2011). ... 18
Figure 2-5 A multi-touch interactive tabletop ... 19
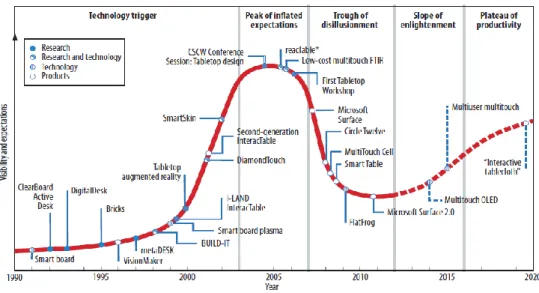
Figure 2-6 Evolution of tabletop research according to Müller-Tomfelde & Fjeld (2012)... 20
Figure 2-7 Comparing vertical and horizontal interactive displays. Left: tabletop condition. Right: using both displays at the same time (Rogers and Lindley, 2004). ... 21
Figure 2-8 Comparing input style. Left: Direct touch. Right: mouse clicks (Hornecker et al., 2008)... 22
Figure 2-9 Comparing tangible and virtual objects (Schneider et al., 2011). ... 23
Figure 2-10 Diagram that portraits the main components of the hardware of the DiamondTouch that provides touch sensing and differentiation (Dietz and Leigh, 2001) ... 24
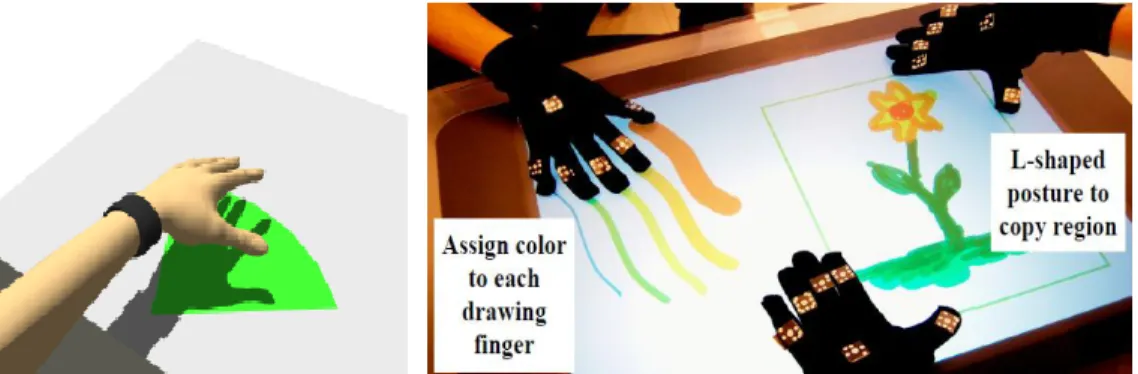
Figure 2-11 Hardware attached to user arms that afford user differentiation. Left: IdWristbands (Meyer and Schmidt, 2010). Right: fiduciary tagged gloves (Marquardt et al., 2010) ... 24
Figure 2-12 User identification at the tabletop through biometrics. Left: HandsDown (Schmidt et al., 2010a). Right: IdLenses (Schmidt et al., 2010b). ... 25
Figure 2-13 Systems that afford user localisation awareness. Left: Medusa (Annett et al., 2011). Right: Proxemics interactions (Ballendat et al., 2010). ... 26
Figure 2-14 OurSpace: an application for collaborative design of spaces (Fleck et al., 2009; Rick et al., 2009). ... 27
Figure 2-15 Representation of a theoretical approach proposed by Morgan and Butler (2009) for designing tabletop grounding on strong theories of collaborative learning. ... 28
Figure 2-16 Tinker Table and Tinker Lamp: versatile tabletop environments that can track tangible objects, pieces of paper and some touch points (Dillenbourg and Evans, 2011). ... 29
Figure 2-17 GreenTouch: a multi-device learning system that includes tabletops to explore biological information that can be collected in the field (Valdes et al., 2012). ... 29
Figure 2-18 Reflect table: a non-interactive device that reflects amount of verbal participation (left) and speech patterns (right) in group meetings (Roman et al., 2012)... 30
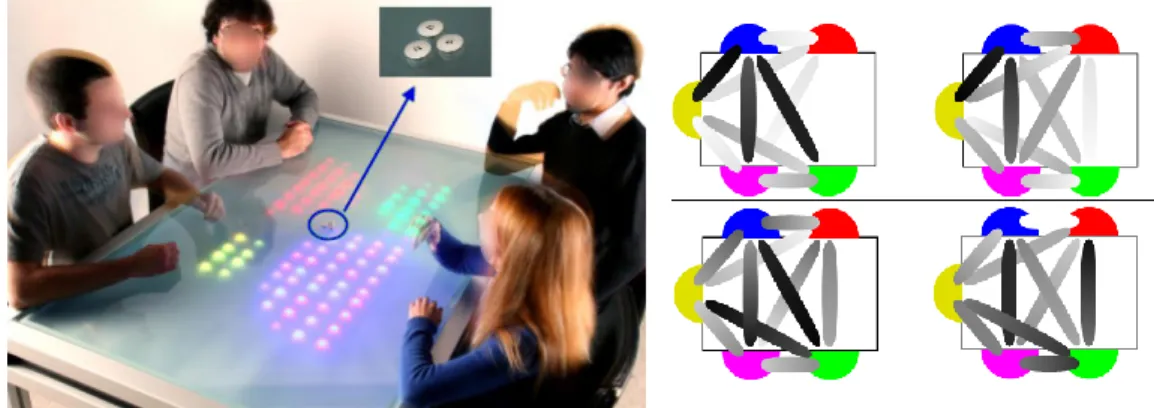
Figure 2-19 VisTaco: a system to visualise low level differentiated plots of touch input in a distributed multi-tabletop controlled setting (Tang et al., 2010) ... 31
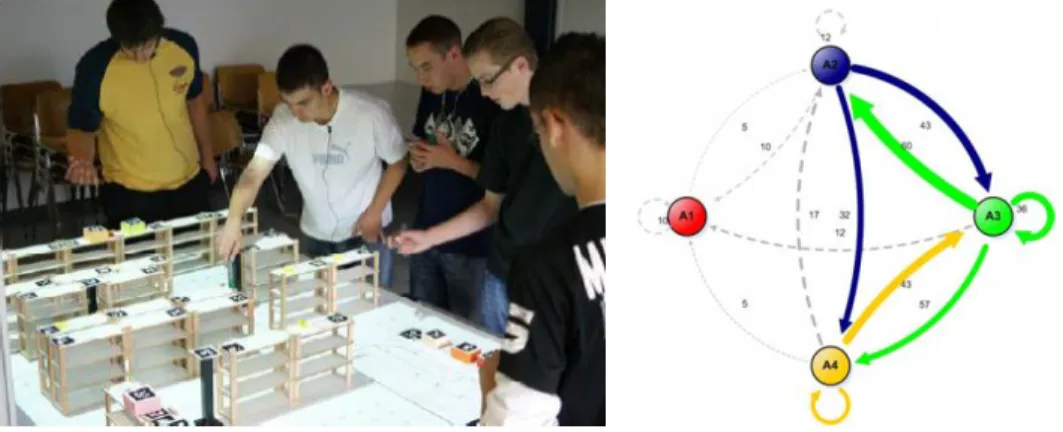
Figure 2-20 Analysing collaboration through a simulation-based logistics system. Left: Tinker Table system. Right: A collabogram representing learner’s verbal interactions (Jermann et al., 2009) ... 31
Figure 2-21 Visualisation of learner’s actions proposed by Al-Qaraghuli (2011). ... 32
xvii
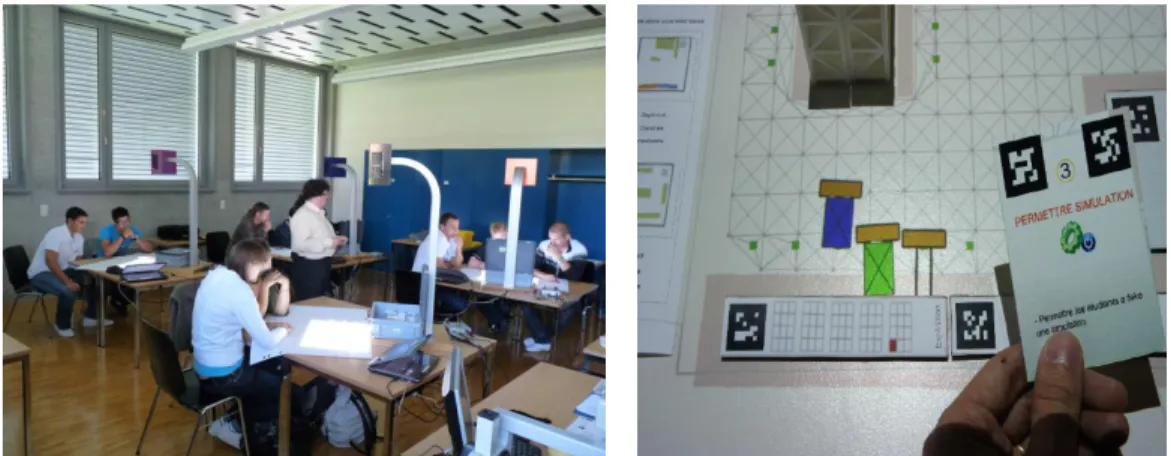
Figure 2-23 Do-Lenh’s (2012)multi-tabletop classroom. Left: Multiple Tinker Lamp devices in the classroom. Right: Orchestration cards used by the teacher to trigger commands on
individual tables. ... 33
Figure 2-24 Related work deploying multiple tabletops in the classroom, posterior to the work reported in this thesis (Kharrufa et al., 2013a). ... 34
Figure 2-25 Sociograms representing group members participation. Left: representation of an active group. Right: representation of a group with poor interactions (Erickson, 2004). ... 35
Figure 2-26 Visualisations of team work. Left: the Wattle tree. Right: Interaction networks of an egalitarian group (above) and an asymmetric group (below) (Kay et al., 2006). ... 36
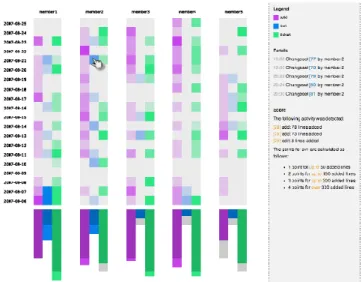
Figure 2-27 Narcissus system. An scrutable tool to navigate through the learner models of team work and participation (Upton and Kay, 2009). ... 37
Figure 2-28 Example of concept map built with Cmap-Tools from (Novak and Cañas, 2008). ... 39
Figure 2-29 Verified Concept Mapper, VCM (Cimolino et al., 2004)... 41
Figure 2-30 Betty’s Brain user interface (Leelawong and Biswas, 2008). ... 41
Figure 2-31 User interface that permits both the collaborative co-construction of a group concept map and the exploration of collaborator’s individual maps (Engelmann and Hesse, 2010). ... 42
Figure 2-32 A concept mapping application to explore wiki content (Baraldi et al., 2006). ... 42
Figure 2-33 Example artefact created with the Tabletop Mind-Mapping (Buisine et al., 2007). ... 43
Figure 2-34 Exploration of tangibles to create concept maps individually (Tanenbaum and Antle, 2009). ... 43
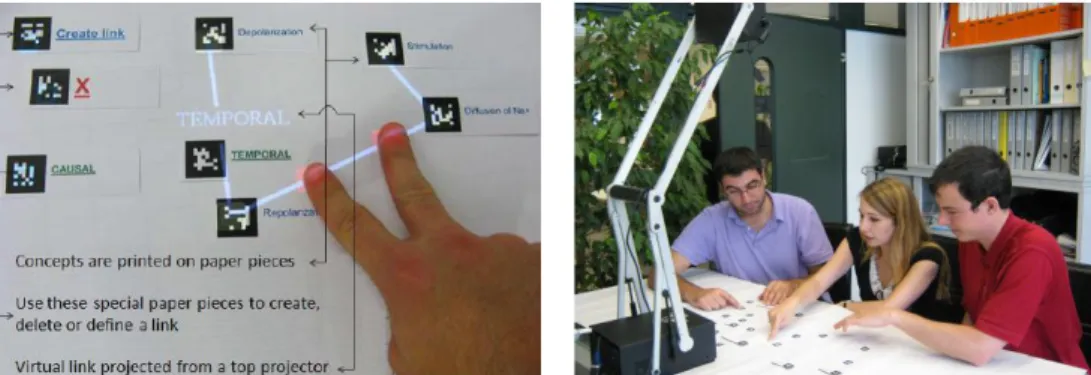
Figure 2-35 Paper-based concept mapping that allows students for more equalitarian participation when compared with sharing a personal computer (Do-Lenh et al., 2009). ... 44
Figure 2-36 Tabletop Concept Mapping (TCM) using tangible objects (Oppl and Stary, 2011). ... 44
Figure 2-37 Open issues in the intersection of the fields involved in the thesis. ... 45
Figure 3-1 Thesis statement and main aim of the conceptual framework... 48
Figure 3-2 TSCL-CF: Tabletop-Supported Collaborative Learning – Conceptual Framework. ... 50
Figure 3-3 TSCL- Conceptual Framework sub-diagram focused on the Data Capture Foundation (DCF). ... 53
Figure 3-4 TSCL-Conceptual Framework sub-diagram focused on the Data Analysis Foundation (DAF). ... 56
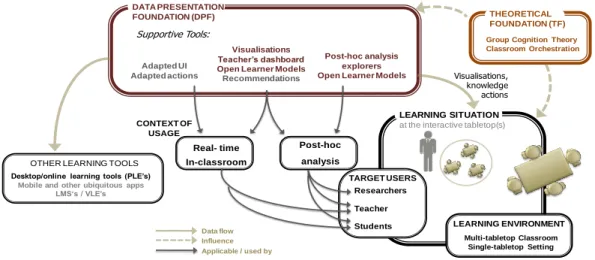
Figure 3-5 TSCL-Conceptual Framework sub-diagram focused on the Data Presentation Foundation (DPF). ... 58
Figure 3-6 Simplified conceptual framework mapping the chapters of the thesis. ... 59
Figure 4-1 Context, goals, contributions and validation of Chapter 4. ... 61
Figure 4-2 Multi-display setting. Left: Group of students solving a problem. Right: Configuration, group activity is shown in the public display, and an individual view of the task on personal displays (Wallace et al., 2009). ... 63
Figure 4-3 Job Shop Scheduling application screenshot (Wallace et al., 2009). ... 63
Figure 4-4 Representation of the verbal and physical participation of three groups. A participative group (left), a non-communicative group (centre) and an asymmetric group (right). Diagrams created using the Process Mining Framework (van Dongen et al., 2005). ... 64
Figure 4-5 Annotation of blocks of activity. Left: Dot plot representations of the coding of some analysed sessions for each 30 seconds of group work tagged as collaborative (blue), somewhat collaborative (orange) or non-collaborative (yellow). Right: The architecture of the approach. ... 65
Figure 4-6 The tabletop application prototype being used to build group concept maps. ... 69
Figure 4-7 Left: Scatter plot of physical and verbal participation. Right: Scatter plot of number and the Gini coefficient of physical participation. ... 71
xviii
Figure 4-9 Left: Steps of our data mining approach. Right: Excerpt from the application logs of
activity. ... 76
Figure 4-10 Elements of the Theoretical Foundation of the TSCL-CF... 81
Figure 5-1 Context, goals, contributions and validation of Chapter 5. ... 83
Figure 5-2 CMATE and COLLAID in context with the TSCL-CF. ... 83
Figure 5-3 Aspects to consider in the design of supportive tabletop learning systems grounding on theories of collaboration, technology affordances, analytics tools and presentation needs. ... 84
Figure 5-4 Initial prototype of CMATE with very basic features to edit a concept map. ... 89
Figure 5-5 Initial prototype of CMATE: the application allows to highlight the sub-map by an specific student. ... 89
Figure 5-6 Second prototype of CMATE that includes a software-based user differentiation system... 90
Figure 5-7 The concept mapping application. Top left: User identification; Top right: Accessing external sources; Bottom left: Editing node word; Bottom right: Building the artefact collaboratively. ... 91
Figure 5-8 Weighted Greedy Search Algorithm to differentiate users using COLLAID. ... 93
Figure 5-9 Digital learning environment and capturing system. ... 94
Figure 5-10 COLLAID software architecture. ... 94
Figure 5-11 Evaluation of user differentiation features of the COLLAID environment. ... 96
Figure 6-1 Context, goals, contributions and validation of Chapter 6. ... 101
Figure 6-2 Detailed of the TSCL-CF focused on the visualisations and teacher’s dashboard. ... 102
Figure 6-3 Disposition of the parts of the learning environment and the group indicators explored in this study. ... 103
Figure 6-4 Approach: 1) individual work using personal computers, 2) group activity at the tabletop and 3) the information readily available from the capture performed by our environment. ... 103
Figure 6-5 Left: Position of learners around the tabletop in this study. Right: Collaborative concept mapping application being used by three learners. ... 104
Figure 6-6 Graphical representation of interactions: each student’s actions performed on elements created by others for a) group that showed independent work, b) balanced participation, c) a dominant student (P3) and d) a free-rider (P3). Each vertical axis represents one student (P1, P2 and P3 coloured in yellow, green and red). ... 108
Figure 6-7 Tabletop concept mapping. Left: CMATE in action with 4 people, 2 at each long edge of the table. Right: Position of learners around the tabletop, with 4 students and with 3 students. ... 109
Figure 6-8 Participation radars. Left: First five minutes. Centre: Between minute 10 and 15. Right: Between minute 20 and 25. ... 110
Figure 6-11 Map evolution diagram. Left: A group of four learners working collaboratively most of time. Right: A group of three learners who divided the work during the first 20 minutes. ... 112
Figure 6-12 Initial dashboard mock-up: material provided to teachers to assess visualisations of a group of students. ... 113
Figure 6-13 Left: The coloured links of the map as a visual indicator of contribution itself. Right: Overview of the results of the questions related to: equity of participation (Q1A for group A and Q1B for group B), quantity of participation (Q2A, Q2B) and collaboration (Q3A, Q3B) ... 114
Figure 6-14 Class view of the teacher’s dashboard displayed on a handheld device while a group of students build a concept map. ... 116
xix
Figure 6-15 Overview visualisations. Left: a balanced group (Group A). Right: a group in which
one member (red circles) was completely disengaged from the activity (Group D). ...118
Figure 6-16 The teacher’s dashboard: the class level. ...118
Figure 6-17 Evolution of the group map. Left: A group with a dominant student (red) and a low participant student (yellow) (Group C). Right: A group with a low participant (red) (Group D). ..119
Figure 6-18 Timeline of interaction with other learner’s objects. Left: A group with a dominant learner (Group C). Right: group members that worked independently (Group B). ...119
Figure 6-19 The teacher’s dashboard: the detailed group level. ...120
Figure 6-20 Example of the orchestration tool emulated in the dashboard’s evaluation. ...121
Figure 7-1 Context, goals, contributions and validation of Chapter 7. ...126
Figure 7-2 A small group sharing and challenging their individual perspectives at our enhanced tabletop. ...126
Figure 7-3 Larger-scale study in context with the TSCL-CF...127
Figure 7-5 An example concept map mainly built oriented towards one of the students. The colours of lines and concepts indicate who created each concept or proposition ...128
Figure 7-6 Example pre-individual concept maps built by a student of the group who built the concept map shown in Figure 7-5. ...129
Figure 7-7 Example pre-individual concept maps built by another student of the same group who built the concept map shown in Figure 7-5. ...129
Figure 7-8 Individual maps opened on the tabletop. ...130
Figure 7-9 Meaningful physical actions. Top-left: Personal list of concepts used in the individual stage loaded to the tabletop. Top-right: List of suggested linking words available when a student creates a new link at the tabletop (e.g. Proteins – provide – growth). Bottom-left: All elements can be moved by direct touch and links can be merged to organise the concept map. Bottom-right: Students can add new concepts and linking words at any time or edit the links (e.g. for the same link change the word “provide” to “enable”). ...131
Figure 7-10 Position of learners around the tabletop. ...131
Figure 7-11 Graphs of interactions with other’s objects for (a) a collaborative group, (b) a group with a free-rider, and (c) a non-collaborative group (details presented in Section 6.4). ...134
Figure 7-12 Mixed radars of verbal (blue/light triangle) and physical (red/dark triangle) participation for (a) a collaborative group, (b) a group with a free-rider, and (c) a non-collaborative group (details in Section 6.4). ...136
Figure 7-13 Analysis of collaboration approach using three data mining techniques. ...137
Figure 7-14 Example of an excerpt of a group’s events using alphabets 1 and 2. ...140
Figure 7-15 Approach. 1) Pre-individual concept mapping (creating m1, m2, m3), 2) Group concept map (mg) and, 3) Post- individual concept mapping (creating m’1, m’2, m’3). Where = d(mi,mg)= similarity of pre-individual maps and the group map; d(m’i,mg)= similarity of post-individual maps and the group map; d1, d2, d3 = similarity among pre-individual maps of a group. d’1, d’2, d’3 = similarity among post-individual maps of a group. d(mi,m’i) = similarity between each pre- and post individual map per student. ADG = One-page Australian Dietary Guidelines. ...150
Figure 8-1 Context, goals, contributions and validation of Chapter 8. ...156
Figure 8-2 Left: the MTClassroom. Right: CMATE being used in the classroom. ...156
Figure 8-3 A teacher with the MTDashboard in the MTClassroom. ...157
Figure 8-4 Studies in the MTClassroom in context with the TSCL-CF...157
Figure 8-5 MTClassroom: Multi-tabletop classroom physical components. ...159
Figure 8-6 Wide view of the MTClassroom. Left: The teacher attending one group. Right: Reflection driven by the teacher using the wall display. ...160
xx
Figure 8-9 Minimal application for concept mapping ... 163
Figure 8-10 Multi-tabletop classroom enactment ... 164
Figure 8-11 Design plan for the activity using the multi-tabletop classroom. This is scripted in 6 phases. Two are performed at the interactive tabletops (blue squares). The actors are students in small groups (lower), and their teacher (upper). The right half shows the phases, tools and atomic actions. ... 164
Figure 8-12 Groups according to their equality of physical participation and contribution for activities 1 and 2... 167
Figure 8-13 Comparison between the planned time limits and the enactment of the design for the 14 tutorials. ... 168
Figure 8-14 Left: Relationship between time and number of links created by the 40 groups for Activity 1. The shaded area represents the standard deviation. Right: Relationship between time and number of links created comparing high and low achieving groups. ... 169
Figure 8-15 Concept map’s common layout arrangements. Left: Concentric map arrangement. Right: Linear map arrangement. The yellow circle indicates the most general concept. ... 170
Figure 8-16 Left: A teacher attending a group while holding the MTDashboard. Right: The two visualisation conditions. ... 172
Figure 8-17 MTDashboard: condition 1 (Left), and condition 2 (Right)... 172
Figure 8-18 An illustrative transition diagram of the process of teacher’s attention in one classroom session. ... 174
Figure 8-19 Distribution of the length of the sets of activity in terms of number of actions. ... 180
Figure 8-20 Fuzzy model generated from the activity of high achieving groups. Left: Fuzzy model of high achieving groups (Conformance: 86%, Cuttoff: 0.1). Right: Fuzzy model of low achieving groups (Conformance: 81%, Cuttoff: 0.1). ... 183
Figure 9-1 Summary of the thesis goals matching the thesis chapters 4-8. ... 189
Figure A-1 TSCL-CF: Tabletop-Supported Collaborative Learning – Conceptual Framework (Full version). ... 211
Figure A-2 Depth Image from the sensor. ... 212
Figure A-3 Modular structure of COLLAID; and how it fits within a tabletop application, and the potential for other components to plug into it. ... 213
Figure A-4 Examples of test touch conditions that were evaluated. ... 215
Figure A-5 Placement of users around the tabletop. ... 215
Figure A-6 Left: Preview window and Right: Random (Activity Density) condition. ... 216
Figure A-7 The User Identification System: a high level overview. ... 218
Figure A-8 The User Identification System: infrastructure. ... 219
Figure A-9 The User Identification System: features. ... 219
Figure A-10 Left and Centre: The tabletop distinguishing between fingers and devices. Right: Depth information captured by the overhead mounted sensor used to track hands and bodies above the surface. ... 220
Figure A-11 Handshaking protocol... 220
xxi
List of Tables
Table 3-1 List of positive and negative affordances of interactive tabletops for learning. ... 49 Table 3-2 Main principles of the Theoretical Foundation (TF). ... 52 Table 3-3 Overview of sensing technology enriching interactive tabletops. ... 55 Table 3-4 Main groups of Indicators of Group Interaction (Dimitracopoulou et al., 2004). Group
indicators that have been explored and used in this thesis are highlighted in bold. ... 57 Table 4-1 Samples from the JSS combined dataset. ... 64 Table 4-2 Diagnosis features and six examples of 30 seconds blocks of collaborative (C1, C2),
somewhat collaborative (SC1, SC2) and non-collaborative (NC1, NC2) activity... 65 Table 4-3 Results of the 10-fold cross validation. F1=Balanced F-score, C= F-measure of the
algorithm in classifying “collaborative” SC=somewhat collaborative, or NC= non-collaborative situations. EX= extreme misclassifications accuracy, OP= optimistic accuracy. BL=baseline, BNet= Bayesian Network, NB= naïve Bayes, BFT= Best-first tree, C4.5= C4.5 tree. ... 66 Table 4-4 Results of the leave one out cross validation. ... 67 Table 4-5 Simplified fragments of the combined logs (application + audio). Left: collaborative
group. Right: Non-collaborative group. Results of the leave one out cross validation. ... 70 Table 4-6 Tabletop data log grouped in pieces of 90 seconds. ... 70 Table 4-7 Clustering results. Cluster-0 (C), Cluster-1 (M), Cluster-2 (NC)... 72 Table 4-8 Clusters of patterns found by mining the raw events... 77 Table 4-9 Clusters of patterns found by mining compacted events. ... 79 Table 4-10 Considerations about the feasibility and design requirements to build a solution to
automatically analyse collaboration at face-to-face settings that were learnt from the exploratory studies... 80 Table 5-1 Limitations of previous concept mapping tabletop solutions. ... 87 Table 5-2 Prototyping design process of CMATE. ... 89 Table 5-3 Accuracy of the touch differentiation system according to the number of users. ... 96 Table 5-4 Accuracy of the speaker differentiation system. ... 97 Table 5-5 Basic actions considered for the data mining sequential mining. ... 97 Table 5-6 Top frequent discovered patterns and its frequency per group. Columns G1, G2 and
G3 specify the partial frequency for groups 1, 2 and 3... 98 Table 5-7 Mapping the system features with the designing guidelines. ... 99 Table 6-1 Measures of group activity process: 1) A group in which group members worked
independently; 2) a balanced group; 3) a group with a “dominant” student and 4) a group with a “free-rider”. ... 106 Table 6-2 Example excerpt of a non collaborative situation ... 107 Table 6-3 Example excerpt of a non collaborative situation ... 107 Table 6-1 Summary of the questionnaire responses. Columns: questions asked to the
evaluators. ... 115 Table 6-2 Visualisations that were used for the facilitators to answer each question ... 115 Table 6-3 Teachers attention and interventions per group. Att= Average number of times each
xxii
Table 6-4 Potential group anomalies identified by teachers using each visualisation. ... 122 Table 7-1 Average time taken by groups to complete each collaborative phase. ... 134 Table 7-2 Average values of physical activity, interaction with other’s objects, and symmetry. ... 135 Table 7-3 Average values of verbal activity, meaningful physical actions and number of accesses
to individual concept maps at the tabletop. ... 135 Table 7-4 Average values of physical actions with no speech in parallel; and physical actions
with speech in parallel from the same student and other students... 136 Table 7-5 Average number of classified blocks for highly and weakly collaborative groups. ... 138 Table 7-6 Four alphabets. 1) Physical/verbal participation; 2) verbal participation; 3) physical
action on other’s objects; and 4) access to individual maps. ... 140 Table 7-7 Top sequential patterns found using Alphabet 1. Repetitive keywords and
descriptions in bold letters. ... 142 Table 7-9 Top sequential patterns found using Alphabet 2. ... 143 Table 7-10 Proportions of keywords in frequent patterns by using Alphabet 2. ... 144 Table 7-11 Top sequential patterns found using Alphabet 3... 144 Table 7-12 Proportions of keywords in frequent patterns by using Alphabet 3. ... 145 Table 7-13 Top sequential patterns found using Alphabet 4... 145 Table 7-14 Clusters generated ... 147 Table 7-15 Questions overview written as statements. The formulation of each refers to
elements of Figure 7-15. ... 151 Table 8-1 Teacher’s intentions and data that captured from our system (A=Is it possible to
assess it from the captured data?). ... 166 Table 8-2 Main differences between tutorials organised in semesters 1 and 2, 2012. ... 171 Table 8-3 Correlation analyses between Attention/Intervention and Group’s performance. ... 174 Table 8-4 Analysis the groups that the teacher attended to for condition (i) distance to teacher’s
map... 176 Table 8-5 Analysis the groups that the teacher attended for condition (i) physical participation... 176 Table 8-6 Analysis of the Impact of teacher’s interventions: correlation analysis between the
rank of a group among the others in the classroom and the improvement of their artefact’s distance to the teacher’s map. ... 177 Table 8-7 Possible actions on the concept mapping tabletop system ... 178 Table 8-8 Keywords included in the alphabets for the sequential pattern mining. ... 179 Table 8-9 Top-4 most frequent sequences after applying differential sequence mining on each
encoded dataset. ... 182 Table 8-10 Distribution of the number of active learners in blocks of activity ... 184 Table 8-11 Validation of the fuzzy models ... 184 Table 8-12 Data-driven support provided to the teacher using the MTClassroom. ... 185 Table A-1 Results of conditions: Results of condition: touches close to the user, touches close to
other users, arms/hands crossing and Multi-finger gestures... 216 Table A-2 Results of condition: Random touch points on the tabletop. ... 217 Table A-3 Results of condition: users standing and seated. ... 217 Table A-4 Results: overall accuracy per number of users... 217
1
1.
Chapter 1: Introduction
"New technology is common; new thinking is rare” -Sir Peter Blake
Summary: This chapter describes the research context of the thesis, the identified learning problem and the methodology followed to address it. This thesis builds on the intersection of three fields: Human-Computer Interaction (HCI), Computer-Supported Collaborative Learning (CSCL) and Educational Data Mining (EDM). The thesis proposes a conceptual framework as a result of a deep exploration of different ways that student’s data can be used to help understand different aspects of collaboration using interactive tabletops. The thesis shows how student’s data can be exploited to enhance teacher’s awareness through a series of instantiations of this framework. This chapter outlines the goals, contributions, evaluation methods and the general structure of the rest of the thesis.
1.1.
Context and Motivation
The many benefits of collaboration on learning and knowledge sharing, especially when it is mediated by technology, are well documented in the Computer-Supported Collaborative Learning (CSCL) research area. Collaboration can promote learners to externalise their personal perspectives in order to reach shared understanding and integrate individual with group knowledge (Scardamalia and Bereiter, 1991; Stahl, 2006). Collaborative learning can enhance the thinking capacity by triggering particular learning mechanisms that cannot be activated by individual learning (Dillenbourg, 1998). It can also lead to improved critical thinking, reduced task workload, increased retention, and a more positive attitude towards the subject matter (Berland and Reiser, 2009; Felder and Brent, 1994; Johnson and Johnson, 1986).
Collaboration is not a single mechanism; most of the time it requires all group members to engage in a coordinated effort to provide a joint solution to a problem (Roschelle and Teasley, 1995). It also demands the development of a number of skills. Therefore teachers have a central role in fostering enhanced performance by monitoring the collaborative process, providing feedback and helping students to be more aware of their group dynamics (Dillenbourg et al., 2011; Kirschner, 2001; Slavin, 1983; Webb, 2009). The development of skills for effective collaboration is crucial, not only in educational settings, but also to meet real-world challenges (Scheuer et al., 2010). In particular, face-to-face (f2f) collaboration provides benefits that are not easy to find in other forms of group work (Johnson et al., 2000). These include a natural channel for continuous communication, exchange of non-verbal cues, and an increased productivity in completing tasks (Olson et al., 2002).
2
Without adequate feedback, however, group members do not always naturally collaborate to complete their joint task (Dillenbourg, 1998), even if they are supported by a computer system (Kreijns et al., 2003). Indeed, they may find that it requires too much time and additional effort. This means that in collaborative learning environments, it is important for the teacher to be aware of student’s collaboration in order to provide support (O'Donnell, 2006). In real classrooms, teachers have to manage their limited resources and time to attend to students, each with different learning styles, strengths and needs. Even during small group activities, it is challenging for teachers to provide, even to each group, the one-on-one attention that they may require (Zhang et al., 2004). Teachers may try to identify the groups that are collaborating more effectively, to allow them to work more independently so that the teacher can focus on groups that need attention. As a result, teachers generally cannot be aware of the process that some groups followed (Race, 2001). At the end of the class, the teacher may not be able to know what happened within certain groups and usually they have to assess their performance based only on the final product of the activity. Nevertheless, the final product provides very limited information about the collaborative process, individual contributions or previous states of the solution that may have been of good quality.
Pervasive technologies can be used to address this problem. Research on Human-Computer Interaction (HCI) has recently shown promise for the development of emerging pervasive shared devices, such as interactive tabletops, for supporting students to collaborate and for their teachers to monitor face-to-face group work (Kharrufa, 2010). The affordances of interactive tabletops include the provision of a work space that offers equal opportunities of participation for each learner, repeatability when working with virtual content, and digital resources that students can use to build a solution (Piper and Hollan, 2009). Tabletops provide an environment in which students can decide whether they work in parallel or as a group entity. They also open up new opportunities for capturing learner’s digital footprints. This can offer teachers and researchers the possibility to gain awareness of the process followed by the students, helping those teachers or researchers to identify behaviour patterns and understand how learners collaborate. Therefore, interactive tabletops can offer a new way to explore the body of research of CSCL to help teachers support student’s face-to-face collaboration.
The third area of research that can provide with methods to exploit the rich contextual data that can be captured from the interactions of students with the tabletops and with their peers is the emerging field of Educational Data Mining (EDM) (Baker and Yacef, 2009). Data mining, artificial intelligence or even simple statistical approaches can be used to find patterns of student’s activity associated with higher level strategies or behaviours. These patterns may help produce indicators of effective collaboration or less desired learning outcomes. However, most of the proposals for automatic analysis in this research area, as in related fields, such as Learning Analytics (Siemens and Baker, 2012) and the analysis of computer-supported collaboration (Soller et al., 2005), are mostly intended for networked remote collaboration settings. In most of these systems it is possible to record student’s interactions that are mediated by the technology, but all their face-to-face communication or interactions through other mediums are usually neglected.
When applied to face-to-face settings, computer-supported collaboration analysis is mostly based on video and audio recordings (Jeong and Hmelo-Silver, 2010), and oriented to researchers, whose focus is on the deep and detailed insights enabled by these streams of data. By contrast, teachers need tools that provide them coarse-grained key information that allows them to monitor what is happening in their classes (Dillenbourg et al., 2011). However, collocated collaboration is strongly based on verbal interaction and therefore not mediated by the technology. The integration of this verbal activity with the data stored by learning systems, such as activity logs, learning outcomes and student’s artefacts, requires technological infrastructures that are able to capture data from multiple sources and the analysis methods that exploit this integration.
The intersection of the three fields, CSCL, HCI and EDM/data analytics, in this context, raises a challenging question: How can interaction data be automatically exploited to inform teachers and enhance their awareness of student’s collaborative activity using interactive tabletops? In order to address this, three sub-problems arise from the previous question:
1.2 Thesis Statement
3
1. What information is required to analyse collaborative learning in existing face-to-face
interaction datasets? Addressing this question includes the exploration of existing face-to-face
settings to investigate if it is possible to produce indicators of group work that can provide relevant information of collaboration and learning. Validating the feasibility of extracting interesting patterns from existing settings serves as a foundation to define the characteristics of the targeted learning situation and a number of guidelines regarding the collaboration data that should be captured.
2. What are the design features of a system that can unobtrusively capture and show
interaction data? This is particularly important for face-to-face settings in which the communication between peers is rich, wide and can occur through different channels that the computer cannot (and perhaps should not) mediate (e.g. speech, gaze, body language or assenting). A first challenge is to define what interaction data should be captured and what data can be captured using the currently available technology while, at the same time, students interact naturally. A second challenge is to implement a solution for capturing face-to-face interaction data unobtrusively to avoid causing changes in student’s collaboration influenced by the capturing system.
3. How can interaction data be analysed and distilled to enhance teacher’s awareness of group
collaboration and the progress in their task? The third issue is to find ways to produce key patterns of interaction that can be discovered from student’s data. A follow up issue is to find the effective ways in which group indicators can be shown to the teacher, in the form of visualisations or succinct information, to enhance their awareness during the classroom sessions or for after class reflection.
1.2.
Thesis Statement
This thesis aims to address the three questions posed above through the following statement that embodies the approach of this thesis for supporting teacher’s awareness of small group’s collaboration.
To design, implement and evaluate the conceptual and technological infrastructure that can capture student’s individual and collaborative activities as they build shared knowledge at an interactive tabletop and analyse these data through Interaction Data Analytics techniques to provide support to teachers by enhancing their awareness of student’s collaboration.
Figure 1-1 (context) lists a set of keywords that can help understand the crossing of the three domains, CSCL, HCI and EDM, in terms of the thesis statement (in particular, and in no order, interaction data capture, interactive tabletops for learning, interaction data analytics, visualisations and classroom orchestration).
In order to provide support to teachers, the system should be able to automatically capture student’s interaction data in a way that it does not interfere with the natural process of collaboration or restrict student’s interactions with the technology or their peers. Additionally, explorations of
interactive tabletops for learning are important to be considered because the multi-touch
applications should provide usability and interaction affordances that at least do not produce a negative impact on student’s coordination.
In this thesis we will use the concept of interaction data analytics to refer to the analysis techniques that can be applied to exploit the rich interaction data that can be captured from a collaborative learning environment. Under this umbrella we include artificial intelligence approaches, data mining algorithms, process mining, statistics and visualisations (EDM and Learning Analytics techniques). A fourth key term that is relevant in this thesis is classroom orchestration (Dillenbourg et al., 2011), more specifically the dimensions of teacher’s awareness and classroom control (Prieto-Santos, 2012). The metaphoric term, classroom orchestration, is used to describe the
4
role that teachers take as managers and coordinators of the cognitive, pedagogic and technological resources in the classroom, to help students achieve the intended goals of the learning activities (Prieto et al., 2011). The effectiveness of orchestration and the extent to which teachers can respond to the ways students perform the class tasks is critical because it directly impacts these student’s activities, and therefore, their learning (Dillenbourg et al., 2011). The use of technology-based tools can improve the teacher’s management of the class and enhance their awareness of learner’s activity. For the later, visual representations can be produced from the interaction data and be shown to teachers so they can quickly make informed decisions during the class and provide more effective feedback to the students. This information may consist of visualisations, numerical summaries or graphs that can provide teachers with meaningful insights on which groups might need attention and which ones can be left to work by themselves at that point in time.
Figure 1-1 Overview of the context, goals, contributions and evaluation of this thesis.
In order to deliver the conceptual and technological elements, this thesis builds on the following principles to design an approach to support a collocated collaborative learning situation.
Goals
MTClassroom: multi-tabletop classroom MTDashboard: Teacher’s dashboard Analysis of collaborative interactions and artefacts In a single-tabletop COLLAID: enriched tabletop-based system that captures students’ interactions CMATE: concept mapping tabletop application CSCL: Computer Supported Collaborative LearningContext
EDM: Educational Data Mining
HCI: Human-Computer Interaction
Selected Problems
Supporting teachers’awareness of small groups’
collaboration.
Contributions
Authentic tutorials (x2) Data mining, quantitative and qualitative triangulationValidation
Evaluations with teachers (x2) Iterative prototyping and observations Usability tests Accuracy evaluations Visualisations Interaction Data AnalyticsHow can interaction data be analysed and distilled to enhance teacher’s