Extending parental mentoring using an event-triggered
video intervention in rural teen drivers
Daniel V. McGehee
a,b,⁎
, Mireille Raby
a, Cher Carney
a, John D. Lee
a,b, Michelle L. Reyes
ba
Human Factors and Vehicle Safety Research Program, Public Policy Center, University of Iowa, USA b
Cognitive Systems Laboratory, Department of Mechanical and Industrial Engineering, University of Iowa, USA Available online 28 March 2007
Abstract
Teen drivers are at high risk for car crashes, especially during their first years of licensure. Providing novice teen drivers and their parents with a means of identifying their risky driving maneuvers may help them learn from their mistakes, thereby reducing their crash propensity. During the initial phase of learning, adult or parental supervision often provides such guidance. However, once teens obtain their license, adult supervision is no longer mandated, and teens are left to themselves to continue the learning process. This study is the first of its type to enhance this continued learning process using an event-triggered video device. By pairing this new technology with parental feedback in the form of a weekly video review and graphical report card, we extend parents' ability to teach their teens even after they begin driving independently. Twenty-six 16- to 17-year-old drivers were recruited from a small U.S. Midwestern rural high school. We equipped their vehicles with an event-triggered video device, designed to capture 20-sec clips of the forward and cabin views whenever the vehicle exceeded lateral or forward threshold accelerations. Preliminary findings suggest that combining this emerging technology with parental weekly review of safety-relevant incidents resulted in a significant decrease in events for the more at-risk teen drivers. Implications for how such an intervention could be implemented within GDL are also discussed.
© 2007 National Safety Council and Elsevier Ltd. All rights reserved.
Keywords:Teen drivers; Novice drivers; Naturalistic driving; Intervention; Monitoring devices; Parental feedback
1. Introduction
Newly licensed teens are at high risk for car crashes. Teen drivers (16–19 years old) have crash rates that exceed those of drivers of any other age group, with 16–year olds having the highest crash rates of all (Mayhew, Simpson, & Pak, 2003; McCartt, Shabanova, & Leaf, 2003; Shope, 2006). As many as 3,467 teen drivers (aged 15–20 years old) were killed and 281,000 reportedly injured in motor vehicle crashes in 2005 (National Highway Traffic Safety Administration [NHTSA], 2006). This amounts to approximately one third of deaths from
all causes for teenagers (Chen, Baker, Braver, & Li, 2000; Insurance Institute for Highway Safety [IIHS], 2004).
The tendency for teenage drivers to have high crash rates (fatal and nonfatal) compared with drivers of all ages remains true no matter how one looks at the data (i.e., whether crash rates are based on the total number of teenagers, the number of licensed teens, or the number of miles driven;IIHS, 2004). In fact, because licensure rates and miles driven per license holder tend to be lower among 16–19 year olds, their rate of fatal crashes per mile driven tends to be even more extreme compared to that of older drivers (IIHS, 2004; Insurance Information Institute [III], 2007). Crash risk varies greatly depending on whether a teen is at the learner stage (low crash risk), just licensed (highest crash risk in the first month of licensure), or has been driving for a year or more (Williams, 2003).
After the first years of licensure, crash risk tends to decline annually (IIHS, 2004; Mayhew et al., 2003; Williams, 2003). This decline in crash rates over time is linked to experience,
⁎Corresponding author. Human Factors and Vehicle Safety Research Program, University of Iowa, Public Policy Center, 227 South Quad, Iowa City, IA 52242, USA. Tel.: +1 319 335 6819; fax: +1 319 335 6801.
E-mail address:[email protected](D.V. McGehee).
0022-4375/$ - see front matter © 2007 National Safety Council and Elsevier Ltd. All rights reserved. doi:10.1016/j.jsr.2007.02.009
maturation, or a combination of these two factors (Mayhew et al., 2003).Mayhew and colleagues (2003)investigated these issues in a study where they examined changes in collision rates during the first 24 months of driving. Consistent with other research, they observed a strong effect for age-related factors; 16- to 19-year-old novice drivers maintained a consistently higher crash rate (almost twice as high) as older (20+) novice drivers with the same amount of driving experience over the 24-month period after licensure. They also obtained a clear effect of experience-related factors on crash rates for both young and older novice drivers. Crash rates declined the most during the initial 7 months of driving, with 16- to 19-year-old novice drivers reducing their crash rate by as much as 42% during this short period of time. Finally, their data suggest that at any age, crash rates for novice drivers decrease as drivers accumulate driving experience. However, younger drivers show a more significant decline than their counterparts, especially during their first year after licensure.
2. Methods to reduce teen crash involvement
The findings of Mayhew and colleagues (2003) under-score the importance of protective programs and policies during the first two years of driving and, in particular, the first six months. What is needed is a method to control teen drivers' exposure to hazards so as to allow learning to take place in a more forgiving environment.
One such method is a Graduated Driver Licensing (GDL) program that extends the period of supervised driving for several months and imposes a set of restrictions on novice drivers. GDL programs focus on the critical period when teens are at the highest risk of being involved in a crash. By providing adult supervision and driving restrictions at different stages of licensing, GDL programs attempt to keep teens out of high-risk situations. Several states have adopted GDL programs and recent evidence suggests that the more stringent programs have been effective at reducing crash involvement (Dee, Grabowski, & Morrisey, 2005). While GDL programs vary widely, they usually consist of three phases: (a) an extended supervised learning phase (six months or more), (b) an intermediate license that restricts unsupervised driving at night or with passengers and may require parent certification, followed by (c) a fully issued unrestricted license upon successful completion of the first two phases. By the time they are granted their unrestricted license, depending on the state, most teen drivers are 17 or 18 years of age.
The parents of teenage drivers play a significant role in their teen's driving safety. They are responsible for enforcing the graduated driver licensing policies and driving restric-tions by controlling access to their teen's vehicle ( Simons-Morton, Hartos, & Beck, 2003). It is interesting that even a brief intervention at the time of teen provisional licensure has proven successful in increasing parental restrictions on teen driving privileges (Simons-Morton et al., 2003). By simply showing a short video on the risks of teen driving and providing both parents and teens with a driving agreement
listing teen driving risks and suggestions for families on setting driving rules for teens,Simons-Morton and colleagues (2003)reported significant treatment group differences that were still present nine months later. A recent literature review supports this notion, indicating that parental involvement in management of novice teen driving positively impacts teen driver safety (Simons-Morton & Ouimet, 2006).
Another method to reduce teen crashes involves the use of a driver-monitoring device. The Record Online (Milgrim, 2005) reported that Senator Bill Larkin introduced legislation in the New York Senate and Assembly in April 2005 to allow for the in-car“installation of special devices to monitor the driving patterns of newly licensed teens.”The bill would not mandate the installation of the devices, but it would require a reduction in insurance rates for owners of vehicles equipped to monitor the driving of those under 21 years of age. The claim is that insurance rates could be reduced by up to 25%. According to Senator Larkin (Milgrim, 2005), “The devices will need to monitor speed, steering, acceleration and braking patterns, among other things, and be able to immediately notify a parent or guardian if they detect unsafe driving practices.”
Several safety-monitoring devices have become available in the marketplace— each offering a different method for parents to monitor their teens' driving. Some of these systems use the functionality of event data recorders (EDR) that capture vehicle data, such as speed, engine information, number of trips by time and day, miles driven, etc. Marketed to parents, these devices enable them to set thresholds for different vehicle parameters and to monitor whether and when their teens exceed these thresholds. One major disadvantage of such systems, however, is that while they provide speed, mileage, and/or geographical data, they do not supply anycontextual
information for the parents and teens to understand what caused the threshold exceedances. Without such context, there is no way to truly‘learn’from the flagged behavior and the opportunity to use this incident as a‘teachable moment’is lost. Using event-triggered video devices is advantageous in that the context of the event can be better understood. For instance, a lateral acceleration exceedance may be flagged with any data recording system. Without video feedback, however, it is not possible to know where the exceedance occurred or what happened in the car leading up to it. This information may be critical. In addition, if a driver exceeds a speed threshold in a residential area, as opposed to a freeway, there are clearly differences in context that may have dramatic safety implica-tions. Also, if the exceedance occurs due to cell phone usage, this information might teach the driver something about their own ability to safely operate the cell phone while driving.
Missing from any technology-centric approach, however, is parent/teen interaction. Simply installing the device in a teen's vehicle may not be sufficient to improve driving safety. However, providing video clips of safety-relevant driving behaviors to the teens and parents/guardian for review could create an opportunity for teens to learn from their mistakes. While it is well known that people rationalize their behavior, and can generate a myriad of reasons to
explain away vehicle event data as recorder anomalies, this is much harder to do with video (Fischhoff, 1975; Hoffrage, Hertwig, & Gigerenzer, 2000). It proves the adage“a picture is worth a thousand words.”In essence, it allows parents and teens to have a non-biased observer in the vehicle when needed to capture‘teachable moments.’
The objective of the current research project is to determine whether the use of an event-triggered video system, paired with feedback in the form of a weekly graphical report card and video review, can reduce unsafe driving behavior when reviewed by teen drivers and their parents. By incorporating both the video and parental involvement in driver training, we hope to significantly reduce the number of unsafe driving behaviors of newly licensed teens. This research project is different than other interventional studies that monitor drivers based solely on a variety of vehicle parameters. Event triggered video gives clear, contextual feedback in the form of video and audio of each driving episode captured—good and bad. It is hoped that the feedback provided by this type of system combined with mentoring from parents will help teen drivers become aware of their potentially unsafe driving behaviors, recognize any patterns of unsafe behavior, and improve their driving for the long-term.
3. Methods 3.1. Participants
Twenty-six teen drivers were recruited from a small Midwestern high school in rural Iowa. This school was chosen because of its rural base and the size of the district, which covers a 162-square-mile radius. Nearly all drivers must operate on rural highways and gravel roads. At the time of recruitment, drivers were between the ages of 16 and 17. Twelve males and 14 females were recruited for participation—one female participant later moved out of state. Prior to induction into the study, the participants' driving experience ranged from 3 months to more than a year. Some participants had more than one year due to the large number of teens who obtain a school permit in the rural areas of the state. In Iowa, a school permit allows drivers as young as 14.5 years old to drive to and from school-related activities without supervi-sion. Participants were paid $25 per month for their participation. In the summer, they were paid an extra $5 per week to drive to the high school to download their data via the wireless network.
3.2. Apparatus
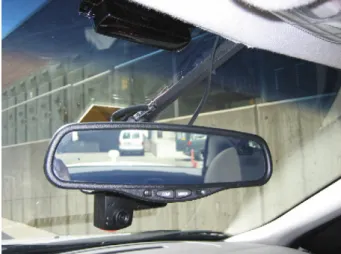
Each participant's vehicle was equipped with an event-triggered video recording system made by DriveCam. This system is a palm-sized device that integrates two video cameras (forward and interior view), a two-axis accelerom-eter, a 20-second data buffer, and a wireless transceiver. See
Fig. 1for a view of the video recording system installed in a vehicle.
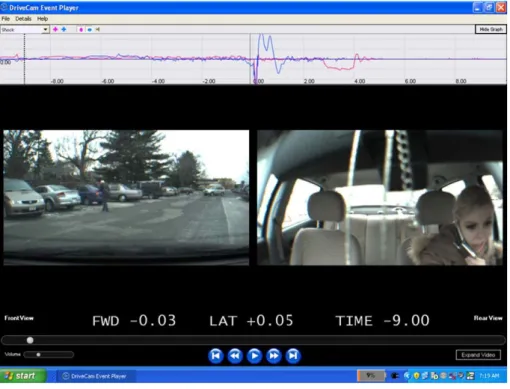
The system continuously captures audio-video data in a video buffer. The views are the forward roadway and the vehicle's interior (see Fig. 2). Also recorded are lateral and longitudinal acceleration, date, and time. When the accelerom-eter exceeds a threshold (lateral, longitudinal, or shock), the device “triggers.” A trigger causes 20 seconds of data to be written to the device's memory (10 seconds before the event and 10 seconds after).
Feedback to the user is provided via two LED lights on the face of the recorder. A solid green LED indicates that the unit is powered on and functioning properly. When triggered, the device's green LED blinks on/off for 10 seconds and then blinks red/green for 10 seconds. The device continues to capture data during the green on/off phase, and then writes the information during the red/green phase. Once an event is stored on the device, the LED goes to solid red and the device is ready to capture the next event.
All events are automatically downloaded from the device via a secure wireless connection whenever the participant parks in the high school parking lot. Once downloaded, encrypted data are sent to the laboratory for coding.
3.3. Procedures
The installation of the DriveCam system took approxi-mately 30–45 minutes per vehicle. Installation was com-pleted at the high school during school hours. During installation, stickers were placed inside the vehicle (i.e., on the dashboard facing the passenger's seat, and on the back of the headrests) in an effort to notify all occupants that there was a possibility they could be recorded.
Of particular importance were the trigger threshold settings. The trigger threshold values are measured in sensitivity settings. DriveCam uses thresholds that roughly correspond to g-forces (+/−10 percent). These thresholds refer to acceler-ometer readings that reflect changes in vehicle velocity or the lateral forces acting on the vehicle when cornering. If the
Fig. 1. View of the DriveCam event triggered video system located behind the rear-view mirror.
acceleration exceeds the threshold value, then an event is triggered. The trigger thresholds for this research project were:
▪ Shock trigger threshold: This setting defines the force level for a “shock trigger” from any direction. Shock triggers are most often caused by severe impacts. The threshold setting for this study was 1.50.
▪ Longitudinal trigger threshold: This setting defines the force level required to trigger the system with a positive or negative acceleration. Longitudinal triggers are most often caused by hard braking. The threshold setting used for this study was 0.50.
▪ Lateral trigger threshold: This setting defines the force level required to trigger the system with a lateral acceleration. Lateral triggers are most often caused by hard cornering or swerves. The threshold setting used for this study was 0.55. Settings were determined based on guidance and experi-ence from the manufacturer. The goal was to maximize the number of truly safety-relevant events captured, while re-ducing the number of invalid triggers to be analyzed.
3.4. Data collection
Data collection took place in three phases over the course of 1 year.
▪ Phase 1 (Baseline)—No feedback from system or parents.
▪ Phase 2 (Intervention) — Immediate feedback from system (e.g., blinking LED) and feedback from parent/ teen mentoring sessions.
▪Phase 3 (Second Baseline)—No feedback from system or parents.
In Phase 1 of the data collection process, baseline information regarding each participant's everyday driving behavior was obtained; no parental or system feedback was given during this time. Drivers were informed that under some abrupt braking or steering maneuvers, 20-second clips of video would be recorded. However, during this baseline phase, the LED light on the video recorder was disabled so that the driver would have no way of knowing whether the system was recording an event or not. Eliminating the feedback from the LED light enabled us to capture each teen's natural driving behavior. This phase lasted about nine weeks. During the intervention phase (Phase 2), participants received two different types of feedback. The first type came in the form of a red and green LED light on the system that blinked whenever the lateral or longitudinal threshold value was exceeded. The LED blinked after the event had already occurred, during the write-to-disk process. This informed the driver that the maneuver they had just completed (i.e., abrupt braking, steering or acceleration) exceeded the safety limits that we had set. This simple feedback helped drivers recalibrate their driving so that the system would not be triggered. The teen drivers were thus able to become more aware of the safety-relevant driving behaviors that were setting off the camera.
A CD containing video clips of all safety-relevant events with a graphical ‘Report Card’ was mailed to parents/ guardians and teens at the end of each week (see Appendix A for an example of the weekly Report Card). Incidents were described simply and suggestions for how to mitigate the
unsafe behavior were included if appropriate. Several graphs of the participant's weekly and cumulative performance with regard to unsafe behaviors and seatbelt use were also provided. This report card also included a summary graph depicting their own seatbelt usage, as well as that of their passengers. If there were no events captured for the week, a report card was still sent showing the cumulative progress of the participant. Parents were expected to review each video clip on their home computer with their teen and discuss the information provided in the weekly report card. This phase lasted for approximately 6 months.
In Phase 3, the baseline process will be repeated. Drivers will not be receiving feedback from the system or any parental mentoring. The LED light on the video recorder will be disabled so that the driver will have no way of knowing whether the system is recording an event or not. Our intent is to determine whether or not participants will return to their previous driving behavior (i.e., baseline threshold excee-dance levels) when feedback is terminated. This phase will last for approximately nine weeks. As of the writing of this paper, phase 3 has not been completed.
3.5. Data analysis
Every event captured by the system was reviewed to deter-mine its cause and then classified into one of the following categories:
▪ Incident: a threshold exceedance in which the driver's action, either intentional or unintentional, was responsible for a safety-relevant event.
▪ Near-crash:a threshold exceedance in which an evasive maneuver was performed in order to avoid a collision.
▪ Crash:a collision with an object or vehicle occurred.
▪ Good response: a threshold exceedance in which the driver's action occurred in response to an external event.
▪ Invalid trigger: a threshold exceedance caused by the vehicle hitting a bump/pothole in the roadway.
▪ Invalid with feedback: an invalid trigger (see above), however, as the video was reviewed there emerged a safety-relevant concern (e.g., video contained evidence of driver/passenger unbelted, failing to stop for traffic signs/ signals, cell phone use, etc.).
▪ Manual: a trigger caused by the driver or passenger pressing a button on the device. This happened for a variety of reasons (e.g., weekly odometer readings, capturing the actions of other vehicles, recording passengers, etc.).
▪ Non-participant: a threshold exceedance or manual activation that occurred while someone other than the participant was driving the vehicle. These video events were not reviewed and deleted.
Once the causes of the events were determined, those requiring feedback were analyzed further. The events were scored to populate a database containing the nature of the event, its cause, the number of vehicles involved, and the
action of the driver that caused the event. Safety-relevant data were also recorded, including information about seat belt use, the presence of loud music, and aggressive or reckless driving. Information about the number, location, and age of passengers and whether or not they were belted was also entered into the database. Environmental factors such as weather, light, road conditions, road geometry, and road type were also recorded. Driver-related factors such as distraction, fatigue, and social influence of passengers were also coded (if present).
Analyses were divided into two groups: incidents and safety-relevant events. ‘Incidents’reflect only true triggers.
‘Safety-relevant events’ are comprised of incidents and invalid triggers where safety concerns are present. Because the true trigger is less prone to idiosyncratic characteristics of the driving environment, such as the prevalence of rough roads, it is a better metric that is more comparable in future studies. This rural group spent the majority of their time on rough rural roads, which caused many invalid triggers. A more urban group traveling on smoother roadways would likely have fewer invalid triggers.
4. Results
4.1. Phase 1— Baseline
The baseline period began mid-March 2006 and lasted approximately nine weeks. During that period, participants drove a total of 43,401 miles, as measured by their weekly odometer readings. Mileage varied greatly from person to person and ranged from 795 miles to as much as 3,406 miles during the baseline. On average, participants drove approx-imately 36 miles per day, which primarily reflected their daily commute to-and-from school.
During this baseline period, the device was triggered over one thousand times. Of those, 389 were determined to be safety-relevant events. We considered safety-relevant events to be any events that required parental feedback: either reinforcement of good behaviors or a discussion of their risky maneuvers. Table 1shows the distribution of safety-relevant events recorded during baseline.
The 376 safety-relevant events (excluding the 13 good responses) translate into an average of 8.6 events per 1000 miles across all participant drivers. Further analysis of these events revealed that the participants were divided into two distinct groups: one group of 18 drivers averaged 2.5 events per 1000 miles, the other group of 7 drivers averaged 23.4 events per 1000 miles, almost ten times the rate of the first group.
Table 1
Safety-relevant and good response events triggered during baseline
Type of Safety-relevant events Total
Invalid triggers with safety-relevant concerns 130 Incidents (including near-crashes and crashes) 246
Drivers' actions resulted in 246 incidents (including three near-catastrophic crashes and one air-bag crash), which translated to an average of 5.7 incidents per 1000 miles driven. The ‘low frequency’ group averaged 2.0 incidents per 1000 miles while the‘high frequency’group averaged 14.7 incidents per 1000 miles. Interestingly, the two teen drivers involved in the near-crashes and crash were from the
‘high frequency’group.
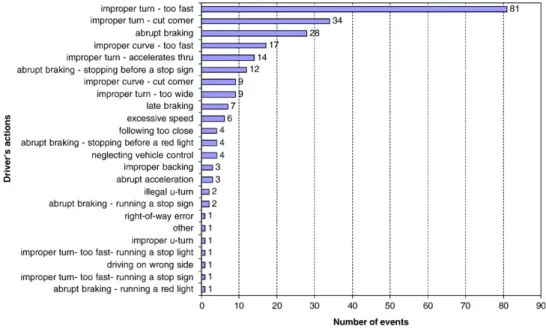
Fig. 3shows the driver's actions that contributed in these 246 incidents (including near-crashes and crashes) and found that the most common actions were taking a 90-degree turn too fast, cutting a corner during a turn, or braking abruptly. By combining all types of improper turns, curves, and braking actions into single categories, differences in the two driver groups were also revealed (seeFig. 4). The two driver groups differed in the way they negotiated sharp curves and 90-degree intersection turns. The ‘high frequency’ group triggered the device 26 times while negotiating a curve, while the ‘low frequency’ group registered no triggers (t =−7.51, pb.0001). The high frequency group also triggered the device almost four times more often while making 90-degree intersection turns compared to the low frequency group (t = 10.68, pb.0001). The two groups also differed signifi-cantly in the number of abrupt braking events (t = 3.73, pb.01). In the next set of analyses, we investigate whether our intervention (i.e., video feedback and parental mentoring) help-ed rhelp-educe the number of safety-relevant events for all drivers, and especially for the‘high frequency’group of 7 drivers.
4.2. Phase 2— Intervention
The intervention phase started during May 19–24, 2006, and will conclude the last week of February 2007 (total duration: 40 weeks). We are reporting data for the first 36 weeks of intervention, organized into four, nine-week
periods. Nine-week segments were chosen because the baseline period lasted approximately that amount of time.
During the intervention phase, participants received visual feedback in the form of a blinking LED light on the DriveCam unit whenever they exceeded the lateral or longitudinal acceleration threshold values. In addition to immediate feedback, they also received a weekly graphical summary of their performance relative to their peer group and a CD containing video clips of all safety-relevant events. Since the beginning of the 36-week intervention, the teen drivers have accumulated more than 249,790 miles (indepen-dent of the baseline). Although the intervention phase started towards the end of the school year, participants' daily average mileage remained about the same throughout, showing no difference between their summer break (through week 17) and return to school. They averaged 36 miles per day during the baseline and have averaged approximately 40 miles per day throughout the intervention period (seeFig. 5).
Fig. 3. Frequency distribution of driver’s actions that resulted in an incident, near-crash, or crash during the baseline portion of the study. Fig. 4. Number of incidents involving abrupt braking and the negotiation of curves and turns for the driver groups‘high’and‘low’frequency.
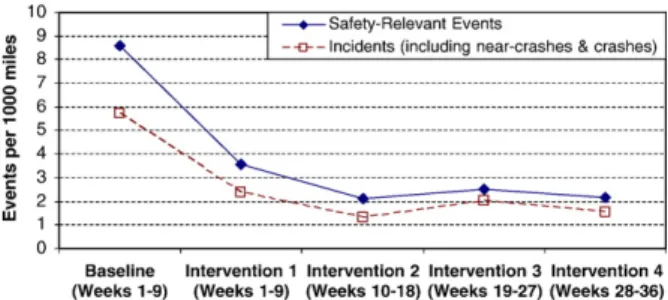
Fig. 6shows that the intervention resulted in a significant reduction in the number of safety-relevant events. In the first nine weeks of the intervention, the drivers reduced their rate of safety-relevant events from an average of 8.6 events per 1000 miles during baseline to 3.6 events per 1000 miles. As a group, they cut their safety-relevant events by a little over half in the first nine weeks (58% reduction). The group further reduced its rate of events to 2.1 per 1000 miles in the following nine weeks (weeks 10 thru 18), achieving a 76% reduction rate from the baseline. This drop from 8.6 to 2.1 events per 1000 miles driven was statistically significant (t = 4.15, pb.0007). The participants averaged 2.0 to 2.5 safety-relevant events per 1000 miles for the final two nine-week periods. As shown in
Fig. 7, a similar reduction pattern emerged for the incidents, including near-crashes and crashes (t = 4.34, pb.0003).
Of interest is whether the reduction in safety-relevant events during the first nine weeks of intervention was the same for all drivers.Fig. 7shows that the two driver groups reacted differently to the intervention. The 18‘low frequency’drivers did not change their behavior significantly — essentially demonstrating a floor effect, maintaining an average of approximately 2.0 safety-relevant events per 1000 miles driven throughout baseline and the entire intervention phase. However, the seven ‘high frequency’ drivers showed a dramatic 72% reduction, dropping from an average of 23.4 to 6.4 safety-relevant events per 1000 miles in the first nine weeks of the intervention. After an additional nine weeks of the feedback intervention, the seven‘high frequency’drivers
group further dropped their safety-relevant events by 89% from the baseline, averaging 2.6 events per 1000 miles. They have maintained an average of 3.0 events per 1000 miles throughout the remaining weeks of the intervention, slightly above the other group. The interaction between driver group and phase was significant (F(4,92) = 37, pb.0001).
A similar pattern emerges for the incidents (including near-crashes and crashes), where the seven‘high frequency’ drivers benefited the most from the intervention, dropping their higher incident rates to almost the level of their‘low frequency’ peers after 18 weeks of intervention. The interaction between driver group and phase was significant, F(4,92) = 24.09, pb.0001.
Fig. 8 illustrates the distribution of the most frequently observed driver actions that resulted in an incident (including near-crashes and crashes) during baseline and the intervention. The top four maneuvers that triggered events during both phases were taking a 90-degree turn too fast, braking abruptly, cutting corners while turning, and taking a curve too fast.
In general, the overall incident rate dropped with the intervention. Some dropped dramatically, like‘taking a turn too fast,’which declined by 81%. ‘Accelerating through a turn’rarely occurred after the intervention. Some maneuvers remained constant and one category ‘braking abruptly’ increased for one nine-week period during the intervention. A clearer pattern emerged once we combined all types of improper turns, curves, and braking actions into single categories. When analyzing the baseline data (seeFig. 4), we noticed that the two driver groups differed in how they negotiated curves and turns.Fig. 9shows that the intervention also had distinct effects on the two groups of drivers. Both groups had fewer incidents involving improper 90-degree turn negotiations; however, the‘high frequency’group showed the greatest reduction in these types of incidents. A similar pattern was found for incidents involving the negotiation of a curve.
Interestingly,Fig. 10shows that the dramatic increase in abrupt braking during Phase 3 of the intervention (weeks 19–27) was largely due to the‘low frequency’group rather than the ‘high frequency’ drivers. Both driver groups experienced a higher frequency of incidents involving abrupt braking of all types; however, the ‘low frequency’ group more than doubled its number of incidents during that intervention phase, whereas the ‘high frequency’ group showed only a slight increase.
Fig. 7. Average number of safety-relevant events per 1000 miles for the
‘high’and‘low frequency’driver groups. Fig. 5. Average mileage driven per day during baseline and intervention
phases.
Fig. 6. Average number of safety-relevant events and incidents (including near-crashes and crashes) per 1000 miles for all drivers during the baseline and intervention phases.
4.3. Seatbelt use
We also collected information on seatbelt usage for drivers. During the baseline, the teen drivers wore their seatbelt in 81.8% of the incident events recorded. Even though driver seatbelt usage was already high during baseline, the intervention further increased it to 96.9% in the first nine weeks, a 15.1% increase.
5. Discussion
Overall, we found that the video feedback and parental mentoring intervention resulted in a significant decrease in participants' number of safety-relevant events. This decrease was evident within the first nine weeks of intervention. However, not all drivers responded equally to the interven-tion. The seven drivers who had the highest rate of safety-relevant events during baseline benefited the most from the intervention. This group dropped their incident rate signif-icantly during the first nine weeks, and continued this trend, dropping their rate of events by 89% by week 18. The most dramatic improvement was seen in improper negotiation of curves and 90-degree turns. The ‘low frequency’ group remained fairly constant throughout, except for a short-term increase in braking events during intervention weeks 19–27.
5.1. Effect on safety-relevant behaviors
The principal objective of this research was to examine whether a video feedback intervention would reduce
safety-Fig. 9. Frequency of incidents (including near-crashes and crashes) involving improper 90-degree turn negotiation (i.e., cutting corner, going too fast, taking it too wide, accelerating through) for the two groups of drivers.
Fig. 10. Frequency of incidents (including near-crashes and crashes) involving abrupt braking of all types (e.g., before a stop sign or red light) for the two groups of drivers.
relevant driving events. Our assumption is that fewer safety-relevant events correspond to fewer crashes and ultimately to fewer teen fatalities. The video feedback intervention did have a positive effect on driving behavior. It reduced the number of driving events that might be associated with greater crash risk. It also enhanced driving behaviors that were not directly linked to the triggering of the camera, such as driver's seatbelt use.
Regarding the reduction of those events that might be associated with increased crash risk, the greatest decline was seen with those connected with turn and curve negotiation. We saw a five-fold decrease in the number of incidents attributable to taking a 90-degree turn too fast. This is an important finding, since 22% ofallfatalities involve a single vehicle at a junction-intersection (and/or are junction-related) (NHTSA, 2005). These speed-related-at-junction crashes can also involve loss of control and the potential for a roll-over. Furthermore, rural crashes are more fatal than urban (NHTSA, 2001). Therefore, this particular crash scenario could benefit from an interven-tion of this type.
The intervention also influenced behaviors not directly tied to the triggering of the camera. Seat belt use increased substantially and this could save many lives independent of how the video feedback intervention might influence the frequency of safety-related driving events. Belt use for this group increased to 97%, which is significant considering previous research indicates only a 52% seat belt use rate among teens involved in potentially fatal crashes (McCartt & Shabanova, 2003). Since it is well known that seatbelt use is habitual, increasing belt use could have safety benefits that persist over the lifetime of the driver.
One promise of the video feedback intervention consid-ered in this study is that it would reduce teen fatalities by helping them learn to drive more safely during their first months of unsupervised driving. One explanation for the reduction in events is that the teens modified their behavior by learning to slow down for turns, curves and intersections, plan ahead, and look further down the roadway to allow themselves more time to react to traffic situations. If this video feedback intervention accomplished only this, it could save thousands of lives. The second promise of this type of intervention is that it might translate into long-term changes in driver behavior that would follow the teens into adulthood. A persistent change in driving habits could have a substantial effect on fatalities, as it would ultimately reduce the crash rate of the entire driving population. If habits, such as seatbelt use, persist through adulthood, the video intervention could have the potential to save tens of thousands of lives. A multi-year longitudinal study is needed to assess the long-term effects of this intervention.
5.2. Implications of the video feedback intervention for GDL
While these preliminary data offer compelling results, implementing such an intervention on a large scale presents some challenges. Success depends on teens' acceptance of the
technology. The video feedback intervention could expand current GDL programs in two different ways. One way to view GDL is as law that forces teen drivers to comply with restrictions. According to this perspective, the state and the parentsmonitorteens for compliance with the GDL limits. A second way to view GDL is as a system of tools to help parents structure the exposure of teens to the hazards of driving in a way that they can learn and be safe. According to this perspective, the state and the parentsmentorthe teen driver in learning how to drive safely. Depending on how GDL is viewed, the technology used in this video feedback intervention could complement current GDL programs as either a tool for monitoring the teen or as a tool to help parents mentor the teen (Lee, 2007).
The monitoring approach to GDL suggests that the state and parents use the video feedback intervention to enforce compliance with the GDL regulations. This approach might even target risky teens—through moving violations or at-fault crashes. While requiring such technologies may seem unconventional, the states have set a precedent for requiring on-board technologies for drunk-driving convictions. All states now allow convicted first-time drunk-drivers to install a breath alcohol ignition interlock device (BAIID) into their vehicles if they wish to continue driving. One disadvantage to the monitoring approach is that it might create an adversarial relationship between the teens and those monitoring them. A second disadvantage is that the state DOT infrastructures are often overloaded, so adapting a video intervention program would have to be self-sustaining in terms of cost.
The mentoring approach to GDL suggests that the state and parents use the licensing process as a partnership between teens and parents. Using this type of approach parents would continue to mentor their teens after they begin independent driving. Like previous research that indicates that adults riding in the vehicle provide a protective effect (Mayhew et al., 2003), the data from our video feedback intervention showed a similar indirect effect. The continued involvement of the parents in their teens' driver training reduced the number of risky driving behaviors they engaged in. Considering GDL, and our video feedback intervention, as a mentoring approach avoids an adversarial situation and is much more likely to be accepted by the teens.
If video feedback technology is implemented as a way to mentor teen drivers by managing their risk, its success will depend on sustained parental involvement. There are clear indications that parental involvement in the supervision of novice teen driving positively affects teen driver safety (Simons-Morton & Ouimet, 2006). A safety benefit only is realized if parents enforce all aspects related to the use of the car to ensure their teen continues to be a safe driver (Simons-Morton et al., 2003).Simons-Morton et al. (2003)
showed that even brief interventions at the time of teen provisional licensure have proven successful in increasing parental restrictions on teen driving privileges. Therefore an extended intervention that provides many opportunities for feedback could have substantial benefits.
5.3. Limitations
Although our findings suggest a compelling benefit for this video feedback intervention, several considerations should temper the generalization of these findings. First, because we chose a small rural high school, we were unable to get a large enough group of teens who recently turned 16 and/or recently obtained their driving license. Upon induction into this study, some participants were already 17-years old and some had been driving for a year. As a consequence, our data do not address the critical first months of driving. The effect of feedback during that period might be different than what we observed. Subsequent studies in larger suburban schools will enable us to control age and experience more precisely.
Second, this pilot study was a quasi-experimental design where there was no between-subject control group (Cook, Campbell, & Peracchio, 1991). We were therefore unable to control for maturation and history effects that might also be present in the data. However, the abrupt and dramatic decline in events following the feedback is not easily explained by a gradual ongoing maturation process. In addition, the distribution of ages and driving experience served as a partial control for maturation effects. Any effect of maturation would be distributed across the data in such a way that it is quite unlikely that any maturation process would come into effect at the start of the intervention. To avoid confounding maturation and history effects with the intervention, subsequent studies should add a true control group that receives no feedback from the event-triggered video system or parents.
Third, since participation was strictly voluntary, partici-pants in this study may not have been representative of the general teen population. However, the fact that we saw two distinct groups of low-event and high-event drivers suggests that our sample was not limited to a self-selected population of
“safe”drivers. Most behavioral intervention research suffers from this limitation as the type of people that volunteer for research may not possess the same attributes as the general population. Future studies will also suffer from this limitation because random assignment selection is not possible.
Fourth, the underlying assumption is that the 23 incidents per 1000 miles represents a greater crash risk than the 2.6 per 1000 miles, and that lowering the rate will lower crash risk. With this small data set, we are unable to compare the crash rates of these drivers to the general population or to correlate crash rates with event rates. A recent naturalistic study suggests that near crash events, similar to the incidents observed in this study, often reflect the same influences as crash rates. Factors that led to increased incidents were also associated with increased crash rates (Klauer, Dingus, Neale, Sudweeks, & Ramsey, 2006). Future studies that include hundreds or thousands of participants will be better able to measure overall crash effects.
Finally, we only had 25 participants in this study; however, the exposure for this small group of drivers was almost 300,000 miles of driving in just 10 months, which
equates to about 14,000 miles per year. The relatively high mileage of the teens in this study departs from the national average of reported teen miles. The National Household Travel Survey (NHTS) found that 16- and 17-year-old drivers estimated 7,000–10,000 miles of driving per year (NHTS, 2001). These estimates are only provided as a general comparison. The NHTS data are difficult to compare to our data because it is based on driver estimates and not actual mileage (e.g., odometer readings) and the 16-year-old drivers in the NHTS may have been driving for only a part of the year. A population of drivers who did not drive as often may be involved in fewer events and have less feedback, likely diminishing the learning effect seen in this study. Furthermore, this study included a non-representative sample of rural drivers, which may not generalize to urban and suburban drivers.
5.4. Conclusion
This research shows that an event-triggered video system, paired with feedback in the form of a weekly graphical report card and video review, can reduce unsafe driving behaviors when reviewed by teens and their parents. These results suggest that incorporating both the video and parental involvement in driver training can significantly reduce the number of unsafe driving events of newly licensed teens. This feedback may help teen drivers, particularly those who experience a large number of incidents, become aware of their unsafe driving behaviors and improve their driving.
Acknowledgements
The authors wish to thank Ted Loerke, Sam Geraci, and Ryan Rist at American Family Insurance for the generous research grant that funded this project. We also would like to thank Rusty Weiss and DriveCam for their time and efforts to make this a successful project. Thanks also go to our editor, Teresa Lopes for her help in preparing this manuscript. Jeff Dolan, Jeff Whitney, Corey Kreutz and Jeff Gordon from the National Advanced Driving Simulator Instrumentation Engineering group installed and maintained our students' systems. Finally, we are enormously grateful to the dedi-cated faculty, staff and students at Clear Creek Amana High School in Tiffin, Iowa, especially to principal Tom McDonald, and secretaries Jill Dietrich and Deanna Webster.
References
Chen, L. -H., Baker, S. P., Braver, E. R., & Li, G. (2000). Carrying passengers as a risk factor for crashes fatal to 16- and 17-year-old drivers.JAMA, 282(12), 1578−1582.
Cook, T. D., Campbell, D. T., & Peracchio, L. (1991). Quasi experimentation. In M. D. Dunnette & L. M. Hough (Eds.),Handbook of industrial and organizational psychology(pp. 491−576).
Dee, T. S., Grabowski, D. C., & Morrisey, M. A. (2005). Graduated driver licensing and teen traffic fatalities. Journal of Health Economics,24, 571−589.
Fischhoff, B. (1975). Hindsight foresight: The effect of outcome knowledge on judgment under uncertainty.Journal of Experimental Psychology-Human Perception and Performance,1, 288−299.
Hoffrage, U., Hertwig, R., & Gigerenzer, G. (2000). Hindsight bias: A by-product of knowledge updating?Journal of Experimental Psychology-Learning, Memory, and Cognition,26(3), 566−581.
Insurance Information Institute [III]. (2007).Teen drivers—hot topics and issues updates.As found on January 31, 2007 at:http://www.iii.org/ media/hottopics/insurance/teendrivers
Insurance Institute for Highway Safety [IIHS]. (2004).Q&A:Teenagers: General as of March 2004.As found on May 17, 2005 at:http://www. iihs.org/safety_facts/qanda/teens.htm
Lee, J. D. (2007). Technology and the teen driver. Journal of Safety Research,38(2).
Klauer, S. G., Dingus, T. A., Neale, V. L., Sudweeks, J., & Ramsey, J. (2006). The impact of driver inattention on near-crash/crash risk: An analysis using the 100-Car naturalistic driving study data.US DOT technical report DOT HS 810 594 Washington, DC: U.S. Department of Transportation. Mayhew, D. R., Simpson, H. M., & Pak, A. (2003). Changes in collision
rates among novice drivers during the first months of driving.Accident Analysis and Prevention,25, 683−691.
McCartt, A. T., & Shabanova, V. I. (2003).Teenage seat belt use: White paper.NSC airbag and seat belt safety campaign.http://www.nsc.org/ public/teen0702.pdf
McCartt, A. T., Shabanova, V. I., & Leaf, W. A. (2003). Driving experience, crashes and traffic citations of teenage beginning drivers. Accident Analysis and Prevention,35(3), 311−320.
Milgrim, J. (2005). Legislature bill cuts insurance if teen drivers are monitored.Article from Ottaway news service appeared on record online April 13, 2005. As found on May 25, 2005 at:http://www.recordonline. com/archive/2005/04/13/scars13.html
National Highway Traffic Safety Administration [NHTSA]. (2001).Traffic safety facts-rural/urban comparison. DOT HS 809 524.Washington, DC: Author.
National Highway Traffic Safety Administration [NHTSA]. (2005). Fatality analysis reporting system.US DOT. As found on February 22, 2007 at: http://www-nrd.nhtsa.dot.gov/departments/nrd-30/ ncsa/
National Highway Traffic Safety Administration [NHTSA]. (2006).Young Drivers Traffic Safety Facts (2005 Data)—DOT HS 810 630. National Household Travel Survey [NHTS]. (2001). As found on January
31, 2007 at: http://www.bts.gov/publications/highlights_of_the_2001_ national_household_travel_survey/
Shope, J. T. (2006). Influences on youthful driving behavior and their potential for guiding interventions to reduce crashes.Injury Prevention, 12(Suppl I), i9−i14.
Simons-Morton, B. G., Hartos, J. L., & Beck, K. H. (2003). Persistence of effects of a brief intervention on parental restrictions of teen driving privileges.Injury Prevention,9, 142−146.
Simons-Morton, B., & Ouimet, M. -C. (2006). Parent involvement in novice teen driving: A review of the literature.Injury Prevention,12(Suppl I), i30−i37.
Williams, A. F. (2003). Teenage drivers: patterns of risk.Journal of Safety Research,34, 5−15.
Appendix A. Weekly report card example
Driver Suzie Clipper
Week Week 36—Friday, January 19th to Thursday, January25th, 2007
This Week's Events Number of overall events recorded: 1
Number of false triggers (e.g., pothole): 1
Number of events requiring feedback: 0
Safety-relevant video file names and comments
None
Other safety-relevant events recorded
None
Seatbelt use for driver 100%
Goals for next week
•
Keep up the good work!Reminders for the week
Important Information—Please READ!!!
•
Remember to take the time to clean off/scrape your windows before you begin driving. Be careful in the morning and after dark when the snow that has melted during the day freezes and the roads become icy.•
Download and record an odometer reading once a week. Let me know if you are having any problems.Daniel V. McGeheeis the director of the Human Factors and Vehicle Safety Research Division at the University of Iowa Public Policy Center. In addition to his primary appointment in Public Policy, he also holds adjunct appointments in the University of Iowa Colleges of Engineering, Public Health, Injury Prevention Research Center and the National Advanced Driving Simulator. His interests are in driver performance and behavior, interface design, technology test and evaluation and safety policy. He has been at the University of Iowa since 1993 and previously worked in the advanced flight deck research department at Boeing.
Mireille Raby has been a research scientist in the Human Factors and Vehicle Safety Research Division at the University of Iowa Public Policy Center since 1998. Ms. Raby is a Human Factors specialist who specializes in field logistics, data coding and analysis. She has been the lead analyst on several field studies that have examined driver/operator behavior. In the automotive domain she has examined the effect of a lane awareness system in snowplows and driver distraction work with a variety of user interfaces. Prior to coming to the University of Iowa, Ms. Raby worked as a Research Scientist at the Battelle Human Factors Transportation Center, where most of her work focused on the application of human factors principles to maritime safety.
Cher Carneyis a research associate in the Human factors and Vehicle Safety Research Division at the University of Iowa Public Policy Center. Ms. Carney has supported a number of field and simulator-based research programs and specializes in data coding and video analysis. She has spent the last two years conducting video analyses of driver distraction for a consortium of automotive companies. Prior to joining the University of Iowa, she was a Research Scientist at the Battelle Human Factors Transportation Center in Seattle. While at Battelle, Ms. Carney was involved in a variety of transportation-related research. She aided in the development of human factors design guidelines for in-vehicle display icons and other information elements, Advanced Traveler Information Systems (ATIS) and Commercial Vehicle Operations (CVO) components of an Intelligent Vehicle Highway Systems (IVHS) project and was involved extensively in the development of a comprehensive guideline document for the design of ATIS.
John D. Leeis a Professor in the Department of Mechanical and Industrial Engineering at the University of Iowa where he directs the Cognitive Systems Laboratory. He also holds adjunct faculty appointments in the Public Policy Center, Colleges of Medicine, Public Health, and is affiliated with the National Advanced Driving Simulator. His research enhances the safety and acceptance of complex human-machine systems by considering how technology mediates attention.
Michelle L. Reyes is a research assistant in the Cognitive Systems Laboratory at the Center for Computer-Aided Design. Her research interests include driver distraction, workload, and performance, as well as in-vehicle information systems, eye movements, and physiological measures. She received a B.S. degree in industrial engineering with a focus in human factors and minor in psychology from The University of Iowa in 2002.