Texas State Capitol Complex:
Thermal Energy Storage &
Combined Heat and Power
Feasibility Study
Prepared for:
Texas Facilities Commission
Austin, TX 78705
Contract No: 10-115-000 IAC
Texas State Capitol Complex
Texas Facilities Commission
CHP Feasibility Study
January 20, 2011
Page
2
of
27
Prepared by:
Krishnan Umamaheswar, LEED AP, CEM, CDSM
Project Analysis and Support
O: (281) 363-7906
M: (979) 575-9471
[email protected]
Daniel Bullock, M.S., M.P.Aff.
Director
O: (281) 364-6087
M: (832) 654-5424
[email protected]
Contractual
This analysis and report were undertaken through interagency cooperation contract (TFC
Contract No. 10-115-000 IAC) between Texas Facilities Commission and the Geotechnology
Research Institute at the Houston Advanced Research Center.
Disclaimer
The Gulf Coast Clean Energy Application Center employed its best professional effort in this study and it is offered on a best effort basis only. Neither the Houston Advanced Research Center, the U.S Department of Energy, nor any of their employees make any warranties, express or implied, nor assume any legal liability or responsibility for the accuracy, completeness, or usefulness of any information in this report. Reference herein to any companies, specific commercial products, processes, or services by trade name, trademark, manufacturer, or otherwise does not constitute or imply any endorsement or recommendation. The Detailed Analysis report is not an investment grade audit. This analysis will establish whether CHP is technically an economically viable for the site, but the results may not reflect the best or optimal CHP configuration. The Texas Facility Commission should work with qualified developers, equipment suppliers, or engineering firms to establish detailed configurations for optimal performance. Texas Facility Commission assumes all risk of using any and all portions of the information provided in the report.
Texas State Capitol Complex
Texas Facilities Commission
CHP Feasibility Study
January 20, 2011
Page
3
of
27
Table of Contents
Executive Summary ... 4
Introduction ... 5
Combined Heat and Power Overview ... 6
Campus Profile ... 7
Campus Energy Loads ... 9
Thermal Energy Storage Analysis ... 14
CHP System Analysis ... 19
Environmental Analysis ... 25
Appendix A. Useful Links & More Information ... 27
Appendix B. Phase 1 TES Analyses : Load Profiles & IRR calculations ... 27
Appendix C. Phase 2: CHP Analyses : Hourly Load Profiles and IRR Calculations ... 27
Texas State Capitol Complex
Texas Facilities Commission
CHP Feasibility Study
January 20, 2011
Page
4
of
27
Executive Summary
The Texas Facilities Commission (TFC) had requested the US Department of Energy’s Gulf
Coast Clean Energy Application Center (GC RAC) to analyze the feasibility of a thermal energy
storage tank (TES) and a combined heat and power (CHP) system to meet the electric loads for a
select number of existing buildings and 1.3 million square feet of new construction office space
at the State Capitol complex in Austin, Texas.
Based on discussions with TFC, the GC RAC gathered all the requisite data and modeled the
hourly electric, chill water and heating hot water needs of the building stock. Subsequently, the
installation of different sized TES tanks was analyzed in terms of impact on peak demand,
capital costs, utility savings, simple payback and resultant Internal Rate of Return (IRR). The
installation of a CHP system capable of serving all of the electric and heat loads, for each of the
different sized tanks was then analyzed.
The impacts of the installation of TES tanks sized at 2.5, 4.5, 6.5, 8.5, 10.5 and 12.5 million
gallons were analyzed. In addition to producing demand savings during the peak period, TES
tanks can offset the capital required to replace aging chillers. Incremental capital costs ranged
between
$1.1 – $11.5 million
resulting in a IRR ranging between
23.4% - 6.9%.
As the tank
size increased (from 2.5-12.5 million gallons), the capital costs increased and a reduction in the
IRR was observed.
A CHP system consisting of multiple natural gas turbines and an extraction steam turbine,
capable of serving all the electricity needs for the building stock was analyzed. The system’s
operation was applied to the different hourly load profile scenarios (based onTES tank size). The
analysis inculded a scenario under which no TES tank would be installed. Capital costs ranged
between
$46.5 - $57.1 million
, resulting in annual savings of
$4.6 - $5.2 million
and IRR’s
ranging between
10.2% - 5.5%.
As the tank size increased (from 0-12.5 million gallons), the
capital costs increased and a reduction in the IRR was observed.
The impact of the CHP system on the environment was also analyzed. Along with significant
reductions in NO
x, SO
x, water and mercury, the installation of the CHP plant would result in a
reduction of CO
2by
50,496 tons/year
. This reduction would be equivalent to removing the
carbon that would be either absorbed by
10,405 acres of forest
or emitted by
8,340 cars
.
The summary of findings are bulleted below
Simple Paybacks ranging from 9 -12 years
Capital Investments ranging from $46 million - $57 million
Annual Utility Savings ranging from $4.6 million – $5.2 million
Internal Rates of return ranging from 5.5% - 10%
The remainder of the report details the methodology and results of the analysis in much greater
depth. The GC RAC looks forward to discussing the results of this analysis with TFC and
providing further assistance as needed.
Texas State Capitol Complex
Texas Facilities Commission
CHP Feasibility Study
January 20, 2011
Page
5
of
27
Introduction
This report was prepared by the U.S. Department of Energy’s Gulf Coast Clean Energy
Application Center (GC RAC). Located that the Houston Advanced Research Center in The
Woodlands, Texas, the GC RAC is one of eight centers established by the U.S. Department of
Energy to promote the use of combined heat and power (CHP) through outreach programs,
project specific support, and policy development initiatives. The figure below, which shows all
eight regions, highlights the states of Texas, Louisiana, and Oklahoma served by the GC RAC.
The goal of this CHP feasibility study is
to establish whether CHP is technically
and economically
viable.
The detailed
analysis uses simulation software to
determine building loads on an
hour-by-hour basis. Detailed load information
facilitates an in depth comparison of of
the conventional separate heat and power
approach to the combined heat and power
option. The analysis evaluates the life
cycle capital and operating costs of both
approaches using the discounted cash
flow method. The analysis results in a
financial pro forma and internal rate of
return for the CHP project. To accomplish the detailed analysis, the GC RAC engaged in the
following:
On-site meetings with TFC staff including limited walkthrough site-assessment
Data collection including building envelope characteristics, age, area, hours of operation,
type of HVAC systems, current energy consumption, utility rates and costs, and
additional information related to energy supply and use
Hour by hour building simulation using DOE software
Calibration of baseline model to actual utility bills
Hourly simulation of electric and thermal loads with and without CHP
Examination of alternate CHP plant configurations
Use of financial models to generate internal rate of return
This report documents the approach and results of a detailed CHP analysis undertaken by the GC
RAC to assess the viability of implementing a Thermal Energy Storage tank and CHP at the
Texas Capitol Complex in Austin, Texas. The analysis assumes that all of the existing and
planned buildings are served by a single, interconnected district energy system providing chill
water and steam throughout the campus.
Texas State Capitol Complex
Texas Facilities Commission
CHP Feasibility Study
January 20, 2011
Page
6
of
27
Combined Heat and Power Overview
The combined heat and power (CHP) approach can provide chill water, steam, and electricity to
the State Capitol Complex at a much higher energy efficiency than the present supply approach.
In the current practice, electricity is purchased from Austin Energy, much of which is used in
electric chiller to produce chill water to air condition the buildings. Steam is produced by
combusting natural gas supplied by the General Land Office in on-site boilers. In contrast to this
approach, the CHP approach can be used to generate electricity on-site, while using the resulting
heat to off-set boiler and electric chiller use. The CHP approach typically consume 40% less fuel
than the conventional separate heat and power approach, which results in cost savings and
environmental benefits. CHP systems provide a similar degree of cooling and heating comfort
and indoor air quality,
while delivering a
superior level of
power reliability and
power quality. A
schematic comparing
the two approaches is
provided at the right.
In its simplest form,
CHP involves a
conventional natural
gas fired engine
1that
turns a generator to
make electricity. Hot
gases created by combusting the natural gas are captured by a heat exchanger to produce steam.
If the site has a steam need equal to or larger than the amount produced by the CHP system, then
all of the resulting steam can be used to reduce boiler operations, thereby saving the natural gas
normally consumed in the boiler. In cases where the on-site steam needs are less than that
produced by the CHP system, which is the situation at the Texas State Capitol Complex, some of
the steam from the CHP system must be redirected to another productive use. The most common
alternate use is to make chill water by using the steam to drive a stream powered chiller, such as
an absorption chiller or steam turbine chiller, which is the approach considered in this report. In
some cases, excess steam can be used to generate additional electricity, using a steam turbine or
organic rankine cycle technology, although this option is not considered in this analysis. In many
cases, CHP systems also include a thermal energy storage (TES) tank in the design. The addition
of TES allows greater flexibility for making and storing chill water economically.
1 In this case, “engine” is a general term that could refer to number of different types of prime movers including combustion turbines, micro-turbines, reciprocating engines, and fuel cells. For purposes of this study, only combustion turbines are evaluated.
Texas State Capitol Complex
Texas Facilities Commission
CHP Feasibility Study
January 20, 2011
Page
7
of
27
Campus Profile
The Texas State Capitol Complex houses several state-owned buildings located in the central
Austin business district. The campus houses the Texas Capitol building, government office
buildings, the state library, a number of parking garages and surface packing lots. In addition to
the existing building stock, TFC desired the analysis to include an addition of 1.3 million square
feet of new construction comprising additional state office buildings. In order to facilitate the
simulation, information with regards to the building envelope, age, area, hours of operation, type
of HVAC systems was collected from the following sources
Energy Systems Laboratory Group 1 & Group 2 report dated September 2, 2009
Building Info Matrix – provided by TFC
Utility Bills, Logs – provided by TFC
Table 1 summarizes the Buildings, adress and square feet included as part of the study.
Table 1. Buildings included as part of the studyBuilding ID
Building Name
ARC
Lorenzo De Zavala Archives & Library
CVC
Capitol Visitors Center
Capitol
Capitol Extension
DCG
Dewitt C. Greer
INS
Insurance Building
INX
Insurance Annex
JER
James E. Rudder Building
JHR
John H. Reagan Building
PDB
Price Daniel, Sr. Building
SCB
Supreme Court Building
SHB
Sam Houston Building
TCC
Tom C. Clark Building
TJR
Thomas Jefferson Rusk Building.
LBJ
Lyndon B. Johnson Building
REJ
Robert E. Johnson Building
SFA
Stephen F. Austin Building
THO
E. O. Thompson Building
WBT
William B. Travis Building
WPC
William P. Clements Building
Texas State Capitol Complex
Texas Facilities Commission
CHP Feasibility Study
January 20, 2011
Page
8
of
27
HVAC Systems
A Central Utility Plant housing both chillers and boilers provides chilled water and steam to
several buildings at the Complex. There is a second chilled water plant located at the Stephen F.
Austin Building which provides chilled water to SFA, LBJ and WBT. All remainder buildings
have stand-alone chillers and boilers. Table 2 illustrates the chilled water source, heating source,
air systems in each building. Table 3 illustrates the chiller tonnages in each of the plants. The
CPP boilers provide steam for the heating needs to several buildings. However, during the
months of June-September only ARC, CVC, PDB, SCB & TCC receive steam. The remainder
buildings served by the CPP boilers have manual shut offs and do not receive steam during these
peak summer months to minimize simultaneous heating and cooling.
Table 2. HVAC Summary
Bldg ID Chill Water Source Heat Source Air Distribution System Type
ARC CPP CPP Boilers Air Handler w/ VAVs
CVC CPP CPP Boilers Multi Zone w/reheat
Cap CPP CPP Boilers Multi Zone; Fan coils on G & 1st flr
Cap X CPP CPP Boilers Air Handler w/ VAVs
DCG CPP CPP Boilers Fan Coil Units
INS CPP CPP Boilers Air Handler w/ VAVs
INX CPP CPP Boilers Air Handler w/ VAVs
JER CPP CPP Boilers Air Handler w/ VAVs
JHR CPP CPP Boilers Air Handler w/ VAVs
LBJ SFA Chillers LBJ Boilers Air Handler w/ VAVs
PDB CPP CPP Boilers Air Handler w/ VAVs
REJ REJ Chillers REJ Boilers Air Handler w/ VAVs
SCB CPP CPP Boilers Air Handler w/ VAVs
SFA SFA Chillers SFA Boilers Air Handler w/ VAVs
SHB CPP CPP Boilers Air Handler w/ VAVs
TCC CPP CPP Boilers Multi Zone AHUs
THO THO Chillers THO Boilers Multi Zone AHUs
TJR CPP TJR Boilers Air Handler w/ VAVs
WBT SFA Chillers SFA Boilers Air Handler w/ VAVs
Texas State Capitol Complex
Texas Facilities Commission
CHP Feasibility Study
January 20, 2011
Page
9
of
27
Table 3. Chiller InventoryBuild
ing
Manufac
turer
Chiller
Designation
Model Number
Serial Number
Tonn
age
Install
Date
Refrige
rant
JER
Carrier
Chiller # 2 Back
up only
30-11k-060-630
T-736788
75
1982
R22
WPC
Trane
Chiller # 1
CVHE-080F
L85D27519
800
1985
R11
WPC
Trane
Chiller # 2
CVHE-080F
L85D27520
800
1985
R11
WPC
York
Chiller # 3
YTD1E3C3CMFS
Decommission
ed 1986
350
1985
R11
CPP
Trane
Chiller # 3
CVHE1250
L90C00828
1250
1990
123
CPP
Trane
Chiller # 4
CVHF1280
L94B01491
1280
1994
123
REJ
Trane
Chiller # 1
CVHFO55
L98D02613
550
1998
123
REJ
Trane
Chiller # 2
CVHFO55
L98D02622
550
1998
123
REJ
Trane
Chiller # 3
CVHF049
L03J06970
485
1998
123
REJ
Trane
Chiller # 4
RTWAO704X001C
3DOW
U98DO9375
70
1998
R22
CPP
Trane
Chiller # 1
CVHF1470
L01K11227
1470
2001
123
SFA
Trane
Chiller # 2
CVHF1470
L03D04417
1470
2003
123
THO
Trane
Chiller # 1
RTWA1004XE01D
3DOWFT
U03D09933
100
2003
R22
THO
Trane
Chiller # 2
RTWA1004XE01D
3DOWFT
UO3D09934
100
2003
R22
SFA
Trane
Chiller # 1
CVHF1470
L09A06036
1470
2009
123
SFA
Trane
Chiller # 3
CVHF1470
L08M05710
1470
2009
123
CPP
Trane
Chiller # 2
CVHF1470
LI0E02655
1470
2010
123
Campus Energy Loads
Modeling
Subsequent to data collection, each building was modeled using Building Energy Analyzer
TMPro (BEA Pro). At the backbone of the software tool is a DOE-2.1e simulation engine which
uses Typical Meteorological Year – data set 2 (TMY2) to simulate building loads.
BEA Pro uses
8,760 hourly increments for modeling a year to mitigate the risks associated with simulation
using longer time spans. Hourly heating coil load, cooling coil load, electric consumption and
gas use modelled by BEA Pro are among the key outputs used in the load determination at the
Capitol Complex. The electric consumption and gas use was compared primarily to actual utility
bills. If utility bills were unavailable, then the model outputs were compared with load profiles
determined by the Energy Systems Laboratory. In some cases, if no medium of comparison was
available, then reasonable engineering checks were conducted (for e.g. comparison to the
Texas State Capitol Complex
Texas Facilities Commission
CHP Feasibility Study
January 20, 2011
Page
10
of
27
Table 4 lists the error % in the model relative to actual annual electricity consumption for each of
the modeled buildings. Since actual gas bills were unavailable on a building-by building basis, a
similar comparison was not conducted for Gas usage. The net total gas use obtained by the
adding the gas use of each of the modeled buildings served by the CPP was compared to the gas
use at the CPP.
Table 4. Error% - Modeled Electricity vs Actual Consumption
Building ID Error % -
ARC -13%
Capitol, CVC and Extension NA
DCG NA INS -8% INX -3% JER -8% JHR 3% LBJ -9% PDB -11% REJ -7% SCB -13% SFA -12% SHB -1% TCC 0% THO -9% TJR -14% WBT 7% WPC -7%
Capitol Campus Expansion NA
Each Building was modeled and parameters such as lighting density, ventilation requirements,
building envelope were used in the calibration process. Figure 1 & Figure 2 are
sample
screenshots of the input screen
used in the modeling of SHB. Figure 3 - Figure 5 are
sample
output screenshots
subsequent to the simulation for SHB, generated by BEA Pro.
Texas State Capitol Complex
Texas Facilities Commission
CHP Feasibility Study
January 20, 2011
Page
11
of
27
Figure 1. SHB Modeling – Input Screenshot 1
Texas State Capitol Complex
Texas Facilities Commission
CHP Feasibility Study
January 20, 2011
Page
12
of
27
Figure 3. SHB Modeling – Output Screenshot : Heating & Cooling Loads
Texas State Capitol Complex
Texas Facilities Commission
CHP Feasibility Study
January 20, 2011
Page
13
of
27
Figure 5. SHB Modeling – Output Screenshot : Gas Consumption
LOAD AGGREGATION
Subsequent to the determination of hourly electric consumption, gas consumption, heating and
cooling loads of each of the buildings and the new construction space, these values were
aggregated for each of the 8,760 hours in order to determine the net total loads and consumption
at the Capitol Complex.
Most of the data containing the hourly electric, chiller and heat loads
for the individual buildings have been included in the report dated June 18, 2010 and related
spreadsheets have subsequently been emailed to TFC. As a result, they are not presented in the
current report.
Table 5 summarizes this aggregated electricity consumption, chilled water and
heating loads at the Complex.
Texas State Capitol Complex
Texas Facilities Commission
CHP Feasibility Study
January 20, 2011
Page
14
of
27
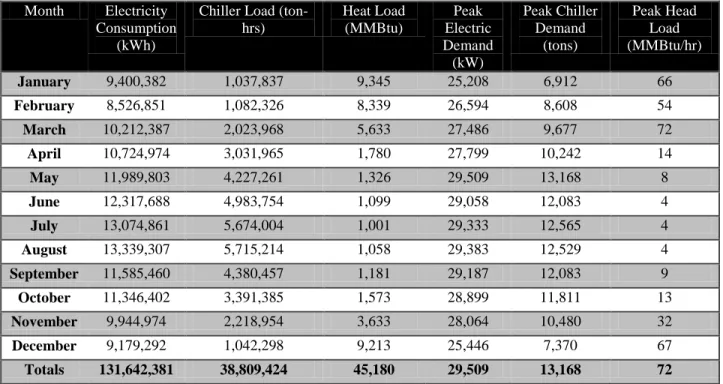
Table 5. Aggregated Electric Consumption and Thermal Loads – Capitol Complex
Month Electricity
Consumption (kWh)
Chiller Load (ton-hrs) Heat Load (MMBtu) Peak Electric Demand (kW) Peak Chiller Demand (tons) Peak Head Load (MMBtu/hr) January 9,400,382 1,037,837 9,345 25,208 6,912 66 February 8,526,851 1,082,326 8,339 26,594 8,608 54 March 10,212,387 2,023,968 5,633 27,486 9,677 72 April 10,724,974 3,031,965 1,780 27,799 10,242 14 May 11,989,803 4,227,261 1,326 29,509 13,168 8 June 12,317,688 4,983,754 1,099 29,058 12,083 4 July 13,074,861 5,674,004 1,001 29,333 12,565 4 August 13,339,307 5,715,214 1,058 29,383 12,529 4 September 11,585,460 4,380,457 1,181 29,187 12,083 9 October 11,346,402 3,391,385 1,573 28,899 11,811 13 November 9,944,974 2,218,954 3,633 28,064 10,480 32 December 9,179,292 1,042,298 9,213 25,446 7,370 67 Totals 131,642,381 38,809,424 45,180 29,509 13,168 72
Thermal Energy Storage Analysis
Central Plant Integration
Due to a desire to serve the existing and new buildings from a single district energy system,
integration of the existing central plants would provide an important initial backbone for future
expansion. Based on feedback from TFC, the costs of these improvements are roughly 5 - 10
million dollars. Subsequent to discussions with TFC, these costs were considered independent
and were not included, while analyzing the simple payback and IRR for the thermal energy
storage tank.
Source of Savings – Thermal Energy Storage
The installation of the Thermal Energy Storage reduces demand charges during the peak period
and helps avoid the purchase of aging chillers. Both these factors were considered as part of the
analysis.
Electricity Rates
Austin Energy currently provides electrical service to the TFC under the State General Service –
Demand (E14) rate. The analysis assumes that the installation of the TES could facilitate a shift
to the Rider TOU – Thermal Energy Storage rate. Austin Energy has specified on peak and off
Texas State Capitol Complex
Texas Facilities Commission
CHP Feasibility Study
January 20, 2011
Page
15
of
27
peak periods and rates for the summer and winter months. Table 6 details the potential new rate
structure, with the installation of the TES.
On-Peak:
4:00 p.m. to 8:00 p.m., Monday through Friday; May 1 through October 31.
Off-Peak:
8:00 p.m. to 4:00 p.m., Monday through Friday; all day Saturday, Sunday, Memorial
Day, Independence Day, and Labor Day; May 1 through October 31. All day November 1
through April 30.
Table 6. Austin Energy – Rate Structure
Winter Billing Months November through April
Summer Billing Months May through October
On-Peak 1.07 ¢ per kWh 1.07 ¢ per kWh
Off-Peak 1.07 ¢ per kWh 1.07 ¢ per kWh
Demand Rate (ELD)
On-Peak $10.94 per kW $11.64 per kW
Off-Peak $10.94 per kW $0.00 per kW
Clauses
Summer Billed Demand: From May through October, the Summer Billed Demand shall be the
highest fifteen-minute demand recorded during the on-peak period. The Summer Billed Demand
shall not be less than 50% of the normal on-peak Summer Billed Demand. If more than 50% of
the customer's load is attributable to cooling, the 50% floor will be waived.
Winter Billed Demand: From November through April, the Winter Billed Demand shall be the
highest fifteen-minute demand recorded during the month, or 90% of the Summer Billed
Demand set in the previous summer; whichever is less.
Thermal Storage Operation
Due to on-peak and off peak time-of-use rates for demand, charging and discharging strategy
will hinge on reducing peak chilling demand coincident with Austin Energy’s definition of peak
and off-peak period. Additionally, in order to maximize the chiller tonnage that can be avoided
for purchase, with the installation of the TES, care was taken to ensure that the TES charge
operation co-incided with times when the building load was the least. This continuous time
frame in summer for the charge cycle was observed to be between 11:00 PM and 6:00 AM. The
charge and discharge cycles of the tank are shown in Table 7.
Texas State Capitol Complex
Texas Facilities Commission
CHP Feasibility Study
January 20, 2011
Page
16
of
27
Table 7. Thermal Storage OperationTank Operation
Summer
Winter
Charge Cycle
11:00 PM to 6:00
AM, Monday
through Friday;
May 1 through
October 31
9:00 PM to 6:00
AM, Monday
through Sunday;
November 1
through April 30
Discharge Cycle
4:00 PM to 8:00
PM, Monday
through Friday;
May 1 through
October 31.
7:00 AM to 8:00
PM, Monday
through Sunday;
November 1
through April 30
Incentives – Thermal Energy Storage Tank
Austin Energy offers an incentive for the installation of a thermal energy storage tank. Table 8
details available incentives. Incentives for the TES were included as part of the analysis.
Table 8. Austin Energy Rebate Schedule - TES
Load Shifted Rebate
1-100 kW $300/kW
101-500 KW $150/kW
>501 kW $50/kW
Analysis
The study analyzed the installation of different TES tank sizes and its subsequent impacts. The
resultant installation shifted hourly electric demands, thereby causing savings due to reduced
peak demand charges and favorable off peak energy rates. Additionally, the installation of the
TES could offset to an extent, the the purchase of additional chiller tonnages. The following
assumptions were made
The average efficiency of the existing chillers was 0.6 kW/ton. The tons of chilling saved
during the peak period were translated to demand savings by multiplying by 0.6 kW.
Note that higher savings would be achievable if it were assumed that the existing chillers
had a lower efficiency (>0.6 kw/ton).
Total as-built costs of new chillers would be $400/ton
The Internal Rate of Return assumed the following
o
Marginal tax rate - 0%
o
Interest/Bond Rate - 5%
o
Projected escalation in Electric Charges - 3% annually
o
Financing & cash-flow period - 20 years
Texas State Capitol Complex
Texas Facilities Commission
CHP Feasibility Study
January 20, 2011
Page
17
of
27
Avoided Chillers
Based on discussions with TFC, with regards to their chiller inventory, it was noted that certain
chillers were nearing the end of their useful life and could potentially need replacement within
the next few years. These chillers are listed in Table 9.
Table 9. Chiller Inventory – Aging Chillers Building Manufactur
er
Chiller Designation Model Number Tonnage Install Date
Refrigerant
JER Carrier Chiller # 2 Back up only 30-11k-060-630 75 1982 R22
WPC Trane Chiller # 1 CVHE-080F 800 1985 R11
WPC Trane Chiller # 2 CVHE-080F 800 1985 R11
WPC York Chiller # 3 YTD1E3C3CMFS 350 1985 R11
CPP Trane Chiller # 3 CVHE1250 1250 1990 123
CPP Trane Chiller # 4 CVHF1280 1280 1994 123
As per discussions with TFC, onsite chiller capacity of relatively new chillers totalled 9,200 tons.
Capacity of the aging chillers listed in Table 9 totalled 4,555 tons. In addition to the chillers
listed, the GC RAC assumes that roughly 3,000 tons of additional chiller capacity will be needed
for the new construction office space. This results in a total tonnage (existing + new) of 16,755
tons. The installation of the TES can offset both the purchase of new chillers as well as the
replacement of existing aging chillers. Equations below list the calculations for avoided chillers
and the associated avoided costs with the installation of the TES. It has been assumed that 1 ton
of chiller costs $400.
Avoided Chillers (tonnage) = 16,755 tons - Peak Electric Chiller Load for different TES
tank size (tons) .
Avoided costs ($) = Avoided Chiller tonnage * $400.
It must be noted that, if the TES were not installed, chillers will have to be purchased for the new
construction as well as to replace existing chillers that are aging. This situation has been
considered the baseline and as a result does not have any savings associated with it.The
installation of the TES would add additional costs, but also produce savings, while
simultaneously offsetting the purchase of chillers. As a result the financial analysis assumes the
incremental benefits of the additional costs and compares these costs to the savings produced,
while calculating the simple payback and IRR.
Texas State Capitol Complex
Texas Facilities Commission
CHP Feasibility Study
January 20, 2011
Page
18
of
27
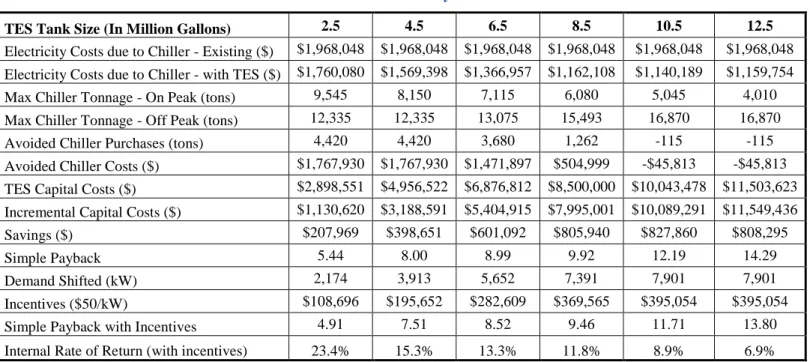
Results
The Results of the Analysis are tabulated in Table 10 . Detailed hourly load profiles, resultant
monthly demand charges and IRR calculations can be found in Appendix B.
Table 10. TES Analysis - Results
TES Tank Size (In Million Gallons) 2.5 4.5 6.5 8.5 10.5 12.5
Electricity Costs due to Chiller - Existing ($) $1,968,048 $1,968,048 $1,968,048 $1,968,048 $1,968,048 $1,968,048 Electricity Costs due to Chiller - with TES ($) $1,760,080 $1,569,398 $1,366,957 $1,162,108 $1,140,189 $1,159,754 Max Chiller Tonnage - On Peak (tons) 9,545 8,150 7,115 6,080 5,045 4,010 Max Chiller Tonnage - Off Peak (tons) 12,335 12,335 13,075 15,493 16,870 16,870 Avoided Chiller Purchases (tons) 4,420 4,420 3,680 1,262 -115 -115 Avoided Chiller Costs ($) $1,767,930 $1,767,930 $1,471,897 $504,999 -$45,813 -$45,813 TES Capital Costs ($) $2,898,551 $4,956,522 $6,876,812 $8,500,000 $10,043,478 $11,503,623 Incremental Capital Costs ($) $1,130,620 $3,188,591 $5,404,915 $7,995,001 $10,089,291 $11,549,436
Savings ($) $207,969 $398,651 $601,092 $805,940 $827,860 $808,295
Simple Payback 5.44 8.00 8.99 9.92 12.19 14.29
Demand Shifted (kW) 2,174 3,913 5,652 7,391 7,901 7,901
Incentives ($50/kW) $108,696 $195,652 $282,609 $369,565 $395,054 $395,054
Simple Payback with Incentives 4.91 7.51 8.52 9.46 11.71 13.80
Texas State Capitol Complex
Texas Facilities Commission
CHP Feasibility Study
January 20, 2011
Page
19
of
27
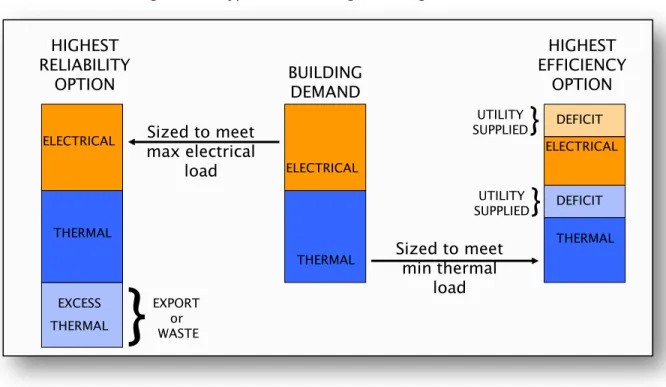
CHP System Analysis
CHP design strategies differ based on several site-specific requirements. At the two extremes,
systems can either be designed for the “highest reliability” – designed to meet peak electric load
at the site or “highest efficiency” – designed to meet the minimum thermal loads. Most CHP
systems are sized between the two scenarios. Figure 6 illustrates the two options, along with the
associated electric and thermal flows.
Figure 6. Typical CHP design strategies
TFC requested the GC RAC to examine the highest reliability option as part of the study. As a
result, the GC RAC has identified a viable CHP system for the Texas Capitol complex, such that
the complex will potentially be independent of Austin Energy for its electricity needs.
2The
system was selected after consideration of a several alternative configurations. The selected
option met general design goals expected to result in high technical and financial performance.
The selected system is capable of serving the aggregated electricity, steam, and chilled water
needs for all the buildings included as part of the study.
It is important to note that while the
highest reliability option provides energy security and independence from the grid, the
associated capital costs are higher and the corresponding IRR’s are lower than that of the
highest efficiency option.
2
While the selected CHP system meets generalized design goals and represents a viable system alternative, it may not be the most desirable or the most optimal solution for the TFC. A more in-depth study may be required to evaluate additional technologies and vendors who could provide a more optimal configuration or address other requirements/constraints of the state.
BUILDING
DEMAND
THERMAL ELECTRICAL EXPORT or WASTE}
HIGHEST
RELIABILITY
OPTION
Sized to meet
max electrical
load
THERMAL ELECTRICAL EXCESS THERMALHIGHEST
EFFICIENCY
OPTION
}
UTILITY SUPPLIEDSized to meet
min thermal
load
THERMAL ELECTRICAL DEFICIT DEFICIT UTILITY SUPPLIED}
Texas State Capitol Complex
Texas Facilities Commission
CHP Feasibility Study
January 20, 2011
Page
20
of
27
TES Operation – Revised
The analyses conducted for the TES and the subsequent charge/discharge cycles was primarily
dictated by the peak period defined by Austin Energy’s E16 time of use schedule. If a CHP Plant
were to be installed, which will cater to all on-site electricity requirements, then the TES will be
rescheduled to operate during “campus peak times” (M-F, 7:00 AM – 7:00 PM). Thus revised
hourly electric and chiller loads, by the different sized TES tanks will be applied and used while
analyzing the CHP system. Since the discharge and charge cycles will now be co-incident to the
campus peak and off peak times, the costs of the avoided chillers (upto 6.5 million gallons), for
lower capacity tanks will change in a way that will benefit TFC. While this is not true for higher
capacity tanks, their installation reduces the peak demand to a higher degree, thereby having a
potential to reduced the initial investment in the size of the CHP plant. Also important to note,
that any savings that would occur by the shift in Austin Energy’s schedules cannot be claimed
while analyzing the CHP plant, since the plant will produce all the electricity needed for the
campus. Table 11 lists the revised cost attributes for the different sized TES tanks.
Table 11. Revised TES Analysis - Results
TES TANK Size (million gallons) 2.5 4.5 6.5 8.5 10.5 12.5 TES Capital Costs ($) $2,898,551 $4,956,522 $6,876,812 $8,500,000 $10,043,478 $11,503,623 Avoided Chiller Tonnage (tons) 4,676 3,359 2,041 724 -594 -1,911 Avoided Chiller Costs ($) $1,870,580 $1,343,571 $816,562 $289,553 -$237,456 -$764,466 Net TES Capital Costs $1,027,970 $3,612,951 $6,060,250 $8,210,447 $10,280,935 $12,268,089
Basis of Analysis
Without a TES, the peak load at the campus was determined to be approximately 29.5 MW. The
campus’ electric, steam and chiller loads exhibit strong variances due to their strong dependence
on both seasonal and diurnal factors. Due to this extreme variability, it was discerned that
“multiple smaller-sized prime-movers”, will be a more optimal solution rather than “one or two
big sized prime movers”. Some of the advantages for this approach are operational flexibility,
prevention of big prime-mover to operate at lower loads (more inefficient and unstable when
operating at less than 50% loaded), ability for the system to meet loads when one or more
turbines are down for maintenance and avoidance of potentially high standby charges from
Austin Energy. The primary disadvantage would be more equipment & higher initial capital
costs. The CHP system that was chosen would consist of multiple prime-movers, multiple heat
recovery steam generators (HRSG) and an extraction steam turbines (condensing). The first
preference will be given to the heat load at the campus. The steam generated by the HRSG will
be diverted to the steam turbine, a portion of which will be extracted at 90 psig to serve the
camputs heat load while producing some electricity. Steam that is not extracted for process needs
will undergo full condensation to produce electricity in “combined-cycle” mode. The analysis
initially assumed the installation of six Mercury 50’s along with extraction steam turbines.
Examination of the results, showed that prime-mover 6, ran between 200 to 1,000 hrs, depending
on the size of the TES tank. An investment of 7.8 million dollars on relatively low run hours was
considered imprudent and as a result, only 5 prime-movers were considered in the analyses, with
Texas State Capitol Complex
Texas Facilities Commission
CHP Feasibility Study
January 20, 2011
Page
21
of
27
requirements of the 6
thprime-mover for the few “outlier hours”, being supplemented by “boiler
steam” to the steam turbine. These additional fuel costs were considered in the anaylsis.
The current Houston Ship Channel price was $4.14/MMBtu , transportation costs were assumed
to be $0.9/MMBtu, resulting in a total gas cost of $5.00/MMBtu. Factoring an annual escalation
of 3%, the gas price at the start of 2014 (assumption that it will take 3 years to build the CHP
plant) would be roughly $5.50 /MMBtu. A similar escalation for electricity costs was included.
Additionally, the calculations for the Internal Rate of Return assumed the following
Marginal tax rate - 0%
Interest/Bond Rate - 5%
Projected escalation in Electric Charges - 3% annually
Projected escalation in CHP fuel costs - 3% annually
Financing & cash-flow period - 20 years
While these assumptions are simple, there is a potential to increase the IRR, if TFC were to
engage in more sophisticated mechanisms of gas purchases such as “varying block purchases of
natural gas” at a pre-determined price and length of time, hedging, futures natural gas contracts,
etc. The investigation of the same is beyond the scope of the current study, but it is
recommended that such financial vehicles be examined further, both to potentially increase the
IRR as well as to protect against natural gas price volatility.
CHP System Overview
A CHP system consisting of 5 Mercury turbines, five heat recovery steam generators and a
Siemens steam turbine was analyzed. The product data from the manufacturer’s cut-sheets is
summarized in Table 12. Detailed specifications and budgetary quote for the equipment can be
found in Appendix D.
Table 12. Selected CHP System
Solar Turbines – Mercury 50
Rated Capacity (MW) 4.6 MW
Number of prime-movers 5
Fuel Input (therms) 405 therms
Steam Production (at 650 psig, 750 deg F ) 8,405 lbs/hr
Siemens – SST 110
Steam Turbine (kW) 5,300 – 8,500 kW
(depending on TES)
Texas State Capitol Complex
Texas Facilities Commission
CHP Feasibility Study
January 20, 2011
Page
22
of
27
Results
The operation of the CHP system was analyzed against multiple baselines, each having different
hourly electric and thermal load profiles caused due to the different tank sizes. Table 13 and
Table 14 summarizes the results. Detailed hourly load profiles and IRR calculations are attached
in the Appendix C. Detailed budgetary quotes representative of anticipated capital costs are
attached along with Appendix D.
Table 13. Plant Operation vs TES Tank Sizes
Plant Operation vs. TES Tank Size NO -
TES 2.5 Million Gallon TES 4.5 Million Gallon TES 6.5 Million Gallon TES 8.5 Million Gallon TES 10.5 Million Gallon TES 12.5 Million Gallon TES Peak Demand (kW) 29,509 28,673 28,004 27,335 26,667 25,998 25,329 Prime-Mover 1 - Average (kW) 4,404 4,437 4,438 4,439 4,440 4,441 4,442 Prime-Mover 2 - Average (kW) 3,818 3,861 3,896 3,910 3,929 3,945 3,963 Prime-Mover 3 - Average (kW) 2,659 2,748 2,841 2,929 2,978 3,022 3,045 Prime-Mover 4 - Average (kW) 1,512 1,481 1,458 1,464 1,502 1,527 1,545 Prime-Mover 5 - Average (kW) 737 716 706 690 669 637 610
Run-hrs for Prime - Mover 1 8,760 8,760 8,760 8,760 8,760 8,760 8,760
Run-hrs for Prime - Mover 2 8,760 8,760 8,760 8,760 8,760 8,760 8,760
Run-hrs for Prime - Mover 3 6,562 6,847 7,073 7,319 7,460 7,538 7,565
Run-hrs for Prime - Mover 4 3,636 3,637 3,653 3,734 3,907 4,030 4,181
Run-hrs for Prime - Mover 5 1,796 1,784 1,809 1,811 1,787 1,760 1,767
Run hrs for Boiler Steam to produce kW 1,082 946 785 646 486 364 255
Steam Turbine - Average kW 2,257 2,211 2,161 2,120 2,088 2,067 2,054
Steam Turbine - max kW 8,555 8,475 7,990 7,327 6,664 6,002 5,339
Table 14. Project Financials vs. TES tank size CHP Plant Financials vs. TES
Tank Size NO - TES
2.5 Million Gallon TES 4.5 Million Gallon TES 6.5 Million Gallon TES 8.5 Million Gallon TES 10.5 Million Gallon TES 12.5 Million Gallon TES Total Gas Cost –
Before CHP ($) 502,717 502,717 502,717 502,717 502,717 502,717 502,717 Total Electric –
Before CHP ($) 10,015,714 9,903,725 9,816,307 9,730,492 9,645,845 9,562,657 9,480,743 Annual Utility Expenditures -
Before CHP ($) 1 $10,518,430 $10,406,442 $10,319,024 $10,233,209 $10,148,562 $10,065,373 $9,983,460
Annual Utility Expenditures -
After CHP ($) $5,329,619 $5,354,972 $5,371,274 $5,390,817 $5,411,475 $5,423,426 $5,430,808 Capital Costs ($) $46,521,830 $47,509,636 $49,851,891 $51,967,871 $53,786,749 $55,525,917 $57,181,751 Savings ($) $5,188,811 $5,051,469 $4,947,750 $4,842,392 $4,737,086 $4,641,948 $4,552,653
Simple Payback (yrs) 9.0 9.4 10.1 10.7 11.4 12.0 12.6
Internal Rate of Return
(IRR) 10.18% 9.45% 8.48% 7.62% 6.87% 6.18% 5.56%
1
Texas State Capitol Complex
Texas Facilities Commission
CHP Feasibility Study
January 20, 2011
Page
23
of
27
The installation of the TES would reduce pre-CHP utility expenditures. Different tank sizes will
result in different baseline expenditures. Table 15 summarizes the monthly baseline expenditures
associated with the different sized TES tanks. Table 16 - Table 18 illustrates the monthly fuel
use, costs and savings associated with the CHP plant when compared with the different tanks
sizes. As can be seen from the tables, while the monthly fuel use is relatively constant, due to the
fixed electricity needs of the campus, the monthly savings differ primarily due to reduced
pre-CHP expenditures that is attributable to savings associated with the increasing TES tank sizes.
Table 15. Monthly Expenditures/Baselines vs. TES tank size
Monthly Fuel Use in MMBtu NO - TES 2.5 Million Gallon TES 4.5 Million Gallon TES 6.5 Million Gallon TES 8.5 Million Gallon TES 10.5 Million Gallon TES 12.5 Million Gallon TES January $823,188 $814,050 $807,115 $800,857 $794,896 $789,132 $783,456 February $785,944 $777,616 $771,441 $765,066 $758,307 $751,308 $744,274 March $845,056 $836,229 $829,280 $822,701 $816,436 $810,511 $804,869 April $830,772 $821,344 $813,803 $806,372 $798,858 $791,676 $784,578 May $924,789 $915,057 $907,271 $899,485 $891,699 $884,090 $876,498 June $932,432 $922,979 $915,417 $907,855 $900,293 $892,908 $885,555 July $970,288 $960,275 $952,265 $944,255 $936,246 $928,236 $920,226 August $983,988 $974,256 $966,470 $958,684 $950,898 $943,112 $935,340 September $900,332 $890,879 $883,317 $875,756 $868,338 $860,963 $853,585 October $890,085 $880,072 $872,062 $864,159 $856,305 $848,661 $841,476 November $817,824 $808,782 $801,968 $795,483 $789,442 $783,617 $778,123 December $813,732 $804,901 $798,615 $792,536 $786,843 $781,161 $775,482 Totals $10,518,430 $10,406,442 $10,319,024 $10,233,209 $10,148,562 $10,065,373 $9,983,460
Table 16. Monthly Fuel Use (MMBtu)– CHP plant vs. TES tank size
Monthly Fuel Use in MMBtu NO - TES 2.5 Million Gallon TES 4.5 Million Gallon TES 6.5 Million Gallon TES 8.5 Million Gallon TES 10.5 Million Gallon TES 12.5 Million Gallon TES January 91,189 90,690 90,629 90,689 90,923 91,130 91,288 February 83,022 82,659 82,652 82,714 82,736 82,808 82,859 March 88,882 88,839 88,852 89,028 89,210 89,432 89,696 April 82,972 83,216 83,211 83,358 83,344 83,383 83,406 May 91,233 91,798 92,066 92,482 92,751 92,714 92,728 June 91,686 92,947 93,547 94,404 95,095 95,144 95,352 July 95,990 97,703 98,497 99,054 100,264 100,672 100,709 August 98,002 99,551 100,457 101,294 102,061 102,857 102,867 September 87,800 88,454 89,044 89,531 89,732 89,799 89,951 October 87,075 87,532 87,683 87,768 87,931 87,979 88,028 November 79,325 79,401 79,482 79,684 79,891 80,177 80,455 December 88,747 88,205 88,135 88,156 88,357 88,591 88,822 Totals 1,065,924 1,070,994 1,074,255 1,078,163 1,082,295 1,084,685 1,086,162
Texas State Capitol Complex
Texas Facilities Commission
CHP Feasibility Study
January 20, 2011
Page
24
of
27
Table 17. Monthly CHP fuel costs($) vs TES tank sizeMonthly CHP fuel costs ($) NO - TES 2.5 Million Gallon TES 4.5 Million Gallon TES 6.5 Million Gallon TES 8.5 Million Gallon TES 10.5 Million Gallon TES 12.5 Million Gallon TES January $455,945 $453,448 $453,147 $453,447 $454,613 $455,649 $456,440 February $415,112 $413,297 $413,258 $413,571 $413,682 $414,042 $414,293 March $444,409 $444,195 $444,259 $445,142 $446,052 $447,158 $448,478 April $414,860 $416,079 $416,056 $416,789 $416,718 $416,917 $417,030 May $456,167 $458,992 $460,328 $462,410 $463,756 $463,569 $463,641 June $458,428 $464,737 $467,736 $472,021 $475,476 $475,720 $476,761 July $479,948 $488,513 $492,487 $495,269 $501,318 $503,358 $503,547 August $490,010 $497,753 $502,287 $506,469 $510,305 $514,286 $514,335 September $439,001 $442,268 $445,219 $447,654 $448,661 $448,995 $449,754 October $435,377 $437,658 $438,415 $438,841 $439,657 $439,893 $440,142 November $396,627 $397,006 $397,409 $398,422 $399,455 $400,887 $402,275 December $443,735 $441,026 $440,673 $440,782 $441,783 $442,953 $444,111 Totals $5,329,619 $5,354,972 $5,371,274 $5,390,817 $5,411,475 $5,423,426 $5,430,808
Table 18. Monthly Savings ($) – CHP plant vs TES tank size
Monthly Savings ($) NO - TES 2.5 Million Gallon TES 4.5 Million Gallon TES 6.5 Million Gallon TES 8.5 Million Gallon TES 10.5 Million Gallon TES 12.5 Million Gallon TES January $367,243 $360,602 $353,968 $347,409 $340,283 $333,483 $327,016 February $370,832 $364,319 $358,182 $351,495 $344,626 $337,266 $329,981 March $400,647 $392,034 $385,021 $377,559 $370,383 $363,353 $356,391 April $415,912 $405,265 $397,746 $389,583 $382,140 $374,759 $367,548 May $468,622 $456,065 $446,943 $437,075 $427,943 $420,521 $412,856 June $474,004 $458,243 $447,682 $435,834 $424,817 $417,188 $408,794 July $490,340 $471,762 $459,778 $448,986 $434,928 $424,878 $416,678 August $493,979 $476,503 $464,183 $452,215 $440,593 $428,826 $421,005 September $461,331 $448,611 $438,099 $428,102 $419,678 $411,968 $403,831 October $454,708 $442,414 $433,647 $425,318 $416,648 $408,768 $401,334 November $421,197 $411,776 $404,559 $397,061 $389,987 $382,730 $375,848 December $369,998 $363,875 $357,942 $351,754 $345,059 $338,208 $331,371 Totals $5,188,811 $5,051,469 $4,947,750 $4,842,392 $4,737,086 $4,641,948 $4,552,653
Texas State Capitol Complex
Texas Facilities Commission
CHP Feasibility Study
January 20, 2011
Page
25
of
27
Phasing
While performing the analyses, it was noticed that for small sized tanks, the savings of the TES
was a small fraction in comparison to the savings achievable by the CHP plant. For tanks, sized
greater than 6.5 million gallons, the associated savings was greater than 10%. These “savings”
have been accounted in the form of reduced baseine-operating costs while analyzing the
economics of the CHP system. (Refer Table 15). The GC RAC believes that claiming the
fractional savings over a period of 0, 5 or 10 years (i.e. separate IRR calculations) has limited
potential to have any significant impact on the presented results, given the current set of
assumptions. The decision to install the CHP system simultaneously or within a few years has a
minimal/negligible detrimental impact on the earlier investement(TES).
Special Comment
As is observed in the report, the higher capacity TES tanks have much higher paybacks/IRR than
lower capacity tanks. Also, turbine inlet cooling can be used to maintain the nominal output of
the gas turbines, as well as maximize the power output of the CHP plant. Potential exists to
obtain better financial performance by implementing both large TES tanks and turbine inlet
cooling. Such a strategy may downsize the initial investment in prime-movers, thereby making
project economics, more favorable than the current results. Additionally, smaller sized CHP
plants, while not providing energy independence from the grid, have lower capital costs, with
potential simple paybacks in the 5-7 year range. These analyses are beyond the scope of the
current report.
Environmental Analysis
The CHP plant helps in reductions of major greenhouse gases. The Environmental Protection
Agency’s Emissions Calculator was used to analyze the reductions of NO
x, SO
xand CO
2.Table
19 quantifies these reductions.
Table 19. Environmental Benefits : CHP System Annual Emissions Analysis
CHP System Displaced Electricity Production Displaced Thermal Production Emissions/Fuel Reduction Percent Reduction NOx (tons/year) 4.04 77.48 2.80 76.24 95% SO2 (tons/year) 0.30 236.71 0.02 236.42 100% CO2 (tons/year) 59,337 106,571 3,263 50,496 46%
Carbon (metric tons/year) 14,672 26,351 807 12,486 46%
Fuel Consumption (MMBtu/year) 1,016,919 1,299,312 55,914 338,308 25%
Acres of Forest Equivalent 10,405
Texas State Capitol Complex
Texas Facilities Commission
CHP Feasibility Study
January 20, 2011
Page
26
of
27
Figure 7 compares the emissions between conventional grid/boiler utility model and combined
heat and power.
Figure 7. Emissions Comparison between Conventional Approach and CHP System
Total Emissions for Conventional Production Total Emissions for CHP System
80.28 tons of NOx 4.04 tons of NOx
236.72 tons of SO2 .3 tons of SO2
109,833 tons of CO2 59,337 tons of CO2
131,100 MWh
1,299,312 MMBtu Electricity to Facility 1,016,919 MMBtu
Fuel consumption Fuel Consumption 131,100 MWh
Central Station No Cooling CHP Electricity Powerplant System to Facility
8,368 MWh Transmission Losses
77.48 tons of NOx 4.04 tons of NOx Thermal from CHP 236.71 tons of SO2 .3 tons of SO2
106,571 tons of CO2 59,337 tons of CO2
44,731 MMBtu
55,914 MMBtu Thermal to
Fuel consumption Facility
On-Site Thermal 44,731 MMBtu
Production Thermal to Facility Absorption
Chiller No Cooling
2.8 tons of NOx .02 tons of SO2 3,263 tons of CO2
Texas State Capitol Complex
Texas Facilities Commission
CHP Feasibility Study
January 20, 2011
Page
27
of
27
Appendix A.
Useful Links & More Information
U.S. DOE Gulf Coast Clean Energy Application Center
http://www.gulfcoastcleanenergy.org/
U.S. DOE Industrial Technologies Program
http://www1.eere.energy.gov/industry/distributedenergy/
U.S. EPA CHP Partnership
http://www.epa.gov/chp/
Texas CHP Initiative
http://www.texaschpi.org/
U.S. Clean Heat and Power Association
http://www.uschpa.org/
Appendix B.
Phase 1 TES Analyses : Load Profiles & IRR calculations
Documents Attached
Appendix C.
Phase 2: CHP Analyses : Hourly Load Profiles and IRR
Calculations
Documents Attached
Appendix D.
Budgetary Quotes
Appendix B.
Phase 1 TES : Load Profiles & IRR calculations
Table 1 & Table 2 show the monthly peak demand due to the chiller load and the corresponding demand charges for the various different tank
sizes. Figure 1 - Figure 12 show the hourly load profiles and the IRR calculations for each tank size in a sequential manner ranging from 2.5
million gallons to 12.5 million gallons.
Table 1. Billed Peak Demand in kW due to chiller vs TES tank sizes Peak Demand due to the Chiller (kW) NO - TES 2.5 Million Gallon TES 4.5 Million Gallon TES 6.5 Million Gallon TES 8.5 Million Gallon TES 10.5 Million Gallon TES 12.5 Million Gallon TES January 4,147 3,371 2,750 2,024 459 0 0 February 5,165 4,388 3,589 2,024 459 0 0 March 5,806 5,030 3,589 2,024 459 0 0 April 6,145 5,154 3,589 2,024 459 0 0 May 7,901 5,727 3,988 2,249 510 0 0 June 7,250 5,076 3,336 1,597 0 0 0 July 7,539 5,365 3,626 1,887 148 0 0 August 7,517 5,343 3,604 1,865 126 0 0 September 7,250 5,076 3,337 1,598 0 0 0 October 7,086 4,913 3,173 1,434 0 0 0 November 6,288 5,154 3,589 2,024 459 0 0 December 4,422 3,646 3,025 2,024 459 0 0
Table 2. Billed Peak Demand charges due to chiller vs TES tank sizes Demand Charges due to the Chiller ($) NO - TES 2.5 Million Gallon TES 4.5 Million Gallon TES 6.5 Million Gallon TES 8.5 Million Gallon TES 10.5 Million Gallon TES 12.5 Million Gallon TES January $45,369 $36,875 $30,080 $22,143 $5,019 $0 $0 February $56,500 $48,006 $39,266 $22,143 $5,019 $0 $0 March $63,521 $55,027 $39,266 $22,143 $5,019 $0 $0 April $67,227 $56,390 $39,266 $22,143 $5,019 $0 $0 May $91,969 $66,664 $46,421 $26,177 $5,934 $0 $0 June $84,384 $59,080 $38,837 $18,593 $0 $0 $0 July $87,754 $62,449 $42,206 $21,962 $1,719 $0 $0 August $87,502 $62,198 $41,955 $21,711 $1,468 $0 $0 September $84,390 $59,085 $38,842 $18,598 $0 $0 $0 October $82,486 $57,182 $36,938 $16,695 $0 $0 $0 November $68,788 $56,390 $39,266 $22,143 $5,019 $0 $0 December $48,377 $39,883 $33,088 $22,143 $5,019 $0 $0
Figure 1. Hourly TES and Chiller Load Profile : 2.5 million gallons 0 2,000 4,000 6,000 8,000 10,000 12,000 14,000 1 1 2 3 3 4 5 5 6 7 7 8 9 9 10 11 11 12
Lo
a
d
(
to
n
s)
Month
TES Discharge vis-a-vis Chiller Load - Peak Period
Chiller Load (tons) TES discharge (tons)Figure 2.
Internal Rate of Return Calculations : 2.5 million gallon TESInterest or Bond Rate 5.0% Project: Capitol Complex
First Cost of Plant (1000$) 2,899 Scenario: TES
Avoided First Costs (1000$) 1,768 Tank Size 2.5 million gallons
Incentives (1000$) 109 After Tax IRR = 23.40%
Projected Change in Electric Charges 3% Financing and Cash Flow Period 20 Years
Year 0 1 2 3 4 5 6 7 8 9 10 11 12 13 14 15 16 17 18 19 20
Net Installed Cost of Plant (1000$) $1,022
Utility Projections
Electric Costs w/o TES (Chiller only) $1,968 $2,027 $2,088 $2,151 $2,215 $2,282 $2,350 $2,420 $2,493 $2,568 $2,645 $2,724 $2,806 $2,890 $2,977 $3,066 $3,158 $3,253 $3,350 $3,451 $3,555 Electric Cost with TES (Chiller Only) $1,760 $1,813 $1,867 $1,923 $1,981 $2,040 $2,102 $2,165 $2,230 $2,297 $2,365 $2,436 $2,509 $2,585 $2,662 $2,742 $2,824 $2,909 $2,996 $3,086 $3,179 Gross Revenues for TES Investment
Net Average Year Annual Savings $214 $221 $227 $234 $241 $248 $256 $263 $271 $279 $288 $297 $305 $315 $324 $334 $344 $354 $365 $376
In/Outflows ($1,000) -$1,022 $214 $221 $227 $234 $241 $248 $256 $263 $271 $279 $288 $297 $305 $315 $324 $334 $344 $354 $365 $376 Financing Cash Flow
Cost of Financing - Uniform Payments 1000$ -$82 -$82 -$82 -$82 -$82 -$82 -$82 -$82 -$82 -$82 -$82 -$82 -$82 -$82 -$82 -$82 -$82 -$82 -$82 -$82 Available Cash After All Loan Payments 1000$ $132 $139 $145 $152 $159 $166 $174 $181 $189 $197 $206 $215 $223 $233 $242 $252 $262 $272 $283 $294 Cumul. Net Income After Loan Payments $132 $271 $416 $568 $727 $894 $1,067 $1,249 $1,438 $1,636 $1,842 $2,056 $2,279 $2,512 $2,754 $3,006 $3,267 $3,540 $3,822 $4,116
Principle Repayment Component $1,000 -$31 -$32 -$34 -$36 -$38 -$39 -$41 -$43 -$46 -$48 -$50 -$53 -$56 -$58 -$61 -$64 -$67 -$71 -$74 -$78 Principal Balance $1,000 $991 $959 $924 $889 $851 $812 $770 $727 $681 $633 $583 $530 $474 $416 $355 $291 $223 $152 $78 $0
Figure 3. Hourly TES and Chiller Load Profile : 4.5 million gallons 0 2,000 4,000 6,000 8,000 10,000 12,000 14,000 1 1 2 3 3 4 5 5 6 7 7 8 9 9 10 11 11 12
Lo
a
d
(
to
n
s)
Month
TES Discharge vis-a-vis Chiller Load - Peak Period
Chiller Load (tons) TES discharge (tons)Figure 4. Internal Rate of Return Calculations : 4.5 million gallon TES
Interest or Bond Rate 5.0% Project: Capitol Complex
First Cost of Plant (1000$) 4,957 Scenario: TES
Avoided First Costs (1000$) 1,768 Tank Size 4.5 million gallons
Incentives (1000$) 196 After Tax IRR = 15.28% Projected Change in Electric Charges 3%
Financing and Cash Flow Period 20 Years
Year 0 1 2 3 4 5 6 7 8 9 10 11 12 13 14 15 16 17 18 19 20
Net Installed Cost of Plant (1000$) $2,993
Utility Projections
Electric Costs w/o TES (Chiller only) $1,968 $2,027 $2,088 $2,151 $2,215 $2,282 $2,350 $2,420 $2,493 $2,568 $2,645 $2,724 $2,806 $2,890 $2,977 $3,066 $3,158 $3,253 $3,350 $3,451 $3,555 Electric Cost with TES (Chiller Only) $1,569 $1,616 $1,665 $1,715 $1,766 $1,819 $1,874 $1,930 $1,988 $2,048 $2,109 $2,172 $2,238 $2,305 $2,374 $2,445 $2,518 $2,594 $2,672 $2,752 $2,835 Gross Revenues for TES Investment
Net Average Year Annual Savings $411 $423 $436 $449 $462 $476 $490 $505 $520 $536 $552 $568 $585 $603 $621 $640 $659 $679 $699 $720
In/Outflows ($1,000) -$2,993 $411 $423 $436 $449 $462 $476 $490 $505 $520 $536 $552 $568 $585 $603 $621 $640 $659 $679 $699 $720 Financing Cash Flow
Cost of Financing - Uniform Payments 1000$ -$240 -$240 -$240 -$240 -$240 -$240 -$240 -$240 -$240 -$240 -$240 -$240 -$240 -$240 -$240 -$240 -$240 -$240 -$240 -$240 Available Cash After All Loan Payments 1000$ $170 $183 $195 $209 $222 $236 $250 $265 $280 $296 $312 $328 $345 $363 $381 $400 $419 $439 $459 $480 Cumul. Net Income After Loan Payments $170 $353 $549 $757 $979 $1,215 $1,465 $1,730 $2,010 $2,306 $2,617 $2,945 $3,291 $3,654 $4,034 $4,434 $4,853 $5,291 $5,750 $6,230
Principle Repayment Component $1,000 -$91 -$95 -$100 -$105 -$110 -$116 -$121 -$127 -$134 -$140 -$147 -$155 -$163 -$171 -$179 -$188 -$198 -$207 -$218 -$229 Principal Balance $1,000 $2,902 $2,807 $2,708 $2,603 $2,493 $2,377 $2,256 $2,129 $1,995 $1,854 $1,707 $1,552 $1,390 $1,219 $1,040 $852 $654 $447 $229 $0
Figure 5. Hourly TES and Chiller Load Profile : 6.5 million gallons 0 2,000 4,000 6,000 8,000 10,000 12,000 14,000 1 1 2 3 3 4 5 5 6 7 7 8 9 9 10 11 11 12