48
Impact of E-Service Quality on Customer Satisfaction and Loyalty
Empirical Study in India Online Business
Vijayanand Sundaram
1, D. Ramkumar
2, Poorna Shankar
31
Marketing Department, Government Sector of India
2
Government Arts College, Paramakudi
3
Indira Colleges of Engineering & Management, Pune
vijaysaurav75@gmail.com
Abstract
Due to Globalization and advancement in technology, Electronic commerce business (e-Com) has witnessed an extensive growth together with enthusiastic competition. The intention of this study is to test the conceptual framework of customer perception on service quality online business and its impact on satisfaction and loyalty through e-commerce business and a sample of 539 respondents were selected through simple random sampling method in Tamilnadu State of India. The result revealed that there is a significant association found between the demographic variables like Marital Status, Gender and Awareness about email/internet operation of the customers and the e-service quality, Customer Satisfaction and Loyalty except with Educational qualification and Status of the Residing area. The factors Responsiveness and Trust were highlighted as significant predictors for customer satisfaction and loyalty except Customization. Regarding the association between the customer satisfaction and loyalty, it is revealed that all the variables under satisfaction were significantly and positively associated with loyalty.
Keywords: e-commerce, Retailers, Customer satisfaction, Customer Loyalty
JEL : G21; G28
DOI : 10.24002/kinerja.v21i1.1034
49
1. INTRODUCTION
Retail sector is one among other organisation playing an important role in the development of economic status of the country. Earlier, the market trend was on Business to Business (B2B) approach in which the producer sold the manufactured goods to the wholesaler and in turn marketed to Retailer with some profit. Retailer‟s consecutively sold the goods to the customer with the price including all the expenditure like show room cost, labour cost and other hidden taxes. This resulted with the increase in the price of the particular product in the market place against the actual production cost. Even in the oligopoly market also, the same trend witnesses rather there might be some reduction in the actual price due to extensive competition among the retailers.
Now Internet becoming the base for all the marketing activities that created a revolution in the retail market and reversed the earlier market scenario. Even prior to the development of information technology, the B2B market slightly rehabilitated to B2C market that too in some sector especially in home appliances through direct marketing where in the product would be supplied at the doorstep of the customers. But the process took more time starting from canvassing to delivery. It was after the progression of WWW site and the development of information technology particularly in the communication sector, the trend has rapidly changed (Lumpkin and Hawes, 1985 in Ling et.al 2010): Most of the business organization are attempting to gain competitive advantage through e-commerce business with the customers (Lee and Lin, 2005):(Head, 2001) in (Chinomona et.al 2014). Owing to this facility, consumers enjoying more benefits with low costs as substantiated by Assocham-PwC study” of 2015 stated that “the average annual spending of Indians is expected to raise to 67% and currently on an average of online shoppers is spending Rs.6000 per year and the purchasing rate will be raised to 65 million from 40 million. In addition, the overall value of e-commerce industry would be increased to 6, 36,281 crones within 5 years.
Another study (Goyal, 2014) pointed out that based on CRISIL report, online shopping amounted to $2.3 billion of the $421 billion retail market with tremendous growth rate in 2013 and expected to be $8.3 billion by the end of 2016. RNCOS, a research and consultancy firm also informed that the online retail market is projected to grow at a compound annual rate of 40-45 % during 2014-18.
The above statement clearly indicated that the online business is in positive trend and this growth is due to the facilities as pointed out by (Yang et.al, 2004) online shopping environment provides infinite selection, information screening, reliability and product comparison which enable the customers saving their time consumption and quick decision making. It also makes a convenience situation for doing business to the consumers in such a way that reducing the role of physical geography for the consumers. One of the reason for this drastic success is the support given by the retailer too through i) aggressive merchandising ii) discounting through flash sales and iii) loyalty and reward programmes.
50
Customization is the capability of an e-retailer to fit products, services, and the transactional environment by targeting the individual customers (Srinivasan et.al 2002) and customization through online business paved a way for extracting assessment of electronic experience and it will yield an idea to improve the e-service quality (Santos, 2003). Yes, this is the golden mantra for customer satisfaction which will be the predecessor for gaining customer loyalty: because planning features of the product in accordance with the need of the customers will alone enhance the enjoyment of the customers which in turn increasing the pulse of repurchasing the products. It is inevitable for every e-retailer to maintain the quality disbursed through online business, in view of the fact that the service quality plays a vital role for customer satisfaction which in turn developing the loyalty. If any down trend noticed in the above may lead to negative trend in the business and their future endurance would be in question? Hence the foremost practice of “Knowing your customer (KYC)” approach should be followed to create a personal acquaintance between the organization and the customer.
How this customization could be happened? Only through responsiveness of the organization and based on this alone, trust among the customers towards the organization will generate. Since number of internet users are growing rapidly and online technologies are improving and more companies are offering their finished products through internet, there is a question coming up: Whether the organizations giving importance customization based on customer preferences? : Whether they are all satisfying the customer needs? Whether satisfaction leads to loyalty? To provide a solution for all of these questions, this study attempted to know the impact of service quality on customer satisfaction and Loyalty in Online business in Tamilnadu, India.
Customers‟ emotions and their opinion in an online purchase are varied from traditional purchase and more uncertainty is caused due to absence of physical interaction in any business especially in online business. Moreover, their perception may be varying with every dimensions of service quality for any products. Early research works have stated that there are some difficulty experienced by the e-com retailers (Hoffmen & Novek, 2000 in Eid, 2011) and most of the customers were not having clear expectations in e-com business and had second-rate of idea towards e-com business (Yang et.al., 2004). Besides incredible growth with various benefits through online marketing, organizations are still facing major challenge for fulfilling the need of the customers to achieve their satisfaction level. One among the foremost reason is not providing the exact information of the products and the offers and non delivering the products as advertised and notified in the website concerned which act as a core platform between the organization and the customers and secondly, organization not trying to customize the customers by giving proper response to their queries which may result in service failures (Wu, 2006 in Canarslan, 2013).
Many researchers have considered various factors that had influenced the customer satisfaction in online business. For example, factors like Website Design,
51 Reliability, Customer Service and Trust (Alam et.al., 2008):website design and e-information (Wolfinbarger and Gilly, 2003) in (Zang and Thang.2006): Efficiency, System Availability, Fulfilment, Privacy, Responsiveness, Compensation and Contact (Parasuraman, et.al 2005) Easy of use, Responsiveness, Information Quality, Environmental Quality, Outcome quality, Utilitarian value, Hedonic value (Chen et.al, 2013) and many studies suggest that e-service quality is an important dimension and most valuable determinant for e-retailers business (Lee and Lin,2005) (Eid, 2011) (Li.et al , 2009) in (Turk et.al, 2012) (Shaikh and Khan, 2011) (Anderson and Srinivasan, 2003) (Kassim and Ismail,(2009). (Henig and Klee, 1997) in Pratminingsih et al., 2013).
Based on the suggestions and the fact as validated in the above studies, author(s) have selected the three factors recognized as suitable for this study in view to cover the topic (service Quality) in depth, for example Responsiveness, Trust and Customization along with Customer satisfaction and Customer Loyalty by put forth the primary questions as:
1) How the responsiveness of the organization affects the customer perception?
2) How the trust of the company affects the perception level of the customers? 3) How the dimensions of the service quality of online business impact the customer satisfaction and in turn affect the loyalty towards the organization? 4) Whether the demographic variables play a significant association with the service quality factors and Customer satisfaction and Loyalty?
Most of the earlier studies have considered the impact of customer satisfaction on Trust among the customers. But this study as a contra, attempted to find the impact of Trust of the customers about the organization and in turn its impact on customer satisfaction and loyalty. This is the major gap identified.
2. LITERATURE REVIEW
Customer Satisfaction is a direct antecedent of Customer loyalty in B2C e – commerce business and the customers are more impressed with the customer interface quality and the provided information on the product and valuable customer service along with the privacy assurance (Eid, 2011). Customers will be attracted to the business only when providing good quality and time delivery along with low prices and promotion offers (Reibstein, 2002).
Rodgers et.al (2005) through his research revealed that system quality and service quality are the most important determining factors for customer satisfaction and loyalty. Pratminingsih et al (2013) pointed out that customer satisfaction is one of the main antecedents for e – loyalty and increase in satisfaction enhance the
52
commitment and trust of customers and hence managers should take care on satisfaction and trust so that there will not be deflection in customer
Lin and Sun, (2009) revealed in their study that technology acceptance factors positively influenced the e-satisfaction and e-loyalty of the customers which formed a way for repurchasing behaviour. Also the author pointed out that when the customers Internet familiarity level uplifted, the website service quality and e-satisfaction increases accordingly. More over, any e-shopping website having specific hold up cost definitely dropping the percentage of customer satisfaction level.
In a study of Srinivasan et.al, (2002) which underlined the fact that e-retailers should establish warning systems by measuring customer perceptions so that management can take appropriate remedial action when any of the dimensions considered under service quality as falling below the acceptable level. They should also develop a scale to identify the competition ration along with their strength and weakness for their continuous survival.
Online companies should have a focus of improving their marketing and Sales strategies to pull more customers in online shopping as this is the only channel to fulfil the dimensions of customer satisfaction (Ali and Sankaran, 2010).
Nasser et.al.,(2013) have done a study on e-service quality effect on consumers trust and revealed that the relationship between e-service quality and consumer trust is found statistically significant as the former strongly and positively affected the customer trust in internet shopping. Hussain (2014) in his study by considering six dimensions for measuring the e-service in banking sector explained that the dimension “Security was rated as the most significant by customers perception view followed by Reliability and E-Service Quality was directly associated with Customer perceived Service Quality”.
Books, mobiles, bags and wallets are the most popular categories that were purchased on online shopping. But at the same time lack of touch and feel through online shopping is the main reason for deterrent in purchasing through online (Goyal 2014). Matic and Vojvodic (2014) after conducting a study based on customer perception against insecurity on online shopping and pointed out that majority of the respondents expressed their insecure emoitions during online shopping. It is mainly due to the insecurity of Internet usage. It also influencing the future purchase decision of the customers
Quality orientation, Purchase orientation, brand orientation and online trust has a positive relation to the Online shopping out of which prior online purchase is the foremost antecedent which affect the online shopping and for increasing the customer impulse on purchase, retailers should update the salient features along with the offers in addition with their loyalty programmes. It is also pointed out that e-retailers should provide honest and trustworthy information in the website (Ling et. al, 2010)
53 Chang & Wang, (2008) undergone a study in connection with current understanding of online shopping consumer behaviour in two ways for example impact of antecedents customer perceived value on customer satisfaction and loyalty and the result revealed that e-service quality like website design, reliability, security and customer service would affecting the online shopper indirectly only through perceived value and satisfaction.
Sheikh and Basti (2015) have given an idea to the retailers that e-Commerce websites should invest more on advertisement on the social media and few people alone can gain knowledge about e-commerce through channels like radio, TV and Magazine. Author suggested the companies should explore the activities in view to cover more number of customers. It is also pointed out that lack of confidence about the after sales service while product purchased through online played a vital role for the people to buy online product. It is the duty of the organization to get away the customers from that fear and innovative techniques should be implemented to attract the consumer.
Turk et.al (2012) in their study about how service quality is perceived in online luxury good retaining and pointed out that factors like efficiency, fulfilment, design, information, contact and responsiveness had a positive effect on e-service quality and they clearly stated that changes in the factors does not cause changes in the service quality but changes in service quality causes changes in the factors taken up for consideration.
Canarslan (2013) revealed in his study that the problem encountered in online shopping is generally originated from service failures. Service failures in online shopping has a great impact among the consumers from traditional shopping because, the response could not able to fix in the online shopping
Shankar et.al (2003 in Sheikh and Basti 2015), pointed the difference in the level of customer satisfaction between online and offline purchase and underlined that there is no difference between the customer satisfaction levels between the online and offline buying method but the customer loyalty was found to be greater in online purchase against the offline and also the customer loyalty is found to be positive effect with the satisfaction.
Tang and Huang (2015) had a study on the relationships among Trust, E-Satisfaction, E-Loyalty, and Customer Online Behaviours in Taiwan and revealed that the factor Perceived Ease of Use (PEOU) had performed less important role when customers use website to purchase and Satisfaction whereas Perceived Usefulness (PU) overlooked the online purchase. In addition, Trust and Perceived Usefulness are found to be the paramount marker of online purchase attitudes and e-Satisfaction. It is also suggested by the authors that the managers could put efforts into making the online purchase more appealing in order to improve the customer‟s evaluation of the purchasing process. Raffaele & Orlando (2014) in their research on e-commerce website of Italy pointed out that e-customer Trust strongly relies on website brand and convenient and trusted online environment leads to
54
more satisfaction and strongly increases the customer loyalty and inclined to have a repurchase on the same website.
2.1. Hypothesis And Model
It is aware that the factor that affecting customer satisfaction and loyalty is only the service quality. Hence the following hypotheses were resulted based on the argument and review of earlier literature:
H1: E-Service Quality has a positive influence on Customer satisfaction
H2: E-Service Quality has a positive influence on Customer Loyalty
H3: Demographic variables has a positive influence on Customer Satisfaction
H4: Demographic Variables has a positive influence on Factors on e-Service
Quality.
H5: Service quality factors are acting as antecedents for Customer satisfaction
and Loyalty.
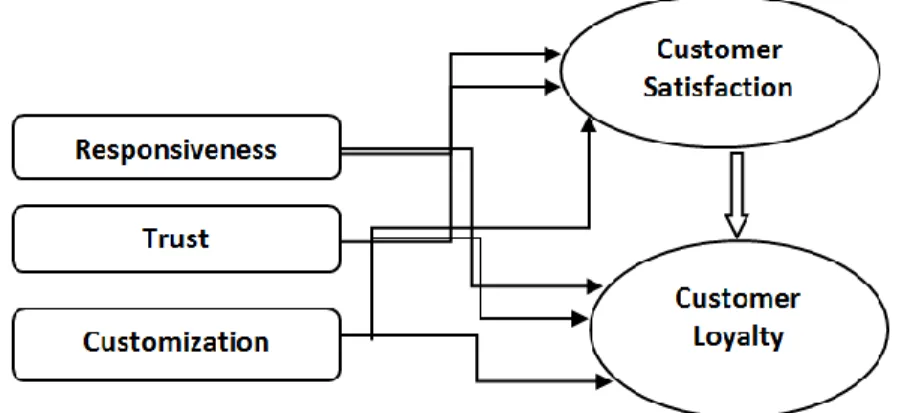
As the study was based on performance of e-service quality, the author selected three types of areas for instance factors influencing the e-service quality, Impact of the performance of e-service quality on Customer satisfaction and Loyalty. Hence the related literatures were reviewed and conceptual model was framed based on the outline for customer perception on service quality in Online shopping with the factors like Responsiveness, Trust, Customization along with Customer Satisfaction and Customer loyalty.
55
3. METHODOLOGY
The Research consists of three dimensions of Service Quality factors for instance Responsiveness, Trust and Customization and five variables in Customer satisfaction and Customer loyalty. Questionnaire for this survey was framed as per the requirement for the title of the study and it has two sections. The first section related to demographic criteria like Age, Gender, Marital Status, Educational Qualification, Status of the Residing area, and Awareness about Internet operation. The second part consists of 26 statements, regarding various aspects of service quality like Responsiveness, Trust and Customization along with Customer Satisfaction and Customer Loyalty. Five point Likert scale ranging from 1-Strongly Disagree to 5 –Strongly agree was used to assess the opinion of the customers.
Pre – test was conducted to assess the validity and reliability of the scale selected by forwarded the instrument to 50 online business customers. Based on the opinion received, the questionnaire was again discussed with the experts and academics and it was fine-tuned. Then, the corrected and reframed questionnaire was sent to the customers selected through simple random sampling (a method to select a smaller sample size from large population which has an equal chance among the population). Initially, the defined number of population was received through various organizations/institutions at request and from the list gathered; respondents were selected through the above sampling method. A total of 600 questionnaires were sent through email informing them about the purpose of the study and requested to send back it duly filled in. For the purpose of well understanding, local vernacular language was also used in the instrument. Out of 600 questionnaires, 61 were returned with incomplete and not properly filled in to the tune of 10.16%. This may be due to customer‟s reluctance in filling the questionnaire or due to lack of time. The statistical tool used for analyzing the results based on the rating through questionnaire was SPSS. The area of sampling was Tamilnadu State of India covering 32 districts and the period of study is during July 2016 to November 2016.
4. RESULT AND DISCUSSION
4.1. Demographic profile of the respondents in Online Industry
As demographic profile plays a significant role in any service sector, this study given importance to the demographic profile of the respondents like Age, Gender, Marital Status, Educational Qualification, Status of the Residing area and the awareness of internet operation by the respondents and the result revealed through percentage analysis by SPSS 18.0 is given in Table: 1.
56
Table 1. Demographic Profile of the online business Customers
Sl.No. Demographic Factors Sample Size
N=539 Percentage 01 . Age 18 years – 25 years 395 73.28% 26 – 40 years 107 19.85% > 40 years 37 6.86% 02 . Gender Male 264 49% Female 275 51% 03 . Gender Marital Status Married 117 21.70% Unmarried 422 78.29% 04 . Educational Qualification Up to 10th Standard 8 1.5% Twelfth standard 128 23.7% Diploma 8 1.5% Degree 179 33.2% Post Graduate 203 37.7% Professional 13 2.4 05
. Status of the Residing Area
Urban 186 34.5%
Rural 214 39.7%
Semi Urban 139 25.8%
06
. Awareness about the internet operation
Yes 508 94.2%
No 31 5.8%
From the above table, it is revealed that out of the total sample size of 539 (Five Hundred and Thirty Nine), 49% were found to be Male and 51% were found to be Female. One Interesting fact here to be noticed is 78.29% of the total population was found to be unmarried which showed that only the adolescent peoples were very much interested in online shopping. This may be due to well-versed handling of latest technology and knowing the instant of updating of technology in hand devices. Regarding Educational Qualification, Maximum respondents were found to be Postgraduate to the tune of 37.7% and all the respondents were having a
57 minimum educational qualification. Another important fact to be noticed here is maximum number of respondents residing area was found to be Rural (39.7%). This clearly justified that area of residence is not at all a matter for acquiring technical knowledge especially Internet operations. The reason for this awareness in technology is due to the fact that everybody now having mobile phone with android facility so that there is no necessity for searching the alternate system. Every thing could be done through their mobile phone itself. Moreover, online shopping applications could be downloaded everywhere for doing the business. This is one of the milestones in e-retail business. This fact has been witnessed through this study for example out of 539 respondents, 94.2% of them said „YES” regarding the question: Have you aware in email/Internet Operation?
4.2. Factor Analysis
In the dimensions identified for Service Quality through Online business, in order to measure the strength of relationship among the variables, Kaiser Meyer Olkin (KMO) and Bartlett‟s Test were conducted and the result was tabulated in Table 2.
Table 2. KMO and Bartlett's Test of Sphericity
KMO and Bartlett's Test
Kaiser-Meyer-Olkin Measure of Sampling Adequacy. 0.904 Bartlett's Test of Sphericity Approx. Chi-Square 2.664E3
df 120
Sig. .000
Reliability Statistics
Cronbach‟s Alpha Number of Variables
0.920 26
The basic purpose for doing the Kaiser Meyer Olkin (KMO) and Bartlett‟s Test is to measure the multivariate normality of our data considered and also to check whether correlation matrix is an identity matrix. As the value is found to be 0.904 which came under the purview level of acceptance for example 0.7 to 0.9,(P<0.001), it is revealed that the correlation matrix is not an identity one and clearly confirmed that considered data do not produce identical matrix and acceptable for factor analysis Moreover, Cronbach‟s alpha value for all the 26 items was found with the scale reliability of 0.920showed the internal consistency of scale and also indicated the degree to which a set of items measures a single dimensional latent construct and content validity.
58
Factor analysis - a technique describes variability among observed and correlated variable and also to reduce data by identifying representative set of variable to similar in number, by partially or completely replace the original set of variables was performed to categorize the key factors and variables through principal axis factoring with varimax rotation with a view to condense potential multicollinearity among the items and also to improve reliability on the data with Kaiser Normalization which converged in five iterations. Three factors that are having Eigen value more than one (1) were considered for further analysis and interpretation. The extracted service quality factors, number of variables in each factor, Eigen value, Percentage of Variance explained and the individual Cronbach‟s alpha for Reliability for each factor were tabulated hereunder in Table 3.
From the analysis, the most important factor considered in this study is found to be Responsiveness with the Eigen Value 5.616. Next to this is Trust with the Eigen Value 1.606 followed by Customization with the Eigen Value 1.048. 6.3 Opinion about the satisfaction level of the customers in connection with the variables considered for Service Quality in online shopping.
As already pointed out that the opinion of each and every variable of service quality factors along with the variables considered for Customer satisfaction and Loyalty were asked from the respondents through five point Likert scale ranging from 1-Strongly Disagree to 5- Strongly Agree. The result obtained through the survey is given below in Table 4.
59
Table 3. Factor Analysis values for the service quality in online shopping
FACTORS Eigen Value % Variance Cronbach‟s Alpha FACTOR VALUE RESPONSIVENESS
Toll free Connection is provided for my query by the company
5.616 35.098 0.835
0.693 Information is promptly displayed and it
is clear and authenticate 0.680
Website is easily connected and
accessible 0.675
Information provided by me through
email is kept secret by the company 0.661 Information increases my searching
interest 0.643
Information promptly updated 0.638
Received the product safely and time
bounded 0.536
TRUST Taking care about the customers
1.606 10.036 0.726
0.772
Sending product as promised 0.689
Return back when get damaged 0.687
Creates confidence 0.593
Trustworthy and honesty 0.566
CUSTOMIZATION Attending call promptly and having quick
response
1.048 6.552 0.674
0.765
No extra charges levied 0.573
Personal need fulfilled 0.555
Treating customers more valuably 0.543
Extraction Method: Principal Component Analysis. Rotation Method: Varimax with Kaiser Normalization.
a. Rotation converged in 5 iterations.
60
Table 4. Satisfaction level of the customers in connection with service quality in online shopping
Sl.No. Variables Strongly
Agree (5) Agree (4) Neutral (3) Disagree (2) Strongly Disagree (1) Mean
01. Toll free Connection is provided for my query by the company
155(28.8%) 205(38%) 142(26.3%) 29(5.4%) 8(1.5%) 3.872
02. Information is promptly displayed and it is clear and authenticate
197(36.5%) 222(41.2%) 103(19.1%) 14(2.6%) 3(0.6%) 4.106
03. Website is easily connected
and accessible
222(41.2%) 243(45.1%) 57(10,6%) 14(2.6%) 3(0.6%) 4.238
04 Information provided by me
through email is kept secret by the company 215(39.9%) 197(36.5%) 109(29.2%) 13(2.4%) 5(0.9%) 4.121 05. Information increases my searching interest 174(32.3%) 203(37.7%) 133(24.7%) 26(4.8%) 3(0.6%) 3.960 06. Information promptly updated 181(33.6%) 206(38.2%) 120(22.3%) 24(4.5%) 8(1.5%) 3.980
07. Received the product safely
and time bounded
201(37.3%) 213(39.5%) 104(19.3%) 16(3.0%) 5(0.9%) 4.090
08. Taking care about the
customers
143(26.5%) 212(39.3%) 136(25.2%) 39(7.2%) 9(1.7%) 3.820
09. Sending product as
promised
176(32.7%) 234(43.4%) 89(16.5%) 35(6.5%) 5(0.9%) 4.000
10. Return back when get
damaged
176(32.7%) 200(37.1%) 112(20.8%) 40(7.4%) 11(2.0%) 3.910
11. Creates confidence 172(31.9%) 234(43.4%) 111(20.6%) 19(3.5%) 3(0.6%) 4.030
12. Trustworthy and honesty 109(20.2%) 203(37.7%) 149(27.6%) 58(10.8%) 20(3.7%) 3.600
13. Attending call promptly and having quick response
167(31%) 168(31.2%) 108(20.0%) 49(9.1%) 47(8.7%) 3.670
14. No extra charges levied 192(35.6%) 207(38.4%) 107(19.9%) 23(4.3%) 10(1.9%) 4.020
15. Personal need fulfilled 157(29.1%) 169(31.4%) 148(27.5%) 28(5.2%) 37(6.9%) 3.710
16. Treating customers more
valuably
188(34.9%) 224(41.6%) 102(18.9%) 21(3.9%) 4(0.7%) 4.060
17. Considering everything, I am
satisfied with the e-com company
187(34.7%) 231(42.9%) 85(15.8%) 28(5.2%) 8(1.5%) 4.040
18. Satisfied with the personal contact of the staff
165(30.6%) 213(39.5%) 126(23.4%) 28(5.2%) 7(1.3% 3.930
19. Choice of mine to use this company is good
61
Sl.No. Variables Strongly
Agree (5) Agree (4) Neutral (3) Disagree (2) Strongly Disagree (1) Mean 20. My experience is enjoyable 184(34.1%) 236(43.8%) 94(17.4%) 16(3.0%) 9(1.7%) 4.060
21. My e-com company always
meets my expectation
152(28.2%) 220(40.8%) 128(23.7%) 33(6.1%) 6(1.1%) 3.890
23. Recommend this company
to some one who seeks my advice
170(31.5%) 227(42.1%) 114(21.2%) 21(3.9%) 7(1.3%) 3.990
24. Encourage friends and
relatives to do business with this company
166(30.8%) 219(39.5%) 122(22.6%) 32(5.9%) 6(1.1%) 3.930
25. For any e-com business, I
consider this company as my first choice
176(32.7%) 238(44.2%) 93(17.3%) 19(3.5%) 13(2.4%) 4.010
26. I will definitely increase the business in the ensuing years.
172(31.9%) 261(48.4%) 81(15.0%) 18(3.3%) 7(1.3%) 4.060
From the table 4, it is revealed that 48.4% of the respondents have agreed that they will definitely increase the business in the ensuing years: Next to this 45.1% of the respondents agreed that the website is easily connected and accessible. 43.4% of the respondents have agreed that the ordered product was delivered as promised. 44.2% of the customers agreed that for any type of e-com business, they would consider the existing company as a first choice.
But at the same time, it is very shock to see that 149 respondents to the tune of 27.6% did not agree or disagree and found neutral in connection with Honest and Trustworthy of the company. But overall, only 0.6% to 10.8% of the respondents alone expressed their opinion as Disagree and Strongly Disagree to all the variables considered in this study.
4.3. Correlation Analyses
In order to find the association between the factors considered for service quality and the customer satisfaction and loyalty, Inter correlation analysis was carried out and the result obtained is tabulated in Table 5.
62
Table 5. Correlation Matrix of service quality, customer satisfaction and customer loyalty
Responsive ness
Trust Customization Customer
Satisfaction Customer Loyalty Responsiveness 1 .448** .642** .514** .563** Trust 1 .408** .686** .614** Customization 1 .422** .401** Customer Satisfaction 1 .752 ** Customer Loyalty 1
** Significance at 1% level of significance.
From the above table, it is seen that customer satisfaction and customer loyalty is found to be positively associated at one percent (1%) level of significance with the service quality factors. All the three factors for instance Responsiveness, Trust and Customization of Service Quality are positively correlated with customer‟s satisfaction and loyalty.
It is also found that maximum correlation is found between Customer Satisfaction and Loyalty with the value „r‟= 0.752. Next to this it is seen that the factor “TRUST” has a maximum correlation with Customer satisfaction with the value „r‟= 0.686. At the same time, while analyzing the factor having minimum correlation, it is seen that the factor Trust and Customization is found to have a minimum correlation with Customer loyalty, r=0.401.The correlation results indicate that the respondents who are measured on difference dimensions of service quality show that, opinion expressed on dimensions are significantly related to each other. In this study, since the „r‟ value is found to be 0.686 and 0.614 between Trust and Customer satisfaction: Trust and Customer loyalty, it is revealed that the factor “TRUST” representing as a most affecting indicator for customer satisfaction and customer loyalty and in addition, all the factors were found significant and positively correlated at 1% level of significance.
4.4. Association between the Demographic Variables and the Service Quality Factors, Customer Satisfaction and Loyalty
In order to find the association between the demographic variables considered in this study with the factors of service quality, customer satisfaction and Customer loyalty, Paired sample „t‟ Test and One Way ANOVA („F‟ test) were conducted and the result revealed is tabulated below:
63
Table 6. Association between the Demographic Variables and the Service Quality Factors, Customer Satisfaction and Loyalty
Paired Sample “t” Test Value One Way ANOVA „F‟ Value
Gender Marital Status Awareness
about Email/Internet Educational Qualification Status of the Residing Area Age Responsiveness 140.396*** 140.909*** 144.954*** 0.677 1.343 1.239 Trust 123.224*** 122.151*** 128.233*** 0.800 0.900 1.075 Customization 104.625*** 103.314*** 110.080*** 0.566 0.693 1.065 Customer Satisfaction 122.067*** 121.370*** 127.159*** 0.690 0.835 0.922 Customer Loyalty 125.150*** 123.800*** 130.142*** 0.513 0.932 1.189 ***- 1% level of significance
From the above result, it is noticed that there is a significant association found between the service quality factors, customer satisfaction and Loyalty and the demographic variables like Gender, Marital Status and Awareness about Email/Internet operation of the customers as the value is statistically significant at 1% level of significance. At the same, it is noticed that there is no significant association found between the Educational Qualification and Status of Residing area with the factors considered and we concluded that the educational qualification, status of residing area and Age of the customers is not criteria to satisfaction and loyalty level of customers.
4.5. Antecedents of Customer Satisfaction and Loyalty
To evaluate the antecedents of customer satisfaction in Indian Banking Sector, stepwise regression analysis were conducted and the findings are tabulated below:
64
Table 7. Antecedents of Customer Satisfaction and Loyalty in online shopping Dependent Variable Independent Variable Unstandar dized Coefficient Standard Coefficien t (Beta)
„t‟ Value F Value Sig R2 Value Adj R2 Value Customer Satisfaction (Constant) 2.594 3.414 196.97** .001 0.525 0.522 Responsiveness 0.186 0.236 5.843 .000 Trust 0.589 0.563 16.643 .000 Customization 0.047 0.041 1.038 .300 Customer Loyalty (Constant) 3.193 4.107 165.83** .000 0.482 0.479 Responsiveness 0.291 0.376 8.923 . 000 Trust 0.468 0.457 12.923 . 000 Customization 0.030 0.026 -.640 . 523
Regarding the antecedent of Customer satisfaction and loyalty, the F-ratio value were 196.97 and 165.83 and this indicated that the results of this regression model are statistically significant since the „P‟ value is less than significant value (P<0.05) In addition, Beta coefficients were calculated to know the importance of the variables considered in this study. The service quality factors for example Responsiveness and Trust are highlighted as significant predictors of customer satisfaction and loyalty since the „p‟ value is statistically significant (p<0.05) except the factor “Customization” as the p value is not statistically significant (p>0.05).
It is also noted that the coefficient of the determinant (R2) was 0.525 and the adjusted R2 was 0.522 and 0.482 and the adjusted R2 was 0.479 for customer satisfaction and loyalty respectively. This indicated that the unit increase in the independent variables considered in this study explains the change in customer satisfaction to the extent of 52.5% since the R2 values is 0.525and explains 48.2% change in customer loyalty since the R2 value is found to be 0.482 in online shopping business.
4.6. Impact of Customer Satisfaction on Customer Loyalty
In order to analyze the impact of customer satisfaction on Loyalty, individual variable under Customer satisfaction factor was taken up with the dependent factor Customer Loyalty and One Way ANOVA test was carried out to find out the association between the factors. The result revealed is tabulated in Table:
65
Table 8. Association between the e-service quality and Customer satisfaction and Loyalty
Dependent Variable/Factor
Independent Variable One Way ANOVA -
Test
Customer Loyalty
Customer Satisfaction Mean Square „F‟ Value
Considering everything, I am satisfied with the e-com company
561.474 76.805***
Satisfied with the personal contact of the staff
497.184 63.807***
Choice of mine to use this company is good
471.944 59.133***
My experience is enjoyable 477.664 60.173***
My e-com company always meets my expectation
631.000 92.936***
From the above table, it is revealed that there is a significant association between the individual variables under Customer Satisfaction and Loyalty as the „F‟ Value is found statistically significant at 1% level of Significance and hence the customer satisfaction is definitely a very good predictor and antecedent for Loyalty in online shopping business.
5. CONCLUSION
For any type of business, customer satisfaction is very much essential as it is the principal antecedent for loyalty. As everybody aware that today all retail companies have started up the marketing trend through online mode with various strategies by identifying the characteristic of the market in which they provide their service to the customers. The work presented in this study focused on the investigation of service quality in online business and its impact on customer satisfaction and loyalty with reference to Tamilnadu of India.
The reason for conducting this study is still, there are incidents observed that clients are hesitant to buy anew product through online website particularly through unfamiliar website This created a scenario for asking a query: why such disinclination towards the product in online business and whether customer experience through online business yield satisfaction and whether customers are reliable towards the organization. From the analysis of our research data it is revealed that the service quality factors like Responsiveness and Trust positively affected the Customer Satisfaction and Loyalty directly which matched to a great extent with the previous research results pointed out by Alam et.al (2008): Henig and Klee, (1997) in Pratminingsih et al., (2013): Ilias et.al (2009) and Mcmellon (2004): Gomez et.al (2006) and Turk et.al (2012).
66
The result also go with the output of the study of Choi and Park (2015)who highlighted that online service quality in internet duty-free shops positively affects trust and also suggested to improve their online service quality for increasing the trust. In addition, trust was identified a main factor which positively affecting behavioral intention, a base for future purchase intention. (Tang & Huang, 2015) also bring to light the same result as: Trust and Perceived Usefulness are found to be the paramount marker of online purchase attitudes and e-satisfaction.
This prepared the online retailers to have a careful look into the responsiveness and trust factors through customer orientation so that it will improve the repurchasing behavior of the customers. But at the same time, it is seen that the factor “Customization “ under service quality is not highlighted as a significant predictor for customer satisfaction and loyalty as the „p‟ value is not statistically found in disparity with the results reported by Srinivasan et.al (2002) who pointed out that customization was positively related to e-loyalty. In addition, it is seen that among the service quality variables considered in this study, the variable “Website is easily connected and accessible” has attained the maximum mean value (4.26) and the variable “Trustworthy and honesty” has unmarked with lowest mean (3.60) which agreed the point as discussed by (Ling et. al, 2010) who stated that e-retailers should provide honest and trustworthy information in the website. Hence the organization should think over the customer perceived information and the quality should be improved in the relevant areas so as to get the maximum satisfaction among all the customers. Regarding the demographic variable, it is seen that there is a significant association found between the demographic variables like Gender, Marital Status and Awareness about email/Internet operation but no significant association found with Educational qualification, status of residing area and age of the respondents which revealed that the educational qualification and status of the residing area and age is not at all a criteria for customer satisfaction and loyalty.
5.1. Limitation And Future Research
There are several limitations on the research findings. Simple random sampling method was employed in this study, future research may be done with some other sampling method and particularly stratified random sampling may be used by grouping the population based on important criteria so that more appreciate result could be evaluated. In addition, while analyzing the reliability statistics, it is seen that for one factor “Customization” is found to have a reliability value of 0.674. While doing future research, the fact should be reconsidered for achieving more reliability values. More number of antecedent factors for customer satisfaction and loyalty may also to be considered in future studies and research may be done in various geographical areas with various demographic variables.
67
REFERENCES
Adinolf, R., and Orlando, T., 2014. Customer Loyalty: An Empirical Study on Italian E-Commerce Websites. Chinese Business Review, 13 (6) pp.388-398.
Alam, S.S., Bakar, Z., Ismail, H.B., and Ahsan, N. 2008. Young Consumers Online Shopping –An Empirical Study. Journal of Internet Business, 5, pp.81-98. Brigitte, T., Michael, S., and Berresheim, P., 2012. Measuring Service Quality in
Online Luxury Goods Retailing. Journal of Electronic Commerce Research, 13(1) pp. 898-103.
Canarslan, N.O., 2013. A Comparison of Customers Responses to E-Service Quality Statements: Customer Encountered vs. Not Encountered Problems.
International Journal of Business and Social Science, 4(11) pp.312-318. Chang, H.H., and Wang, H.W., 2008. The Relationship among e-service quality,
Value, Satisfaction and Loyalty in Online. European Advances in Consumer Research, 8, pp.10-14.
Chinomona, R., Masinge, G, and Sandada, M. 2014.The influence of E-service quality on Customer Perceived Value, Customer Satisfaction and Loyalty in South Africa. Mediterranean Journal of Social Sciences, .5(9), pp. 331-341. Choi, S.A., and Park, J.W., 2015. Investigating the effect of online service quality
of internet duty-free shops on trust and behavioral intention. Journal of Airline and Airport Management, 5(2), pp.101-115.
Gomez, B.G., Arranz, A.G., and. Cillan, J.G. 2006. The role of loyalty programs in behavioral and affective royalty. Journal of Consumer Marketing, 23(7), pp.387-396.
Goyal, M.M.,2014. On line shopping: A survey on Customer‟s perception.The International Journal of Business and Management. 2(11), pp.73-79.
Grace, T.R., Lin and Sun,C.C., 2009. Factors influencing Satisfaction and Loyalty in Online Shopping: an Integrated Model. Online information Review, 33 (3), pp. 458-475.
Kassim., N.M and Ismail. S., 2009. Investigating the Complex Drivers of Loyalty in E-Commerce Settings. Measuring Business Excellence, 13(1) pp.56-71. Lee, G.G., and Lin H.F. 2005. Customer perceptions of e-service quality in online
shopping. International Journal of Retail & Distribution Management, 33(2), pp 161-176.
Ling., K.C., Chai, L.T., and Pew. T.H., 2010. The Effects of Shopping Orientations, Online Trust and Prior Online Purchase Experience towards Customers‟ Online Purchase Intention. International Business Research, 3(3) pp. 63-76.
68
Matic, M., and Vojvodic, V., 2014. Customer Perceived insecurity of Online Shopping Environment. International Review of Management and Marketing, 4(1), pp 59-65.
Mei-Hui Chen, Kune-Muh Tsai, and Kuan-yin Lee. 2013. E-Service Quality impact on Customer‟s Perceived Value and Loyalty. Chine-USA Business Review, 12(5) pp.473-485.
Mohammed, A., Yusoff, R.Z., Islam, R., and Abdullah, A.N. 2013. E-Service Quality and its effect on Consumer‟s Perception Trust. American Journal of Economics and Business Administration, 5(2) pp.47-55.
Mustafa, I.E, 2011. Determinants of E-Commerce customer satisfaction, Trust, And Loyalty in Saudi Arabia. Journal of Electronic and Consumer Research, 12 (1), pp.78-93.
Parasuramn, A., Zeithaml, V., and Malhotra., A. 2005. E-S-QUAL: a multiple-item scale for assessing electronic service quality. Journal of Retailing, 64(1), pp. 12-40.
Perviaz, Al and Sankaran, S. 2010. Online Shopping” Customer Satisfaction and
Loyalty in Norway. Master Thesis in Business Administration.
Pratminingsih, S.A., Lipuringtyas, C., and Rimenta, T. 2013. Factors influencing Customer Loyalty towards online shopping. International Journal of Trade, Economics and Finance, 4(3), pp.104-110.
Reibstein, D.J. 2002. What attracts customers to online stores, and what keeps them coming back? Journal of the Academy of Marketing Science, 30, pp. 465-473.
Rodgers, W., Negash, S., and Suk, K. 2005. The moderating effect of online experience on the antecedents and consequences of on line satisfaction.
Psychology and Marketing, 22, pp. 313-331.
Saba, M.H. 2014. Measuring Quality of Electronic Service (E-Service) in Banking.
International Journal of Engineering Research and Applications. 4(3), pp. 350-359.
Sahal M.S., and Basti, M. 2015. Customer Satisfaction in Business to Consumer (B2C) E-Commerce. A Comparative Study of Turkey and Pakistan.
Eurasian Journal of Business and Economics, 8 (16), pp.73-100.
Santos, J. 2003. E-Service Quality: a model of Virtual Service Quality Dimensions.
Management Service Quality, 13 (3), pp. 233-246.
Shankar, V., Smith, A. K., and Rangaswamy, A. 2003. Customer satisfaction and loyalty in online and offline environments. International Journal of Research in Marketing, 20(2), pp.153-175.
69 Srinivasan, S.S., Anderson, R., and Ponnavolu, K. 2002. Customer Loyalty in
e-commerce: an exploration of its antecedents and consequences. Journal of Retailing, 78. pp. 41-50.
Tang, T.W., and Huang, R.T. 2015. The Relationships among Trust, E-Satisfaction, E-Loyalty, and Customer Online Behaviors. International Journal of Business and Industrial Marketing. 1(2) pp.16-25
Ubedullah, A.A.S and Navee, U.R.K. 2012. Impact of Service Quality on customer satisfaction: Evidences from the Restaurant Industry in Pakistan.
Management & Marketing, 9(2) pp.343-355.
Zhang, X and Tang, Y., 2006. Customer perceived E-Service Quality in Online Shopping. Master Thesis, Marketing Lulea University of Technology.
Zhilin, Y., Minjoonjun., and Peterson, R.T., 2004. Measuring Customer Perceived Online service quality – Scale development and managerial implications.
International Journal of Operations & Productions management, 24(11), pp 1149-1174.