ORIGINAL ARTICLE
Performance comparison of fuzzy and non-fuzzy
classification methods
B. Simhachalam
a,*, G. Ganesan
ba
Department of Mathematics, GIT, GITAM University, Visakhapatnam, Andhra Pradesh 530045, India b
Department of Mathematics, Adikavi Nannaya University, Rajahmundry, Andhra Pradesh 533296, India Received 27 July 2015; revised 23 September 2015; accepted 30 October 2015
Available online 29 November 2015
KEYWORDS
k-means; Fuzzy c-means; Gustafson–Kessel; Classification;
Partition based clustering
Abstract In data clustering, partition based clustering algorithms are widely used clustering algorithms. Among various partition algorithms, fuzzy algorithms, Fuzzy c-Means (FCM), Gustafson–Kessel (GK) and non-fuzzy algorithm, k-means (KM) are most popular methods. k-means and Fuzzy c-Means use standard Euclidian distance measure and Gustafson–Kessel uses fuzzy covariance matrix in their distance metrics. In this work, a comparative study of these algo-rithms with different famous real world data sets, liver disorder and wine from the UCI repository is presented. The performance of the three algorithms is analyzed based on the clustering output cri-teria. The results were compared with the results obtained from the repository. The results showed that Gustafson–Kessel produces close results to Fuzzy c-Means. Further, the experimental results demonstrate that k-means outperforms the Fuzzy c-Means and Gustafson–Kessel algorithms. Thus the efficiency of k-means is better than that of Fuzzy c-Means and Gustafson–Kessel algorithms.
Ó2015 Production and hosting by Elsevier B.V. on behalf of Faculty of Computers and Information,
Cairo University. This is an open access article under the CC BY-NC-ND license (http://creativecommons. org/licenses/by-nc-nd/4.0/).
1. Introduction
Many organizations generate and store large volume of data in their databases. The methods to extract the most useful knowledge from the databases are known as Data mining or
knowledge discovery in databases (KDD). Data mining is an analytic process of discovering valid, unsuspected relationships among datasets and transforms the data into a structure that are both understandable and useful to the users.
Data analysis contains several techniques and tools for handling the data. Classification or clustering is well known method in data analysis. It is a multivariate analysis technique to partition the dataset into groups (classes or clusters) in a dataset such that the most indiscernible objects belong to the same group while the discernible objects in different groups. Clustering methods are used as a common technique in many fields such as pattern recognition, machine learning, image segmentation, medical diagnostics and bio-informatics[5].
* Corresponding author. Tel.: +91 9866118074.
E-mail addresses: [email protected] (B. Simhachalam), prof.
[email protected](G. Ganesan).
Peer review under responsibility of Faculty of Computers and Information, Cairo University.
Production and hosting by Elsevier
Cairo University
Egyptian Informatics Journal
www.elsevier.com/locate/eijwww.sciencedirect.com
http://dx.doi.org/10.1016/j.eij.2015.10.004
1110-8665Ó2015 Production and hosting by Elsevier B.V. on behalf of Faculty of Computers and Information, Cairo University.
The two important features in clustering are partition-based clustering and hierarchical-partition-based clustering. Partition-based clustering algorithms have the capable of discovering underlying structures of clusters by using appropriate objective function[15]. The algorithms k-means (KM), Fuzzy c-Means (FCM) and Gustafson–Kessel (GK) clustering algorithms are widely used partition-based clustering algorithms. The algo-rithms k-means and Fuzzy c-Means are proposed based on Euclidean distance measure and an adaptive distance measure was proposed in Gustafson–Kessel (GK) clustering algorithm. Several comparisons are carried out by the following researchers: Jaindong, Hongzan, Jaiwen, Qiyong[16]analyzed the performance of k-means and Fuzzy c-Means algorithms and reported that the k-means method is preferable to FCM for Arterial Input Function (AIF) detection using both clinical and simulated data. Velmurugun[14]has compared the clus-tering performance of k-means and Fuzzy c-Means algorithms using different shapes of arbitrary distributed data points and reported that the k-means performs better than FCM. Simhachalam and Ganesan[12]analyzed the performance of Fuzzy c-Means and Gustafson–Kessel algorithms on medical diagnostics systems and reported that the performance of GK method is better than the FCM method. Wang and Gar-ibaldi [17] have compared the performance of k-means and Fuzzy c-Means algorithms on Infrared spectra collected from auxiliary lymph node tissue section. Mousumi Gupta[8] pro-posed data scaling method in Gustafson–Kessel algorithm for target detection on scaled data and compared with FCM method. Neha and Seema [9] examined the performance between FCM and GK using cluster validity measures. Dibya Joyti and Anil kumar Gupta[3] evaluated the performance between k-means and Fuzzy c-Means algorithms based on time complexity. Soumi Gosh and Sanjay Kumar Dubey[13]
evaluated the clustering performance of k-means and Fuzzy c-Means algorithms on the basis of the efficiency of the cluster-ing output and the computational time and reported that k-means is superior to FCM. Bharati and Gohokar [1]
compared the color image segmentation performance between k-means and Fuzzy c-Means algorithms.
The work in this paper aimed to compare the performance of the three clustering techniques, k-means (KM), Fuzzy c-Means (FCM) and Gustafson–Kessel (GK). The most popular real world date sets such as Liver Disorders and Wine are applied to test the performance of these algorithms and a comparative analysis is presented in this work. The rest of this work is organized as follows: In Section2, concise details of data sets and the three algorithms are presented. In Section3, results and discussion are presented and the conclusions are in Section4.
2. Materials and methods
Clustering is an unsupervised data analysis which is used to partition a set of records or objects into clusters or classes with similar characteristics. The partition is done in such a fashion that most similar (or related) objects are placed together, while dissimilar (or unrelated) objects are placed in different classes or groups.
The desired characteristics of clustering methods are ability to deal with different types of attributes with high
dimensionality, effective handling of outliers and noise with minimum knowledge, ability to discover the underlying shapes and structures of the data, scalability, usability and inter-pretability. Clustering methods are categorized into five differ-ent methods: partitioning method, hierarchical method, data density based method, grid based method and model based or soft computing methods. Among these five methods parti-tion based methods, k-means (KM), Fuzzy c-Means (FCM) and Gustafson–Kessel (GK) clustering algorithms are imple-mented using two well known data sets liver disorders and wine to generate two clusters and three clusters respectively.
2.1. The dataset
The real world data sets Liver Disorder and Wine were obtained from the UCI Machine Learning Repository donated by Richard [11] and Forina [4] respectively. The Liver data set contains 341 samples with 6 attributes or blood tests each. These blood tests are capable of detecting liver disorders which might arise due to excessive alcohol consumption. The attributes are the measurements of the blood tests namely mean corpuscular volume (mcv), alkaline phosphatase (alkphos), alanine aminotransferase (sgpt), aspartate aminotransferase (sgot), gamma-glutamyl transpep-tidase (gammagt) and the number of half-pint equivalents of alcoholic beverages drunk per day (drinks). The 341 samples are clustered into two different classes according to the liver disorders: Class 1 containing 142 samples and Class 2 con-taining 199 samples. The Wine data set contains 178 samples and each sample has 13 attributes or chemical analysis of the wine derived from three different cultivars but grown in the same region in Italy. The samples are grouped into three dif-ferent classes according to the cultivars: Cultivar 1 containing 59 samples, Cultivar 2 containing 71 samples and Cultivar 3 containing 48 samples. The attributes are the values of chem-ical analysis of Alcohol, Malic acid, Ash, Alkalinity of ash, Magnesium, Total phenols, Flavonoids, Nonflavonoid phe-nols, Proanthocyanins, Color intensity, Hue, OD280/OD315 of diluted wines and Proline.
2.2. k-means clustering
MacQueen [7] introduced the k-means or Hard C-Means algorithm in 1967. It is a partitioning algorithm applied to classify data into cð16c6NÞ clusters and each object (observation) can only belong to one cluster at any one time. Consider a datasetZwithN observations. Each observation is an n-dimensional row vector, zk¼ ½zk1;zk2;. . .zkn; 2R
n
. The datasetZis represented asNnmatrix. The rows ofZ represent samples (observations) and the columns are measure-ments for these samples (objects). k-means model achieves its partitioning by the iterative optimization of its objective function (a squared error function) given as
JðVÞ ¼X c i¼1 XN k¼1 zkvi k k2 ð1Þ wherekzkvik 2
is the Euclidean distance calculated between kth object, zk andith centroid, vi. The algorithm comprises
Step 1: Initial the desired number of clusters,c. Step 2: Placeccluster centroids.
Step 3: Assign each sample to a cluster by determining the closest distance between the sample and centroid. Step 4: Update the cluster centroid using vi¼ 1
ci Pci
i¼1zi, whereci is the number of objects in theith cluster. Step 5: Determine the closest distances between the objects
and centroids.
Step 6: Update the samples in the clusters.
Step 7: Repeat from Step 3 until stopping criterion has been met.
k-means algorithm is an iterative method. This algorithm can be run several times to reduce the sensitivity caused by initial random selection of centroids.
2.3. Fuzzy c-Mean clustering
Fuzzy c-Means algorithm (FCM) is one of the most popular fuzzy clustering methods. FCM is developed based on fuzzy theory. In this method it uses membership function to assign membership values ranged from 0 to 1 to each object. The feature in FCM is that every object belongs to every cluster with different membership values. The partition of the data-set Z into c clusters is represented by the fuzzy partition matrix U¼ ½likcN. The fuzzy partitioning space for Z is the set Mfc¼ U2RcN=l ik2 ½0;1;8i;k; Xc i¼1 lik¼1;8k;0< XN k¼1 lik;8i ( ) ð2Þ Fuzzy c-Mean model achieves its partitioning by the iterative optimization of its objective function given as
min |{z} U;V JðZ; U;VÞ ¼X c i¼1 XN k¼1 ðlikÞ m zkvi k k2 A ( ) whereU2Mfc ð3Þ Herem2 ½1; 1Þis a weighting parameter that determines the degree of fuzziness,V¼ ½v1; v2;. . .;vcwherevi2Rnis a
vec-tor of (unknown) cluster prototypes (centers). The prototypes, the membership functions and the distance metric are calculated by the Eqs.(3)–(5)respectively.
vi¼ PN k¼1ð Þlik m zk PN k¼1ð Þlik m ð4Þ lik¼ Xc j¼1 DikA DjkA 2 m1 !1 ð5Þ D2 ikA¼kzkvik2A¼ ðzkviÞTAðzkviÞ ð6Þ where 16i6c, 16k6N.
When the objective function converges to a local minimum the iteration terminates. Bezdek et al.[6]proposed the detailed algorithm. The algorithm comprises of the following basic steps:
Step 1: Randomly initialize Uð0Þ;c;m and the termination tolerancee>0.
Step 2: With UðkÞ determine the centroids vector V ¼ ½v1; v2;. . .;vcby using Eq.(4).
Step 3: UpdateUðkÞ;Uðkþ1Þ by using Eq.(5).
Step 4: If Uðkþ1ÞUðkÞ<e then stop, else repeat from step 2 by increasing the step valuek.
Although FCM is a popular clustering method it has some drawbacks. For example, it creates noise points when the method is applied to partition two clusters with an object having equidistance from two cluster’s centers. FCM uses standard Euclidean distance norm.
2.4. Gustafson–Kessel clustering
Another fuzzy iterative algorithm GK (extended FCM) was initially proposed by Gustafson and Kessel [2] and later improved by Babuska et al. [10]. Babuska et al. introduced an adaptive distance norm, in order to detect different geomet-rical shapes of the clusters in one data set when the covariance matrixFi fails to be non-singular by the choice of the matrix
Ai. The distance metric in this algorithm is given by
D2ikAi¼kzkvik 2 A¼ ðzkviÞ T AiðzkviÞ; 16i 6c; 16k6N ð7Þ
The GK algorithm objective functional is defined as min |{z} U;V JðZ;U;V;f gÞ ¼Ai Xc i¼1 XN k¼1 ðlikÞ m D2 ikAi ( ) ð8Þ To obtain a feasible solution the norm inducing matrix is constrained asjAij ¼qi; qi>0; 8i.
The expression forAi is defined as
Ai¼½qidetðFiÞn
1 F1
i ; 16i6c ð9Þ
where theith cluster’s fuzzy covariance matrixFiis given by
Fi¼½/i1. . ./indiagðki1. . .kinÞ½/i1. . ./in 1 with ð10Þ Fi¼ PN k¼1ð Þlik mðz kviÞðzkviÞ T PN k¼1ð Þlik m ;16i6c; Fi¼ ð1cÞFiþcdetðF0Þ 1=n I
and the eigenvalues and eigenvectors are set askij¼maxjkij=b
for all j for which maxjkij=kij>brespectively.
The algorithm comprises of the following basic steps: Step 1: Randomly initialize Uð0Þ;c, the termination
toler-ance e>0, the cluster volumes qi>0 (generally 1),b¼1015and weighting parameterc2 ½0;1. Step 2: Determine the centroidsvðkÞi by using Eq.(4). Step 3: Calculate the cluster covariance matricesFiby using
Eq.(10).
Step 4: Obtain the distances by using Eq.(7). Step 5: UpdateUðkÞ;Uðkþ1Þ by using Eq.(4).
Step 6: If Uðkþ1ÞUðkÞ<e then stop, else repeat from step 2 by increasing the step valuek.
The same parameters which are used in FCM are used in GK algorithm. The constraintqi is used to find the clusters
of approximately equal volumes and the parametersb;chelp to avoid the covariance matrix to become singular.
3. Results and discussion 3.1. Results
The algorithms were implemented in MATLAB version R2010a. To achieve good clustering results authors considered the maximum of 100 iterations and 15 independent test runs. The threshold value ise¼0:00001 and the weighting exponent in FCM and GK ism= 2.
The liver disorder data set contains 341 samples classified as two different classes. Each sample is characterized by 6 attri-butes and all the samples are labeled by numbers 1 to 341. The samples from 1 to 142 are classified as class 1 and from 143 to 341 are classified as class 2. The algorithms KM, FCM and GK are applied to generate two clusters. GK gener-ates two clusters corresponding to class 1 and class 2 contain-ing 67 and 274 samples respectively. 45 samples that belong to class 2 are wrongly assigned to class 1 and 120 samples associ-ated with class 1 are wrongly assigned to class 2. FCM gener-ates two clusters corresponding to class 1 and class 2 containing 53 and 288 samples respectively. 36 samples that belong to class 2 are wrongly grouped into class 1 and 125 samples that belong to class 1 are wrongly grouped into class 2. The method KM generates two clusters containing 38 and 303 samples corresponding to class 1 and class 2 respectively.
24 samples that belong to class 2 are wrongly grouped into class 1 and 128 samples that belong to cluster 1 are wrongly grouped into class 2.
The data set of wine contains 178 samples classified into three different clusters according to their cultivars. Each sample is characterized by 13 attributes and all the samples are labeled by numbers 1 to 178. The samples from 1 to 59 are classified as cultivar 1, from 60 to 130 are classified as cultivar 2 and from 131 to 178 are classified as cultivar 3. The algorithms KM, FCM and GK are applied to cluster the data set into three different clusters namely Cultivar 1, Cultivar 2 and Cultivar 3. GK generates three clusters cor-responding to cultivar 1, cultivar 2 and cultivar 3 containing 32, 92 and 54 samples respectively. 17 samples associated with cultivar 2 are wrongly assigned to cultivar 1. 43 sam-ples associated with cultivar 1 and the samsam-ples numbered 141, 142 that belong to cultivar 3 are wrongly grouped into cultivar 2. The samples numbered 42 of cultivar 1 and 7 samples of cultivar 2 are wrongly assigned to cultivar 3. FCM generates three clusters corresponding to cultivar 1, cultivar 2 and cultivar 3 containing 46, 71 and 61 samples respectively. The sample numbered 74 that belongs to culti-var 2 is wrongly assigned to culticulti-var 1. 21 samples that belong to cultivar 3 wrongly grouped into cultivar 2. 14 samples associated with cultivar 1 and 20 samples associated with cultivar 2 are wrongly grouped into cultivar 3.
The method KM classified the data set into three clusters namely cultivar 1, cultivar 2 and cultivar 3 containing 47, 69
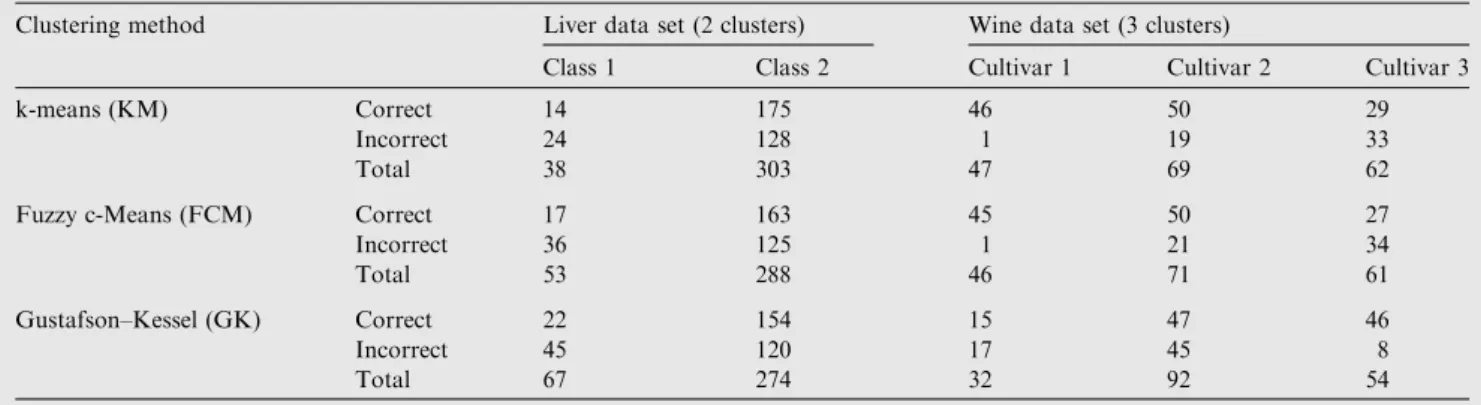
Table 1 The clustering results obtained by the algorithms KM, FCM and GK for the liver disorder and wine data sets.
Clustering method Liver data set (2 clusters) Wine data set (3 clusters)
Class 1 Class 2 Cultivar 1 Cultivar 2 Cultivar 3
k-means (KM) Correct 14 175 46 50 29
Incorrect 24 128 1 19 33
Total 38 303 47 69 62
Fuzzy c-Means (FCM) Correct 17 163 45 50 27
Incorrect 36 125 1 21 34
Total 53 288 46 71 61
Gustafson–Kessel (GK) Correct 22 154 15 47 46
Incorrect 45 120 17 45 8
Total 67 274 32 92 54
Table 2 Comparison of performance of the clustering results obtained by the algorithms FCM, FPCM and PFCM for the liver disorder and wine data sets.
Clustering method Liver data set (2 clusters) Wine data set (3 clusters)
Correctness % Classification performance
%
Correctness % Classification performance
%
Class 1 Class 2 Cultivar
1 Cultivar 2 Cultivar 3 k-means (KM) 9.85 87.94 55.43 77.69 70.42 60.41 70.22 Fuzzy c-Means (FCM) 11.97 81.91 52.79 76.27 70.42 56.25 68.54 Gustafson–Kessel (GK) 15.49 77.38 51.62 25.42 66.19 95.83 60.68
and 62 samples respectively. The sample numbered 74 that belongs to cultivar 2 is assigned to cultivar 1 wrongly. 19 sam-ples associated with cultivar 3 are wrongly assigned to cultivar 2. 13 samples of cultivar 1 and 20 samples of cultivar 2 are wrongly grouped into cultivar 3.
The results of the clustering methods containing number of samples that are classified properly and improperly into the respected clusters of the data sets are summarized and shown inTable 1.
3.2. Discussions
According to the results of the k-means algorithm obtained for the liver disorder data set, out of 142 samples of the class 1 cluster, 14 samples were properly grouped. 128 samples of the class 1 cluster were grouped incorrectly as the class 2 samples. These frequencies are equal to 17 and 125 samples respectively if Fuzzy c-Means is applied and 22 and 120 samples respectively if Gustafson–Kessel algorithm is applied. Further, out of 199 samples of the cluster class 2, 175 samples were correctly classified. Only 24 samples of the cluster class 2 were wrongly classified as the class 1 samples. These frequencies are equal to 163 and 36 samples respectively if Fuzzy c-Means is applied and 154 and 45 samples respectively if Gustafson–Kessel algorithm is applied.
For the liver data set the algorithm k-means achieved accu-racy of about 9.85% for the cluster class 1 and 87.94% for the cluster class 2. In comparison, FCM method achieved accu-racy of about 11.97% and 81.91% and GK method achieved accuracy of about 15.49% and 77.38% respectively.
According to the results of the k-means algorithm obtained for the wine data set, out of 59 samples of the cluster cultivar 1, 46 samples were assigned properly. 13 samples of the cultivar 1 cluster were grouped wrongly as the cultivar 3 samples. These frequencies are equal to 45 and 14 samples respectively if Fuzzy c-Means is used. When Gustafson–Kessel algorithm is implemented, out of 59 samples of cultivar 1, 15 samples are properly classified. In the remaining 44 samples that belong to cultivar 1, 43 samples were assigned to cultivar 2 and only one sample was assigned to cultivar 3 wrongly. Further, out
of 71 samples of the cluster cultivar 2, 50 samples were assigned properly. Only one sample was wrongly classified as cultivar 1 sample and 20 samples were grouped wrongly as cul-tivar 3 samples. These frequencies are equal to 50, 1 and 20 samples respectively if Fuzzy c-Means is used and 47, 17 and 7 samples respectively if Gustafson–Kessel algorithm is imple-mented. For the cluster cultivar 3 with 48 samples, 29 samples are correctly classified. 19 samples of cultivar 3 were incor-rectly assigned to cultivar 2. These frequencies are equal to 27 and 21 samples respectively if Fuzzy c-Means is imple-mented and 46 and 2 samples respectively if Gustafson–Kessel algorithm is applied.
For the wine data set the algorithm k-means achieved accu-racy of about 77.96% for the cultivar 1, 70.42% for the culti-var 2 and 60.41% for the culticulti-var 3. In comparison, FCM method achieved accuracy of about 76.27%, 70.42% and 56.25% and GK method achieved accuracy of about 25.42%, 66.19% and 95.83% respectively.
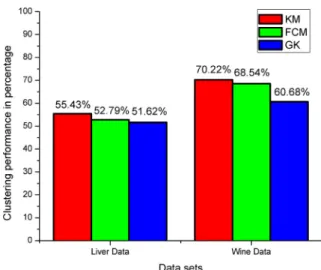
According to the results obtained for the three methods the classification performance of k-means yields its best with 55.43% comparing to the method FCM and GK which yield 52.79% and 51.62% respectively in case of liver disorder data set. The classification performance of k-means yields its best with 70.22% comparing to the method FCM and GK which yield 68.54% and 60.68% respectively in case of wine data set.
The correctness and the classification performance in per-centage of the three methods are summarized inTable 2.
The classification performance of the algorithms KM, FCM and GK is shown inFig. 1. InFig. 1,x-axis represents the data sets and the performance percentages of the algo-rithms are represented byy-axis.
4. Conclusion
Cluster analysis is used to partition a dataset into several clus-ters. The data from the same cluster have most similar charac-teristics, which could be distinguishable for those of other clusters. In this work, among several different algorithms of cluster analysis, three popular clustering algorithms, k-means (KM), Fuzzy c-Means (FCM) and Gustafson–Kessel (GK) algorithms have been used for comparative study. Authors tested the classification performance of these algorithms with two well known data sets such as liver disorder and wine from UCI machine learning repository. Although fuzzy clustering has its own advantages, the experimental results showed that the classification performance of Hard c-means i.e. k-means had better results than FCM and GK algorithms. Authors also presented the comparable results of correctness obtained from the experiments. As a result, the k-means algorithm yields more accurate compared to Fuzzy c-Means and Gustafson– Kessel (GK) clustering algorithms. Further, as a future study, the hybridization of these algorithms with evolutionary algo-rithms can be implemented to improve the classification performance.
Acknowledgment
The authors would like to thank Prof. V. Sita Ramaiah, Department of Mathematics, GITAM University, India, for providing language help.
Figure 1 Performance comparison between KM, FCM and GK algorithms.
References
[1]Jipkate Bharati R, Gohokar VV. A comparative analysis of fuzzy c-means clustering and k means clustering algorithms. Int J Comput Eng Res 2012;2(3):737–9.
[2] Gustafson DE, Kessel WC. Fuzzy clustering with a fuzzy covariance matrix. In: Proceedings of IEEE conference on decision control, San Diego, CA, USA; 1979. p. 761–6. [3]Bora Dibya Jyoti, Gupta Anil Kumar. A comparative study
between fuzzy clustering algorithm and hard clustering algorithm. Int J Comput Trends Technol 2014;10(2):108–13.
[4] Forina M, Aeberhard Stefan, Leardi Riccardo. UCI machine learning repository [http://archive.ics.uci.edu/ml]. Insittute of Pharmaceutical and Food Analysis and Technologies, Via Brigata Salerno, Genoa, Italy; 1991.
[5]Jain A, Muryt M, Flynn P. Data clustering: a review. ACM Comput Surveys 1999;31(3):264–323.
[6]Bezdek James C, Ehrlich Robert, Full William. FCM: the fuzzy c-means clustering algorithm. Comput Geosci 1984;10(2–3): 191–203.
[7] MacQueen J. Some methods for classification and analysis of multivariate observations. In: Proceedings of the fifth Berkeley symposium on mathematical statistics and probability, Berkeley, vol 1: statistics; 1967. p. 281–97.
[8]Gupta Mousumi. Target detection by fuzzy Gustafson–Kessel algorithm. Int J Image Process 2013;7(2):203–8.
[9]Jain Neha, Shukla Seema. Fuzzy databases using extended fuzzy c-means clustering. Int J Eng Res Appl 2012;2(3): 1444–51.
[10] Babuska R, van der Veen PJ, Kaymak U. Improved covariance estimation for Gustafson–Kessel clustering. In: IEEE interna-tional conference on fuzzy systems, Honolulu; 2002. p. 1081–5. [11] Forsyth Richard S. UCI machine learning repository [http://
archive.ics.uci.edu/ml]. Mapperley Park, Nottingham NG3 5DX, England; 1990.
[12] Simhachalam B, Ganesan G. Modified Gustafson–Kessel cluster-ing on medical diagnostic systems. In: Proceedcluster-ings of IEEE international conference on electrical electronics, signals, commu-nication and optimization (EESCO), Visakhapatnam, India; 2015. p. 1–4. doi:http://dx.doi.org/10.1109/EESCO.2015.7254019. [13] Gosh Soumi, Dubey Sanjay Kumar. Comparative analysis of
k-means and fuzzy c k-means algorithms. Int J Adv Comput Sci Appl 2013;4(4):35–9.
[14] Velmurugun T. Performance comparison between k-means and fuzzy c-means algorithms using arbitrary data points. Wulfenia J 2012;9(8):234–41.
[15] Velmurugan T, Santhanam T. A survey of partition based clustering algorithms in data mining: an experimental approach. Inform Technol J 2011;10(3):478–84.
[16] Yin J, Sun H, Yang J, Guo Q. Comparison of k-means and fuzzy c-means algorithm performance for automated determination of
the arterial input function. PLoS ONE 2014;9(2):1–8.http://dx.
doi.org/10.1371/journal.pone.0085884.
[17] Wang XY, Garibaldi JM. A comparison of fuzzy and non-fuzzy clustering techniques in caner diagnosis. In: Proceedings of second international conference in computational intelligence in medicine and healthcare the biopattern conference, Costa da Caparica, Lisbon, Portugal; 2005. p. 250–6.