FINANCIAL STABILITY
The cut-off date of this report: 24 April 2019.
Reproduction for educational and non-commercial purposes is permitted provided that the source is acknowledged.
© Banco de España, Madrid, 2019
ABBREVIATIONS (*)
€ Euro
AFME Association for Financial Markets in Europe
AMCESFI Autoridad Macroprudencial Consejo de Estabilidad Financiera (Macroprudential Authority Financial Stability Council)
ATA Average total assets
AUROC Area under the receiver operating characteristics curve BCBS Basel Committee on Banking Supervision
BIS Bank for International Settlements BMR Benchmarks regulation
bn Billion bp Basis points
CBS Consolidated banking statistics
CBSO Banco de España Central Balance Sheet Data Office CCPs Central counterparties
CCyB Countercyclical capital buffer
CCR Banco de España Central Credit Register CDO Collateralised debt obligation
CDS Credit Default Swap
CEBS Committee of European Banking Supervisors CEMBI Corporate Emerging Markets Bond Index
CESFI Consejo de Estabilidad Financiera (Financial Stability Council) CET1 Common Equity Tier 1 capital
CJEU Court of Justice of the European Union CLOs Collateralised loan obligations
CNMV Comisión Nacional del Mercado de Valores (National Securities Market Commission) COE Cost of equity
CPMI Committee on Payments and Market Infrastructures CPSS Basel Committee on Payment and Settlement Systems CRD Capital Requirements Directive
CRR Capital requirements regulation
DGSyFP Dirección General de Seguros y Fondos de Pensiones (Directorate General of Insurance and Pension Funds)
EBA European Banking Authority ECB European Central Bank EDW European Data Warehouse EMMI European Money Markets Institute EMU Economic and Monetary Union EONIA Euro overnight index average
ESMA European Securities and Markets Authority ESRB European Systemic Risk Board
EU European Union €STR Euro short-term rate
FLESB Forward-Looking Exercise on Spanish Banks FRA Forward rate agreement
FSAP Financial Sector Assessment Program FSB Financial Stability Board
FSMA Financial Services and Markets Authority (of Belgium) FSR Financial Stability Report
GDP Gross domestic product
G-SIIs Global Systemically Important Institutions IAS International Accounting Standards
ID Data obtained from individual financial statements IFRSs International Financial Reporting Standards IIP International investment position
IMF International Monetary Fund INE National Statistics Institute
IOSCO International Organization of Securities Commissions ISDA International Swaps and Derivatives Association LCR Liquidity coverage ratio
LSI Less significant institutions LSTI Loan service to income
(*) The latest version of the explanatory notes and of the glossary can be found in the November 2006 edition of the Financial Stability Report.
LTI Loan to income LTP Loan to price
LTV Loan-to-value ratio (amount lent divided by the appraised value of the real estate used as collateral) m Million
MiFID Markets in Financial Instruments Directive MMSR Money market statistical reporting regulation NAFTA North American Free Trade Agreement
MREL Minimum Requirement for own funds and Eligible Liabilities NPISHs Non-profit institutions serving households
NPLs Non-performing loans OFIs Other financial institutions OIS Overnight indexed swap
O-SIIs Other systemically important institutions OTC Over the counter
PER Price earnings ratio pp Percentage points RTGS Real-time gross settlement ROA Return on assets ROE Return on equity RWA Risk-weighted assets SI Significant institutions
SIFMA Securities Industry and Financial Markets Association SLIs Specialised lending institutions
SMEs Small and medium-sized enterprises SSM Single Supervisory Mechanism S-VAR Structural vector autoregression TA Total assets
TIPS TARGET Instant Payment Settlement TLTROs Targeted Longer-term Refinancing Operations T2 TARGET2
T2S TARGET2-Securities
USMCA United States, Mexico and Canada Agreement
ISO COUNTRY CODES AT Austria BE Belgium BG Bulgaria BR Brazil CH Switzerland CL Chile CN China CY Cyprus CZ Czech Republic DE Germany DK Denmark EE Estonia ES Spain FI Finland FR France GB United Kingdom GR Greece HR Croatia HU Hungary IE Ireland IT Italy JP Japan KY Cayman Islands LT Lithuania LU Luxembourg LV Latvia MT Malta MX Mexico NL Netherlands NO Norway PL Poland PT Portugal RO Romania SE Sweden SI Slovenia SK Slovakia TR Turkey US United States
CONTENTS
1.1 Macroeconomic environment 23
1.2 Financial markets and real estate sector 25 1.3 The non-financial sectors 33
2.1 Deposit institutions 45
2.2 Non-banking financial sector and systemic interconnections 67 2.3 Changes in operational risks 71
3.1 Analysis of systemic vulnerabilities 79
3.2 Macroprudential policy instruments and measures 83
3.3 Warnings and recommendations 89
Annex 1. Consolidated balance sheet of deposit institutions 91
Annex 2. Consolidated income statement of deposit institutions 92 MAIN RISKS TO THE STABILITY OF THE SPANISH FINANCIAL SECTOR 17 1 RISKS IN THE MACROFINANCIAL ENVIRONMENT 23 2 RISKS TO THE FINANCIAL SECTOR AND ITS RESILIENCE 45
3 MACROPRUDENTIAL POLICY 79
Table 1 Risk factors 17
Chart A Consensus forecast for 2019 18 Chart B Stock market indices 18 Chart C Return on assets 19 Chart D CET1 ratio 19
Chart 1.1 Systemic countries of material importance 24 A Contributions to global GDP change
B Contributions to quarter-on-quarter GDP change of the euro area C Consensus forecasts for 2019
D Global impact of a deceleration in China
Chart 1.2 Spanish GDP 25 A Spain. GDP change
B Spain. GDP change and contributions in pp
Chart 1.3 Financial market indicators 26 A Stock market indices B Corporate spreads C 10-year interest rates
D 10-year government bond yield spread over Germany E Banking indices
F Exchange rate against the dollar G Goldman Sachs financial conditions index H Cyclically adjusted PER
Chart 1.4 Housing market activity indicators 29 A House prices
B Indicators of house price imbalances C Transactions
D Housing building permits and net household formation. Upturn
Chart 1.5 Credit to the real estate sector 31
A Credit to the construction and real estate activities sector B Credit to the construction and real estate activities sector. Distribution of the annual change in December 2018 C Mortgage loans for house purchase
Chart 1.6 Normalisation of mortgage credit standards 32 A LTV ratio. Distribution
B LTP ratio. Distribution C LTI ratio. Distribution D LSTI ratio. Distribution E Maturities. Distribution F Interest rate spread
Chart 1.7 Financing and indebtedness in Spain 34
A Lending to households by purpose. Y-o-y change B Lending to non-financial corporations. Y-o-y change C Debt ratios
D Firms subject to greater financial pressure in two consecutive periods
E General government financing. Y-o-y rates. Contribution by financing instrument F Financial situation of general government
Chart 1.8 Household indebtedness 37 A Household debt / gross income
B Amount of consumer loan / gross income
Chart 1.9 Productivity of firms and bank financing 37
A Productivity density kernels for firms that did not decrease their borrowing in 2018 and other
B Accumulated impact of productivity on the change in lending to non-financial corporations
Chart 2.1 Credit to the resident private sector 45
A Credit volume and year-on-year rate of change
B New credit volume in last 12 months and year-on-year rate of change
Chart 2.2 Distribution by institution of the change in credit to the resident private sector 46 A Distribution of the year-on-year rate of change in total credit
B Distribution of the year-on-year rate of change in credit to non-financial corporations
Chart 2.3 Interest rates on new loans 46 A New loan interest rates (APR) - firms B New loan interest rates (APR) - households
Chart 2.4 NPL ratio. Resident private sector 47 Chart 2.5 Flow of resident private sector NPLs 48 Chart 2.6 Foreclosed assets 48
A Foreclosed assets
B Breakdown of foreclosed assets. December 2018
Chart 2.7 Exposure to the United Kingdom and loans abroad 49 A Exposure to the United Kingdom
B Loans abroad
Chart 2.8 NPL ratio 50
A Changes in NPL ratio abroad B NPL ratios. European comparison
Chart 2.9 Liquidity coverage ratio 51 A Aggregate LCR
B Distribution of LCR based on net liquidity outflows
Chart 2.10 Liquidity coverage ratio. European comparison. SSM countries and United Kingdom 52 Chart 2.11 Wholesale funding 53
A Eurosystem balance sheet and liquidity surplus
B Outstanding amount provided through Eurosystem tenders C Turnover in EU money markets
D EU money market rates
E Main issues of Spanish institutions in medium-and long-term wholesale markets
Chart 2.12 Cost in Europe of debt instrument issuance 56 A Cost of debt instruments issuance
B Average cost of debt instruments issuance: 2016-2018, by country C Average cost of debt instruments issuance per year
D CET1 effect on the cost of debt instruments
Chart 2.13 Consolidated profitability 58
A Breakdown of the change in consolidated profit attributed to the parent institution in December 2018 with respect to December 2017 as a % of ATA B Financial asset impairment losses as a % of ATA
Chart 2.14 Net interest income and net commissions 59 A Financial revenue and costs, and net interest income B Net commissions amounts and percentage of gross income
Chart 2.15 Cost-to-income ratio and operating expenses 59 A Cost-to-income ratio
B Breakdown of administrative expenses and depreciation
Chart 2.16 Profitability and efficiency. European comparison. SSM countries and United Kingdom 60
A ROA
B Cost-to-income ratio
Chart 2.17 Capital and RWAs 61 A Capital ratios
B Levels of capital and risk exposure
Chart 2.18 Change in the CET1 capital ratio 62 A Distribution of the change in the CET1 ratio
B Rate of change in the CET1 ratio and in RWAs in 2018
Chart 2.19 Composition of the CET1 ratio and dividends as a percentage of RWAs 63 A Composition of the CET1 ratio relative to risk-weighted assets
B Dividends as a % of risk-weighted assets in 2018
Chart 2.20 Solvency. European comparison. SSM countries and United Kingdom 63
A CET1 ratio
B Leverage ratio
Chart 2.21 FLESB sensitivity analysis scenarios 65
A Impact on the cumulative rate of change of GDP B Impact on the cumulative rate of change of house prices
Chart 2.22 Results of FLESB sensitivity analysis 66
Chart 2.23 Total financial assets of the sectors comprising the financial system 68 A Financial assets of banking and non-banking financial sector B Financial assets of other financial entities
Chart 2.24 Interconnections between banks, insurance companies, pension funds and OFIs 69
Chart 2.25 Banks’ exposures to other sectors 69 A Banks’ exposures to OFIs
B Banks’ exposures to insurance companies
Chart 2.26 Banks’ liabilities to other sectors and OFIs’ interconnections with other sectors 70 A Banks’ liabilities to OFIs
B Banks’ liabilitites to insurance companies C Banks’ liabilities to pension funds
D OFIs’ interconnections with banks, insurance companies and pension funds
Chart 2.27 Misconduct costs and provisions for legal expenses 72 A Misconduct costs
B Provisions for legal expenses and tax lawsuits
Chart 3.1 Heat map by sub-category 82
Chart 3.2 Complementary indicators for CCyB decisions 86 A Indicators of house price imbalances
B Current account balance (% of GDP) C Credit intensity
D Private sector debt burden
Chart 3.3 Output gap and credit-to-GDP gap 87
Table 3.1 Capital buffers for systemically important institutions 88
LIST OF BOXES
Box 1.1 Determinants of the behaviour of the consumer credit portfolio 35 A Year-on-year rate of change of consumer credit and its components
B Year-on-year rate of change of non-performing consumer credit and its components C Relationship between durable good consumption and disposable income
D Breakdown of consumer credit supply and demand factors E Change in total consumer credit. Sensitivities
F Change in NPLs for consumer credit. Sensitivities
Box 1.2 Leveraged loans to corporates 39
A Issuance of leveraged loans and high-yield bonds B CDO/CLO issuance
C Flow of leveraged loan issuance by country of borrower D Stock of leveraged loan issuance by country of borrower E Syndicated loans to non-financial corporations
F Syndicated loans to non-financial corporations. As a percentage of loans to non-financial corporations
G Distribution of the debt to asset ratio by exposure drawn down in syndicated loans H Percentage of volume drawn down by debt ratio bucket. Large firms
Box 1.3 International investment position of Spain 42 A Current and capital account balances
B Net IIP. Breakdown by functional category C Net IIP. Breakdown by institutional sector D Net IIP. Breakdown by institutional sector E External debt. International comparison
F Gross external debt structure by institutional sector and maturity
Box 2.1 The reform of benchmark rates: from EONIA to €STR 54
Box 2.2 Central clearing counterparties and their implications for financial stability 74 Diagram A Bilateral and centralised clearing
A OTC derivatives cleared through CCPs
B Volumes cleared by CCPs in the swap segment, by currency and geographical area C Initial margins posted by the five largest members. Swap segment.
D Banks as clearing members. Swap segment.
Box 3.1 AMCESFI: the new macroprudential authority for the Spanish financial system 80 Diagram A Institutional membership of the Spanish macroprudential authority (AMCESFI)
Box 3.2 Calculating the credit-to-GDP gap and financial cycle duration in Spain 84 A Credit-to-GDP gaps adapted to credit cycles lasting between 15 and 20 years B Predictive capacity of credit-to-GDP gaps adapted to credit cycles lasting between 15 and 20 years
MAIN RISKS TO THE STABILITY OF THE SPANISH FINANCIAL SECTOR
In the past six months, the risks to the stability of the Spanish financial system have increased. As in the global economy, macrofinancial risks have stepped up in Spain. This increase is the outcome, above all, of the recent global economic slowdown, particularly in Europe and China, and of the widespread increase in uncertainty. This setting might prompt increased volatility on financial markets and a rise in risk premia. And it might also trigger additional downside pressures on the profitability of the banking sector, which remains at low levels. Further, a specific risk to Spanish deposit institutions has been identified, derived from the potential increase in legal demands. Thus, the main factors of risk to the financial system identified in this Financial Stability Report (FSR) are the following (Table 1):
1 Economic slowdown and geopolitical uncertainty with a potential impact on asset prices through higher risk premia. In 2019 to date, the sources of economic and geopolitical uncertainty in place in late 2018 appear to have increased. Global trade tensions persist and negotiations to achieve new agreements are facing substantial difficulties. Indeed, the indicators of the Chinese economy are feeling the effects of the trade tensions with the United States and of China’s own macrofinancial imbalances. A significant slowdown in this economy might have major repercussions for other emerging economies that are recipients of its investment and the source of its goods and services imports. It is notable here how financial market tensions have returned in recent weeks in Turkey and Argentina, following the calm after drastic monetary and fiscal measures were adopted last year and the IMF financial assistance to Argentina. The economic recession in both countries, the low coverage of international reserves in Turkey and the scant headway in Argentina in macroeconomic stabilisation constitute their main vulnerabilities. In Europe, the risk of a disorderly Brexit has, following the European Council agreement, been put back to 31 October this year. Elsewhere, the uncertainty SOURCE: Banco de España.
a The risks which appear in this table are calibrated using four colours: green denotes an absence of risk, yellow indicates low risk, orange, medium risk, and
red, high risk. Consequently, at present the three risks are at a medium level. The time horizon for which these risks are defined is set by the FSR's frequency,
i.e. half-yearly. The arrows indicate whether risk has recently increased, held stable or diminished.
1 The global economic slowdown and, in particular, of Europe and China, combined with heightened geopolitical uncertainty, may mean a significant increase in risk premia which negatively impacts financial asset prices, both of corporate and government bonds and equities.
2 In a setting of low margins, the profitability of Spanish banks will be subject to further pressure due to the consequences of the economic slowdown.
3 Spanish deposit institutions are facing, with varying intensity, the legal risk of a potential increase in legal demands brought against them.
associated with Italy’s fiscal situation remains in place, against a background of economic recession in the second half of 2018, and the German economy has slowed significantly. In Spain, uncertainty persists over the future course of economic policies.
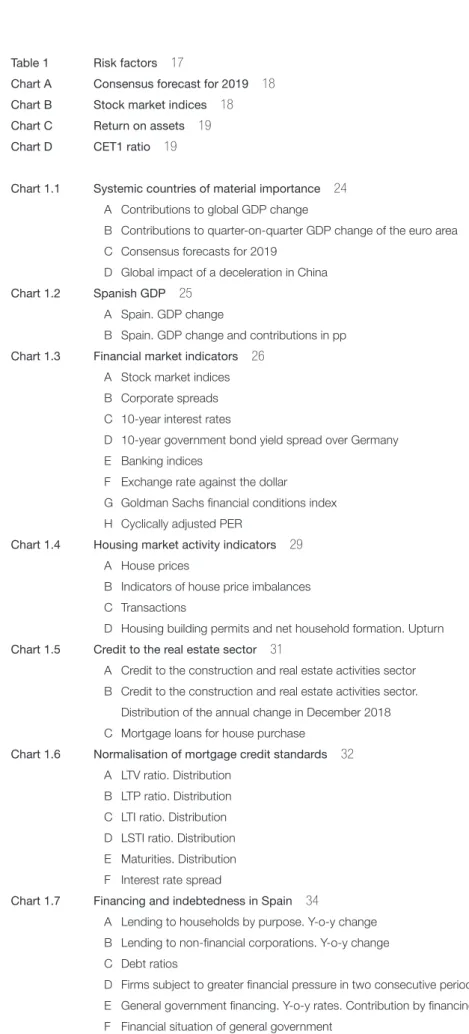
This uncertain environment is affecting global economic activity. There have been particularly marked downward revisions in GDP forecasts (Chart A) across the board in the euro area. Yet stock market valuations (Chart B) have recouped much of the downward correction they underwent in late 2018 and risk premia have held at low levels. Compared with the previous FSR, the heightening of this slowing trend in the global economy might trigger a correction, via higher risk premia, of international financial market prices, with adverse consequences for global financial conditions and those in Spain. But the likelihood of a correction associated with sharper-than-expected monetary policy normalisation is fading, since central banks are prolonging ultra-expansionary policies to bolster activity, against a background of contained inflation expectations.
2 Low margins and pressure on the profitability of Spanish financial institutions. The net consolidated income of Spanish deposit institutions grew significantly in 2018. This was largely due to the greater positive contribution of extraordinary income, and to the decline in asset impairment losses. Yet ROA remained low, though it was above the average for European banks (Chart C). Looking ahead, the expectations of a global – and in particular European – economic slowdown and the subsequent delay in the ongoing monetary policy normalisation will subject deposit institutions’ margins to greater pressure.
3 Legal risk arising from the potential increase in legal demands against deposit institutions. In recent years, the legal risk linked to legal suits affecting Spanish banks has increased significantly. Banks have been involved in a high number of legal processes, in which certain contractual conditions in their mortgage lending operations were questioned. The cost of these processes for institutions has materialised in a number of cases (e.g. in floor clauses, with more than €2.2 billion returned to customers up to January 2019), but there are still very important legal procedures pending resolution. The European Union
6.0 6.1 6.2 6.3 6.4 6.5 6.6 0.0 0.5 1.0 1.5 2.0 2.5 3.0
Jan-18 Mar-18 May-18 Jul-18 Sep-18 Nov-18 Jan-19 Mar-19 A CONSENSUS FORECAST FOR 2019
a i % % y-o-y 80 90 100 110 120 130 140 150
Jul-17 Oct-17 Jan-18 Apr-18 Jul-18 Oct-18 Jan-19 Apr-19 B STOCK MARKET INDICES
1 Jan 2017 = 100
SOURCES: Consensus and Datastream.
USA JAPAN
UNITED KINGDOM EURO AREA CHINA (right-hand scale)
S&P 500 EUROSTOXX 50 IBEX 35 MSCI EMERGING
Court of Justice (EUCJ) is expected to respond in the second half of the year to legal issues tabled in relation to the use of the mortgage loan benchmark index (IRPH by its Spanish abbreviation). Depending on how the EUCJ rules, there might be an increase in legal demands against Spanish banks. This would impact those banks with a higher volume of IRPH-linked mortgage loans, requiring them to properly measure the potential contingent impact and to take suitable management and prevention measures.
More generally, the emergence of legal risk, among other factors, has led to a loss of reputation for the banking sector, both in Spain and in other countries. Banks should strive to reverse this development by providing their customers with financial products tailored to their needs and capabilities, while supplying the pertinent information clearly and transparently. Reputation and customer confidence are essential for developing banking business.
Against this background, the Spanish economy retains some factors of vulnerability. High public and external debt means that both the general government sector and the economy as a whole are comparatively more exposed to potentially costlier funding. This is associated, for instance, with potential rises in risk premia or with adverse macroeconomic developments. Households’ financial position has tended to strengthen thanks to the reduction in their debt in recent years, and to the improvement in incomes and in employment as a result of the economic recovery. But some Spanish household segments remain in a situation of great fragility, with the household aggregate saving rate at a very low level. That is partly linked to households’ greater resort to consumer credit which, SOURCE: EBA.
a Data not published by the EBA. b EBA data include Iceland. -0.2 0.0 0.2 0.4 0.6 0.8 1.0 1.2 1.4 1.6 1.8 SI EE LV LT SK IE AT ES LU FI MT NL BE IT FR GB PT DE CY (a) GR % C RETURN ON ASSETS December 2018 0 5 10 15 20 25 30 35 EE LU LV IE LT SI MT FI BE NL DE GR GB SK FR AT CY PT IT ES EU / EEA AVERAGE (b) % D CET1 RATIO December 2018
despite having eased in recent months, continues to grow at a notable pace. The business sector has also continued reducing its levels of debt, and new loans by financial institutions are concentrated in the most productive firms. That said, some segments remain more vulnerable, specifically smaller firms and, above all, those operating in the real estate and construction sector.
Regarding the real estate sector, the recovery in activity and in prices remains ongoing. In particular, the average level of estimates of prices in the sector veering off their medium term trend has increased, moving away from the negative range but currently standing close to equilibrium values. While no easing has been seen in lending standards for new loans, their growth rate is high. It will thus be necessary to remain vigilant in this market. In any event, new loans are not yet offsetting repayments of existing loans, meaning that lending to households for house purchase will continue falling at the aggregate level. Deposit institutions continue to face the challenge of improving their levels of profitability and solvency. Indeed, the (best-quality) CET1 solvency ratio of Spanish banks fell over the past year, standing last among European jurisdictions (Chart D). That said, they announced an increase in their target capital ratios. Here, improving the statement of income is key to shoring up solvency levels, as is too the measurement of risks and their coverage through appropriate interest rates. Moreover, reducing operating costs, investing in new technologies and judiciously selecting business strategies are further factors for improving the profitability of the business in the medium and long term. Greater solvency will also contribute to meeting the MREL (Minimum Requirement for own funds and Eligible Liabilities) requirements with which Spanish banks must progressively comply in the coming years. These requirements may pose significant challenges for small and medium-sized institutions, with mainly retail funding sources and with less scope to access the wholesale funding markets.
The sensitivity of banks’ capital ratios to the individual materialisation of some of the macroeconomic risks is high, but the banking system’s aggregate solvency ratio is expected to hold at an appropriate level. As part of the stress tests and using specific elements of the Banco de España’s FLESB methodology, this FSR analyses the potential impact of the independent materialisation of various identified macrofinancial risks. In particular, there are estimates for the impact of: i) a decline in global activity, ii) a reduction in consumer and business confidence in Spain, iii) a reversal of stock market prices, and iv) a reduction in house prices. The shocks are calibrated to capture extreme situations. For the 2018-2020, period, the maximum cumulative effect of the individual materialisation of these risks on Spanish GDP growth is around 6 pp and almost 30 pp on the growth of house prices. This would translate into an impact on financial institutions’ average solvency ratio of 2 pp on average in this three-year horizon. However, it should not be forgotten that, in an adverse economic scenario, the simultaneous materialisation of several of these risks is possible.
Analysis of Spanish deposit institutions’ interrelations with the rest of the financial system shows the Spanish economy to be highly banked and evidences the limited scale of direct interconnections. Deposit institutions amass a large portion of the Spanish financial system’s assets, as is the case in the other European continental economies. However, their weight has declined since the global financial crisis, following a trend likewise seen in other jurisdictions. This has its advantages, since it enables both those supplying and demanding funds to broaden their investment and funding options, and allows risks to be better diversified. But it also poses challenges. By increasing
interconnections among financial institutions, the possibilities of contagion are duly raised. It is important to analyse and understand the sources of risks that these other actors might generate, given that they could operate through channels other than those traditional to banks. In Spain’s case, while these interconnections have increased, they remain limited. Moreover, major short-term risks have not been detected in non-bank financial institutions (investment funds, insurance companies and pension funds).
The macroprudential policy stance pursued by the Banco de España in recent months has held stable. It is evident that i) systemic risk indicators are at low levels viewed from a broad historical perspective; ii) that there is some slowdown in consumer lending; and iii) that the analysis of the individual materialisation of macroeconomic risks identified shows that such risks would exert a significant but bearable impact on the average level of institutions’ solvency. In light of this it has not been considered necessary to activate new macroprudential measures or re-calibrate those currently applicable. In particular, the countercyclical capital buffer (CCyB) holds unchanged at 0%, in keeping with the credit-to-GDP gap and other quantitative indicators of cyclical systemic risk. Nonetheless, the Banco de España is developing procedures to adapt the credit-to-GDP gap to the reality of the Spanish financial cycle and to take into account its relationship to other fundamental variables. At the same time, it will monitor other quantitative indicators and the medium-term projections for them.
1 RISKS IN THE MACROFINANCIAL ENVIRONMENT
The global economy has slowed in recent quarters, against a background of persistent trade tensions. Global GDP grew by 3.6% in 2018, 0.1 pp down on 2017 and below expectations at the start of the year. It moved on a slowing path that steepened in the closing months of the year (Chart 1.1.A). Economic activity remained more robust in the United States, although there have also been signs of some easing in growth recently. In the other advanced economies, GDP growth was also below expectations, especially in the euro area. Against this background, monetary policy in the main advanced economies is adopting a more accommodative stance. Among the emerging economies, the economic indicators in China showed signs of deceleration, to which the authorities responded with new stimulus measures. There is also less dynamism in other regions, in particular in the more vulnerable economies such as Argentina and Turkey. The announced macroeconomic stabilisation programmes in both did not succeed in preventing increased tensions in recent weeks. In the euro area, the slowdown in economic activity in 2018 was particularly sharp in the second half of the year. GDP growth, which stood at 1.8% in 2018, 0.7 pp down on 2017, slowed sharply in the final stretch of the year. This deceleration ran into early 2019 (Chart 1.1.B) and has affected most countries, in particular Germany. The downturn is in response to a lower contribution by the external sector to growth. Behind this lies the weakness, on one hand, of the member countries and, on the other, of products such as investment goods and automobiles, which are very important in respect of European specialisation. Further factors are the past appreciation of the euro, trade tensions and geopolitical uncertainty.1 Some signs suggest that this weakness in external demand has already begun to feed through to domestic demand, in particular to investment and to employment.
The outlook for the world economy in 2019 is one of a moderate slowdown, but with significant downside risks. The recent sluggishness of the global economy has given rise to a downward revision of economic forecasts, in the advanced economies – especially in the euro area – and in the emerging countries (Chart 1.1.C). In particular, the persistency of the slowdown led to a lowering of the ECB’s forecasts for 2019 and 2020 in March, to 1.1% and 1.6%, respectively, 0.6 and 0.1 pp less than forecast in December. Of note in this baseline scenario are the risks of more unfavourable than expected developments. These relate to the uncertainty of economic policy (trade policy in particular) and to the possibility of a sharper than foreseen slowdown in some systemic economies, such as China. The Chinese authorities face a dilemma as to whether to stimulate economic activity in the short term, containing the slowdown, at the expense of checking the path of correction of China’s macrofinancial imbalances and potentially increasing the risk of a sharper adjustment in the future. Given China’s growing weight in the world economy, a sharper than expected slowdown in this country might entail significant global consequences, through the trade, financial and confidence channels, and through the commodities markets (Chart 1.1.D). For the euro area, another major cause for concern is that the recession in Italy may ultimately worsen its fiscal position and Italian banks’ balance sheets. Additionally, there is a very substantial risk of a possible disorderly no-deal Brexit.2
1 For further details see Box 2,“The impact of the slowdown in world trade on euro area exports”, Quarterly report on the Spanish economy, Economic Bulletin 1/2019, Banco de España.
2 For further details see “Brexit: current situation and outlook”, Documento Ocasional No. 1905 (March 2019), Banco de España.
1.1 Macroeconomic environment 1.1.1 INTERNATIONAL
The risks in the emerging economies of most importance for Spain are also significant. In Brazil, the new government has unveiled its proposal for Social Security reform. It has been favourably received by the markets, but faces a long and arduous process before approval. There is thus a risk that public debt will continue increasing notably in the coming years. In Mexico, there is concern too on the fiscal front, owing to the situation of the state-owned oil company PEMEX, and to the downward revision of the growth outlook for the economy. This has led several rating agencies to place the outlook for Mexican public debt in negative territory. Moreover, uncertainty persists over the performance of the external sector, since the USMCA treaty that is to replace NAFTA has still to be approved in the US, Mexican and Canadian legislative branches. Lastly, Argentina and Turkey continue their slow process of adjustment, with risks both in the external environment, essentially associated with the possible appreciation of the dollar, and on the domestic front. In particular, in Turkey, there is a risk that the recently implemented monetary and fiscal policies will be eased. And in Argentina, the presidential elections scheduled for late 2019 The world economy is continuing to slow down, against a backdrop of significant risks to growth and downward revisions of economic forecasts. The increase in protectionist tensions, the possibility of a disorderly no-deal Brexit, an adjustment in financial markets or a sharper deceleration of the Chinese economy could have a severe impact on global activity.
SYSTEMIC COUNTRIES OF MATERIAL IMPORTANCE CHART 1.1
6.0 6.1 6.2 6.3 6.4 6.5 6.6 0.0 0.5 1.0 1.5 2.0 2.5 3.0
Jan-18 Mar-18 May-18 Jul-18 Sep-18 Nov-18 Jan-19 Mar-19 C CONSENSUS FORECASTS FOR 2019
% y-o-y % y-o-y -0.5 0.0 0.5 1.0 1.5 2.0 2.5 3.0 3.5 4.0 4.5 2014 2015 2016 2017 2018
A CONTRIBUTIONS TO GLOBAL GDP CHANGE pp -1.6 -1.4 -1.2 -1.0 -0.8 -0.6 -0.4 -0.2 0.0 0.2 USA Euro
area RU JPN ARG BRA CHL MEX IND IDN KOR VNM D GLOBAL IMPACT OF A DECELERATION IN CHINA (a)
% -0.4 -0.2 0.0 0.2 0.4 0.6 0.8 8 1 0 2 7 1 0 2
B CONTRIBUTIONS TO QUARTER-ON-QUARTER GDP CHANGE OF THE EURO AREA
%
SOURCES: IMF, Eurostat, Consensus, IFS.
a Simulations using NiGEM. Impact on GDP growth in year one of a fall of 1 pp in potential growth and in domestic demand in China, which entails a decline of 7% in oil prices, of 8% in metal prices and adverse effects on global financial markets (correction of 10% in the stock markets of China, Europe, Japan and USA; increase of 50 bp in share risk premium; and increase of 60 bp in long-term interest rates of emerging economies).
DEVELOPED LATAM (EXCL. VENEZUELA)
EMERGING ASIA EMERGING EUROPE
OTHER EMERGING ECONOMIES GLOBAL
DOMESTIC DEMAND EXTERNAL DEMAND GDP
USA JAPAN UNITED KINGDOM
EURO AREA CHINA (right-hand scale)
FINANCIAL CHANNEL COMMODITY PRICES CHANNEL
might raise doubts over the country’s future economic policy stance and prompt fresh turbulence on the markets that will hamper the macroeconomic adjustment.
In the final stretch of 2018, the Spanish economy retained its expansionary inertia, which is estimated to have run into the opening months of 2019. On Banco de España estimates, GDP is expected to have increased by 0.6% in quarter-on-quarter terms in 2019 Q1 (Chart 1.2.A), and by 2.4% year-on-year. As in 2018, this dynamism was mainly underpinned by robust domestic demand, while exports slowed significantly, reflecting the downturn in the external environment (Chart 1.2.B). Employment continued to increase in step with the growth in activity. This was conducive to a fresh decline in the unemployment rate, although it is also moving on a slowing path.
The short and medium-term outlook is for a continuation of growth, albeit at somewhat lower rates and with downside risks. The Banco de España’s latest macroeconomic projections, published in March, envisage the continuation of the expansionary phase over the 2019-2021 period, but with GDP gradually slowing (Chart 1.2.A).3 Conditioning this baseline scenario are domestic as well as external risks. Should these materialise, they might translate into a more unfavourable course of economic activity. The risks include most notably those associated with the still-indefinite short and medium-term fiscal policy path and, generally, the future economic policy stance.
The closing months of 2018 saw an increase in investor risk aversion on global financial markets. As a result of this, there were across-the-board declines in share prices and increases in credit risk premia (Charts 1.3.A and 1.3.B), rises in volatility and cuts in the yields on top-quality long-term sovereign debt, which acted as a safe haven (Chart 1.3.C). Several factors prompted these developments: the publication of macroeconomic indicators which on the whole disappointed market expectations; the pessimism surrounding US/ China trade negotiations; and a US Federal Reserve monetary policy that was less accommodative than expected by the market.
3 For further details see Box 1, “Macroeconomic projections for Spain” Quarterly report on the Spanish economy,
Economic Bulletin 1/2019, Banco de España. 1.1.2 SPAIN
1.2 Financial markets and real estate sector
1.2.1 FINANCIAL MARKETS
The upturn over the period 2019-2021 is projected to continue, albeit with a gradually slowing profile and downside risks. The buoyancy of GDP is estimated to have been underpinned by robust domestic demand, whereas exports are estimated to have slowed significantly.
SOURCES: INE and Banco de España.
-4 -3 -2 -1 0 1 2 3 4 5 11 12 13 14 15 16 17 18 19 20 21
OBSERVED QUARTER-ON-QUARTER OBSERVED YEAR-ON-YEAR BE FORECAST MARCH 2019 % A SPAIN. GDP CHANGE -6 -4 -2 0 2 4 6 11 12 13 14 15 16 17 18
EXPORTS DOMESTIC DEMAND
IMPORTS GDP
%
B SPAIN. GDP CHANGE AND CONTRIBUTIONS IN PP
Following the bout of instability on global financial markets at end-2018, market indicators have recovered notably in the opening months of 2019 coinciding with the more accommodative stance of the main central banks, among other factors. The financial conditions in the main economies have tightened compared with the situation at the cut-off date of the previous FSR, but they remain lax, as suggested by the stock market rally, the fall in sovereign debt yields, lower corporate spreads and the relative stability of the dollar.
FINANCIAL MARKET INDICATORS CHART 1.3
200 300 400 500 600
Jul-17 Oct-17 Jan-18 Apr-18 Jul-18 Oct-18 Jan-19 Apr-19 B CORPORATE SPREADS bp -0.5 0.0 0.5 1.0 1.5 2.0 2.5 3.0 3.5
Jul-17 Oct-17 Jan-18 Apr-18 Jul-18 Oct-18 Jan-19 Apr-19 C 10-YEAR INTEREST RATES
% 95 100 105 110 115 120
Jul-17 Oct-17 Jan-18 Apr-18 Jul-18 Oct-18 Jan-19 Apr-19 F EXCHANGE RATE AGAINST THE DOLLAR (d)
1 Jan 2017 = 100 80 90 100 110 120 130 140 150
Jul-17 Oct-17 Jan-18 Apr-18 Jul-18 Oct-18 Jan-19 Apr-19 A STOCK MARKET INDICES
1 Jan 2017= 100 60 70 80 90 100 110 120 130 140
Jul-17 Oct-17 Jan-18 Apr-18 Jul-18 Oct-18 Jan-19 Apr-19 E BANKING INDICES 1 Jan2017 = 100 97 98 99 100 101 102 103 104 105
Jan-06 Jan-08 Jan-10 Jan-12 Jan-14 Jan-16 Jan-18 G GOLDMAN SACHS FINANCIAL CONDITIONS INDEX
% 0 50 100 150 200 250 300 350
Jul-17 Oct-17 Jan-18 Apr-18 Jul-18 Oct-18 Jan-19 Apr-19 D 10-YEAR GOVERNMENT BOND YIELD SPREAD OVER GERMANY
bp 0 5 10 15 20 25 30 35 06 07 08 09 10 11 12 13 14 15 16 17 18 19 %
H CYCLICALLY ADJUSTED PER (e)
HIGH-YIELD BOND. USA (a) HISTORICAL AVERAGE 2005-2019 HIGH-YIELD BOND. GERMANY (b) HISTORICAL AVERAGE 2005-2019 CEMBI GLOBAL DIVERSIFIED (c)
S&P 500 EUROSTOXX 50 IBEX 35 MSCI EMERGING
USA UNITED KINGDOM JAPAN GERMANY SPAIN ITALY FRANCE
EURO STERLING YEN EMERGING
S&P 500 EUROSTOXX IGBM
SOURCES: Robert J. Shiller, Datastream, JP Morgan and Bloomberg.
a Corporate bond spread: "B"-graded Merril Lynch bond over the US ten-year Treasury bond. b Spread of Itraxx Crossover Europe over the German ten-year government bond.
c The CEMBI (Corporate Emerging Markets Bond Index) Broad Diversified is an index prepared by JP Morgan. It measures the corporate risk of the group of emerging countries and represents the spread of emerging countries' corporate debt yield in dollars over US corporate debt yield.
d Values higher than 100 denote depreciations of the dollar relative to 1 January 2017.
e The cyclically adjusted PER is calculated as the ratio of share prices to the ten-year moving average of profits.
USA EURO AREA UNITED KINGDOM JAPAN SPAIN EURO AREA
USA HISTORICAL AVERAGE 1997-2019
Since the start of the year, the recovery on the financial markets has generally been notable. Global growth forecasts were admittedly revised downwards. But the more accommodative stance adopted by the US Federal Reserve in the final weeks of 2018 has meant that markets are currently not discounting any rise in benchmark interest rates in the US economy in 2019. Indeed, markets even anticipate a possible cut. That, together with greater optimism over the possibility of a US/China trade agreement, has prompted across-the-board stock market gains and the appreciation of other risky assets in early 2019. The measures implemented by China to counter the slowdown in its economy and some positive surprises in US corporate results also contributed to this pick-up on the markets. The ECB has also adopted a more accommodative monetary policy stance. In March, the ECB Governing Council extended the minimum time horizon over which it expects to maintain its policy interest rates at their current levels (“at least until the end of 2019”). That prompted a further delay in market expectations about the date of the first rate rise in the region.4 The Governing Council also agreed to launch a series of quarterly targeted long-term refinancing operations (TLTRO-III) commencing September 2019, with the intention of maintaining favourable financing conditions and fluid monetary policy transmission. Against this backdrop, bank and several sovereign debt risk premia have fallen on euro area financial markets in 2019 to date. And, at the same time, stock market prices have partly recouped the losses in the final stretch of 2018. In Spain and Portugal, the risk premium on long-term sovereign debt vis-à-vis Germany has fallen by around 10 bp and 30 bp, respectively, since the start of the year. In Italy, after reaching a budgetary agreement with the European Commission and despite the fact the economy has gone into technical recession, this spread – which was highly volatile in late 2018 – has held relatively stable in 2019. Currently, it stands around 60 bp below its autumn peak (Chart 1.3.D). European banks’ risk premia also fell. Euro area and Spanish bank share prices have recovered since the start of the year, though to a lesser extent than those of US banks. They have also shown greater sensitivity to unfavourable news, as could be seen in February following the release of 2018 results (Chart 1.3.E). In any event, the EuroStoxx banks index on European bourses and on the Madrid Stock Exchange stand over 20% below their levels at the onset of 2018.
Overall, financial conditions in the main world economies have tightened somewhat compared with the cut-off date for the previous FSR, but they remain easy. Since early 2019, the stock market pick-up, the decline in sovereign debt yields and the relative stability of the US dollar, following its continued strengthening over much of 2018 (Chart 1.3.F), have contributed to easing global financial conditions. These conditions remain easy in historical terms, despite tightening during the final stretch of 2018 (Chart 1.3.G).
The materialisation of some of the risks to global economic growth indicated in the previous section might trigger a correction in financial asset prices. This possible correction might primarily affect those markets showing greater vulnerabilities (cases in point being the leveraged loans and CLOs markets) or higher valuations, such as the US stock market (Chart 1.3.H) and the high-yield corporate debt segment (Chart 1.3.B). From this perspective, it cannot be ruled out that this potential realignment of prices might lead to accelerated asset sell-offs, with potentially disruptive effects on markets.
4 For further details see Box 4, “Market expectations about the euro area benchmark interest rate” Quarterly report on the Spanish economy, Economic Bulletin 1/2019, Banco de España.
This potential correction of financial asset prices would adversely affect financial stability in Spain through various channels. First, it would entail a tightening of financing conditions across various sectors, whose effect on the Spanish economy would be significant given its high external indebtedness. Further, the loss of value of assets might unfavourably affect financial intermediaries through two channels: directly, by affecting the market value of the traded assets held in their portfolios; and indirectly, by reducing household and corporate wealth, which would adjust their spending and investment decisions downwards, thereby amplifying the recent downturn in the macroeconomic environment and impairing the credit quality of banks’ loan portfolios.
The real estate market has prolonged the recovery it embarked upon in 2014. The recent buoyancy of this market would, inter alia, be a reflection of favourable labour market developments and of highly favourable borrowing conditions for house purchases by households. Since 2013, there has been a slow but progressive absorption of the housing overhang that built up after the crisis (to below 500,000 units at present). A further consequence has been relatively high growth rates in house prices (6.6% year-on-year in 2018 Q4). Overall, average house prices have grown 22% in real terms from their trough in early 2014. That said, they remain 31% below their 2007 Q3 peak (Chart 1.4.A).5 The indicators and models available, based on aggregate data and subject to high uncertainty, do not show generalised signs of overvaluation. Yet, as can be seen in Chart 1.4.B, some indicators suggest that house prices are now, on average, very close to their long-term equilibrium value, after having stood significantly below this level during the previous years.
Despite the sector’s buoyancy, the levels of the main indicators of real estate activity are lower than those observed in the years in the run-up to the crisis. For example, the volume of housing transactions stood above 550,000 in 2018, marking a significant recovery from its floor. That said, this remains far below the 885,000 transactions recorded on average in the 2004-2007 period (Chart 1.4.C). The current supply of new housing, proxied by the number of building permits, accounted last year for little more than 10% of the pre-crisis peak. The diminished dynamism of supply in the current cycle compared with the previous expansion would be due, among other factors, to banks applying a more prudent lending policy to the construction and real estate development sector, to the existence of a high stock of unsold houses and to much more moderate growth in new household formation (95,000 in 2018, compared with an annual average increase of 435,000 in the 2004-2007 period). It is worth highlighting with regard to this latter determinant that, although in the final years of the previous expansionary cycle the supply of housing grew more sharply than new household formation, in the current cycle the dynamics of the two series are more closely in step (Chart 1.4.D). That suggests fundamentals have been more supportive of the recent growth in the sector.
This recovering trend in real estate market activity and prices shows high geographical heterogeneity. While the recovery is practically across the board in Spain, there are notable regional disparities, in terms both of transactions and prices. The biggest increases have been in the major cities and in coastal areas. There, activity is more dynamic, and the thrust of foreign demand is greater and the population more concentrated.
5 For further details on the real estate sector in Spain, see the Banco de España Analytical Article “Recent housing market developments in Spain”, by P. Alves and A. Urtasun (May 2019).
1.2.2 THE REAL ESTATE MARKET IN SPAIN
As with purchase prices, rental income has also increased significantly in the recent period and shown high geographical heterogeneity.6The momentum of rental income
has been against a background of rising demand for this service, which is particularly marked in the youngest population segment.7 The greater propensity to rent might be due to various factors. These include the impact of the crisis on this segment, changes in preferences linked to sociological factors and the adoption of measures that have brought the tax treatment of rental and owner-occupancy housing onto a more equal footing and have promoted the supply of rental housing, although some of these have recently been reversed.
6 On information from the Idealista real estate portal.
7 See the Banco de España Analytical Article ”Evolución reciente del mercado del alquiler en España”, by L. Matea and D. López (April 2019).
SOURCES: ECB, Eurostat, INE and Ministerio de Fomento.
a Latest observation: 2018 Q4 (house prices), December (housing approvals) and 2018 Q4 (house purchases). Real house prices are deflated using the consumer price index.
b The five indicators include three gaps calculated as the difference between the value of the interest variable in each period and its long-term trend for: (i) house prices in real terms, (ii) the house prices-to-household-disposable-income ratio and (iii) the house prices-to-rent ratio. Two additional imbalance indicators are included for the house price variable in real terms based on econometric models. The first, which is estimated by Ordinary Least Squares (OLS), compares this variable with long-term trend estimations of household disposable income and mortgage interest rates. A second model, an Error Correction Model (ECM) compares this variable and the long-term equilibrium relationship between household disposable income, mortgage interest rates and fiscal effects. In all cases, long term trends are obtained using a one-tailed Hodrick-Prescott filter with a smoothing parameter equal to 400,000.
Real estate market indicators have continued to pick up, although their levels are lower than in the years immediately prior to the crisis. Supply is less buoyant than in the previous upturn, reflecting a more prudent lending policy, an overhang of unsold housing and much more moderate growth in new household formation.
CHART 1.4 HOUSING MARKET ACTIVITY INDICATORS (a)
30 40 50 60 70 80 90 100 99 00 01 02 03 04 05 06 07 08 09 10 11 12 13 14 15 16 17 18 NOMINAL HOUSE PRICES REAL HOUSE PRICES
A HOUSE PRICES Peak 2007 Q3 = 100 0 10 20 30 40 50 60 70 80 90 100 110 99 00 01 02 03 04 05 06 07 08 09 10 11 12 HOUSE PURCHASES EXISTING HOUSING PURCHASES NEW HOUSE PURCHASES
Peak (2006-2007). Four-quarter moving average = 100 C TRANSACTIONS 0 50 100 150 200 250 99 00 01 02 03 04 05 06 07 08 09 10 11 12 13 14 15 16 17 18 NEW BUILDING APPROVALS NET HOUSEHOLD FORMATION 000s. Four-quarter moving average
D HOUSING BUILDING PERMITS AND NET HOUSEHOLD FORMATION. UPTURN -50 -40 -30 -20 -10 0 10 20 30 40 50 99 00 01 02 03 04 05 06 07 08 09 10 11 12 13 14 15 16 17 18 HOUSE PRICE GAP PRICE-TO-INCOME RATIO GAP PRICE-TO-RENT RATIO GAP PRICE IMBALANCE MODEL (OLS) PRICE IMBALANCE MODEL (ECM)
B INDICATORS OF HOUSE PRICE IMBALANCES (b) pp
It appears necessary here to have a homogenous indicator of new rental prices. Renting as a means of covering the demand for residential services is gaining weight in Spanish society, and the information available is not as rich as that for owner-occupied housing. In particular, rental prices can provide key information for the analysis of financial stability. First, they can act as leading indicators of pressures in the demand or supply of residential services that may potentially feed through ultimately to house prices. Further, renting is one of the components of the return on housing, meaning it can be useful for determining the equilibrium level of house prices. Yet to date there is no official statistic on new rental prices for the Spanish economy as a whole and for its different regions and cities that can be used to this end.
Despite the growing dynamism observed in the sector, the contracting path of the outstanding balance of bank lending to development and construction activities has continued in recent months. The total outstanding balance of bank lending to construction and development companies declined by 18.6% in 2018, somewhat up on the previous year. This was essentially due to the high volume of repayments and to the sale of loan portfolios by credit institutions (Chart 1.5.A). In any event, these aggregate data mask high heterogeneity. In particular, Chart 1.5.B reveals that some institutions’ credit exposure to the sector increased last year.
Conversely, mortgage financing to households has been more dynamic. New
mortgage loans for house purchase increased by 17.1% in 2018, firming the recovery initiated some years back. Although the generation of new lending business is still far off the pre-crisis levels, it is already almost sufficient to offset the repayment of outstanding mortgage debt. As a result, the outstanding balance of household mortgages practically stabilised, following the successive fall-offs observed since the start of the crisis (Chart 1.5.C).
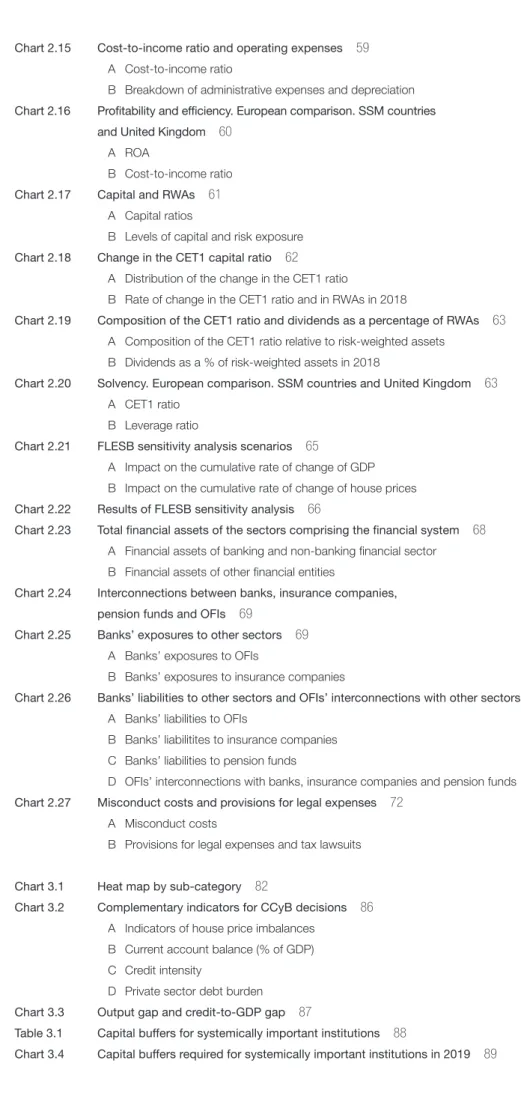
It is estimated that the conditions of access to mortgage lending8 have tended to ease in recent years but, after the tightening observed during the crisis, current conditions are stricter than they were before 2008. The proportion of high-risk mortgages, measured as those with an LTV (loan-to-value) ratio of over 80%, has held relatively stable over the past 14 years (Chart 1.6.A). But other indicators point to stricter lending conditions now than prior to 2008.9 This is the case of the LTP (loan-to-price) ratio, which shows a notable loss of weight of mortgage loans with a ratio above 80% (Chart 1.6.B), but also of the LTI (loan-to-borrower’s income) ratio (Chart 1.6.C) and of the ratio of loan service (interest plus principal) to borrower’s income (LSTI, Chart 1.6.D), whose distributions have shifted towards lower values. In recent years, there has also been a loss of weight in
8 The indicators used to analyse lending standards in mortgages are as follows: (i) Loan-to-Value (LTV): ratio of the mortgage loan capital to the property rated value; (ii) Loan-to-Price(LTP): ratio of the mortgage loan capital to the property transaction price in the property registry; (iii) Loan-to-Income (LTI): ratio of the mortgage loan capital to the borrower’s annual income; (iv) Loan Service-to-Income (LSTI): ratio of the first mortgage loan instalment (annualised) to the borrower’s annual income; (v) Term: maturity of the operation; and (vi) Interest rate spread: spread between the mortgage interest rate and that of a benchmark interest rate. For greater details on the construction of the LTV and LTP ratios and the changes therein, see the Analytical Article “The loan-to-value ratio for housing in Spain over the period 2004-2016”. Economic Bulletin 1/2019, Banco de España.
9 The information used in the panels of Chart 1.6 is from the Spanish Colegio de Registradores (Association of Registrars), supplemented with data from the European DataWarehouse (EDW), on the characteristics of securitised loans. The Spanish Association of Registrars provides itemised mortgage loan information on all operations recorded in Spanish property registries. The EDW, for its part, is a repository of bank securitisations, which compiles data on each mortgage loan backing the issuance of these instruments. While the representativeness of this database is much less than that of the Association of Registrars, particularly for after the crisis, the EDW allows a granular (credit by credit) analysis of certain mortgage characteristics, such as the income of borrowers, which is lacking in the Association of Registrars data.
mortgages at over 30 years (Chart 1.6.E). Although these interest rates spreads and the dispersion thereof across mortgages have recently narrowed (Chart 1.6.F), these indicators reveal more demanding lending conditions than those observed at the end of the last expansionary cycle. Specifically, the greater dispersion of interest-rate spreads across mortgages compared with the 2006 lows suggests that in the recent period there may have been greater discrimination among operations, whereby those perceived as riskier would pay a comparatively higher premium than less risky operations.
The new real estate credit agreements law, which will come into force in June, should be conducive to a decline in the current litigiousness in this market. The result should improve market functioning, though it might give rise to some tightening of the conditions applied. The entry into force of the new mortgage lending law will increase the legal security of these agreements, while strengthening their transparency and customer safeguards. Moreover, the introduction of stricter requirements for assessing borrower solvency should contribute to reducing credit risk in mortgage operations. From the SOURCE: Banco de España.
a The panels refer to the oustanding credit in the construction (including development) and real estate activities sector.
b The panel shows the density function (or frequency distribution) of the year-on-year rates of change in credit in 2018, weighted by the credit corresponding to each deposit institution. This density function is approximated through a kernel estimator which allows a non-parametric estimate of the density function, yielding a continuous and smoothed graphical representation of that function.
c New lending volumes in 2014 relate to the twelve-month period from April 2014 to March 2015, since the 2014 data are not available from January. Total credit in 2014 is taken as the March 2015 figure to make it consistent with the new lending volumes.
Outstanding credit to developers and builders fell sharply, although developments in credit to this sector are highly heterogeneous. New mortgage loans to households have been growing at a sustained rate. The outstanding amount of this type of credit is beginning to stabilise.
CHART 1.5
-50 -45 -40 -35 -30 -25 -20 -15 -10 -5 0 5 10 15 20 25 30 35 40 45 50 B CREDIT TO THE CONSTRUCTION AND REAL ESTATE ACTIVITIES SECTOR.
DISTRIBUTION OF THE ANNUAL CHANGE IN DECEMBER 2018 (a) (b)
% 0 50 100 150 200 250 300 350 2012 2013 2014 2015 2016 2017 2018
A CREDIT TO THE CONSTRUCTION AND REAL ESTATE ACTIVITIES SECTOR (a) €bn 0 5 10 15 20 25 30 35 0 100 200 300 400 500 600 700 2002 2003 2004 2005 2006 2007 2008 2009 2010 2011 2012 2013 2014 2015 2016 2017 2018
NEW LOANS (FLOW) TOTAL LOANS (YEAR-END BALANCE) % NEW LOANS/TOTAL LOANS (right-hand scale)
€bn %
C MORTGAGE LOANS FOR HOUSE PURCHASE (c) CREDIT TO THE REAL ESTATE SECTOR
The proportion of loans with a high LTV (of more than 80%) remained stable. As for the LTP ratio, the weight of loans with a ratio of between 80% and 100% has increased (to the detriment of the weight of the segments above and below these values). The ratios which assess the ability to repay mortgages (the LTI and LSTI ratios) are estimated to be far off their pre-crisis levels (an improvement in credit standards). Furthermore, the weight of very long-term loans in mortgage financing remains low, whereas the interest rate spreads on mortgages are beginning to stabilise following a narrowing in recent years.
SOURCES: Colegio de Registradores and European DataWarehouse.
a Loans with housing as collateral and an individual as the borrower are included. The principal of the loans is accumulated (per period) in the distributions in order to define each segment within the distribution. In this chart the following abbreviations are used: LTV (loan to value), LTP (loan to price), LTI (loan to income) and LSTI (loan service to income).
b The denominator includes the annual income of the main borrower both in the LTI and the LSTI ratios.
c The mortgage repayment (numerator in the LSTI ratio) or the first monthly payment of the mortgage is annualised. It is calculated assuming that payments are constant over the life of the loan.
d Spread of forward interest swap rates. The base curve is that of the euro interest rate swap. The reference period is one year for floating rate mortgages and coincides with the maturity of the fixed-rate loans.
CHART 1.6 0 10 20 30 40 50 60 70 80 90 100 2004 2006 2008 2010 2012 2014 2016 2018 UP TO 80% HIGHER THAN 80% A LTV RATIO. DISTRIBUTION % 0 10 20 30 40 50 60 70 80 90 100 2004 2006 2008 2010 2012 2014 2016 2018 UP TO 80% 80-100% HIGHER THAN 100% B LTP RATIO. DISTRIBUTION % 0 10 20 30 40 50 60 70 80 90 100 2004 2006 2008 2010 2012 2014 2016 2018
≤ 20 YEARS 20-25 YEARS 25-30 YEARS
30-35 YEARS > 35 YEARS E MATURITIES. DISTRIBUTION 0 2 4 6 8 10 12 14 16 18 20 1 3 5 7 9 11 13 15 %
C LTI RATIO. DISTRIBUTION (b)
0 5 10 15 20 25 5 15 25 35 45 55 65 75
D LSTI RATIO. DISTRIBUTION (b) (c)
% NORMALISATION OF MORTGAGE CREDIT STANDARDS (a)
0 100 200 300 400 500 600 2004 2006 2008 2010 2012 2014 2016 2018
MEDIAN FIRST QUARTILE THIRD QUARTILE bp
F INTEREST RATE SPREAD (d)
%
standpoint of borrowers, the new regulations increase their protection, but they might also entail some tightening of the conditions applied, especially in the case of the segments with a higher risk profile.10
Overall, new lending to the non-financial private sector continued to expand in most segments, albeit at lower rates than in the first half of the year. According to the Bank Lending Survey, this slowdown might be due both to demand-side and, to a lesser extent, supply-side factors. However, after years of easing, these financing conditions remain easy. Bank funding and bond-issuing costs remain at historically low levels, without having undergone major changes in recent months.
This fomented the recovery in the net flow of financing extended to households, which has turned positive since June 2018, in cumulative 12-month terms, for the first time since December 2010 (Chart 1.7.A). Specifically, the financing of this sector showed a year-on-year growth rate of 0.4% in February 2019. This increase is due to the dynamism of consumer credit which, though it has slowed, continues to grow at double-digit rates, offsetting the slight contraction in the stock of financing for house purchase. Box 1.1 analyses the factors behind the recent developments in this portfolio, subject to specific monitoring by the Banco de España.
The cyclical upturn continued contributing to strengthening households’ financial position. Household gross disposable income notably increased by 3.2% in 2018, boosted by the increase in employment and the rise in wages. Net household wealth continued to recover, underpinned by the increase in real estate asset prices. Household debt also fell as a percentage of GDP (Chart 1.7.C). Specifically, it declined by 2.2 pp on a year earlier to 58.9% (scarcely 1.3 pp above the euro area average). Combined with the low cost of debt, these developments have led the debt burden to continue falling in recent months, albeit very slightly, and to stand at relatively low levels from a historical perspective. However, the household saving rate is at a historical low. Despite the increase in gross household income, the marked growth in household consumption in recent years has prompted a persistent decline in the saving rate to 4.9% of gross disposable income at end-2018 (compared with the low of 5.8% in 2018 in the previous upturn). Such dynamics do not only entail risk as regards the continuity of the robustness observed in consumption, but also with respect to the financial resilience of households in the face of unexpected shocks.
Moreover, this aggregate view masks high heterogeneity. The disaggregated
information available shows high heterogeneity of households’ financial situation. In particular, those that are most vulnerable in the population are the low-income segments. For these groups, the ratio of debt service (including principal repayment and interest) to gross household income is substantially higher than for other households with debt (Chart 1.8.A and B). Specifically, the mortgage debt burden stood in 2017 (the latest available information) at over 50% of income in the decile that includes the lowest incomes, whereas it was around 10% in that of the highest incomes. The outstanding balance of consumer credit accounted in 2018 for 16% of the annual disposable income of households in postcodes in the lowest income distribution quintile, compared with approximately 8% in the case of households in higher-income postcodes.
10 For further details see Box 5 “The law regulating real estate credit agreements”, Economic Bulletin 1/2019, Banco de España.
1.3 The non-financial sectors
SOURCES: Datastream, INE and Banco de España.
a The firms bearing a high degree of financial pressure are those for which the ratio (gross operating profit + financial revenue/ financial costs) is less than one. b Four-quarter cumulative data.
Lending to the non-financial private sector has continued its recovery and even posted positive growth rates in the second half of 2018. At the same time, debt ratios have continued their fall, prompting a fresh strengthening of households' and companies' financial positions. The structural budget deficit has not decreased in recent years and, consequently, the subdued decline in the general government debt ratio was due to the cyclical component and GDP growth, which represents a significant risk for the Spanish economy should the economic cycle change.
40 50 60 70 80 90 100 110 120 00 01 02 03 04 05 06 07 08 09 10 11 12 13 14 15 16 17 18 HOUSEHOLDS. SPAIN
NON-FINANCIAL CORPORATIONS. SPAIN HOUSEHOLDS. EURO AREA
NON-FINANCIAL CORPORATIONS. EURO AREA C DEBT RATIOS
% of GDP
FINANCING AND INDEBTEDNESS IN SPAIN CHART 1.7
-4 -2 0 2 4 6 8 2015 2016 2017 2018 2019
SHORT-TERM SECURITIES LONG-TERM SECURITIES
LENDING AND OTHER TOTAL
E GENERAL GOVERNMENT FINANCING. Y-O-Y RATES. CONTRIBUTION BY FINANCING INSTRUMENT % 0 10 20 30 40 50 2008 2009 2010 2011 2012 2013 2014 2015 2016 2017 TOTAL LARGE SMEs
CONSTRUCTION AND REAL ESTATE ACTIVITIES OTHER SECTORS
D FIRMS SUBJECT TO GREATER FINANCIAL PRESSURE IN TWO CONSECUTIVE PERIODS (a) % of debt -10 -5 0 5 10 15 20 2015 2016 2017 2018 2019
OVERALL BANK LENDING HOUSE PURCHASE
CONSUMPTION OTHER
A LENDING TO HOUSEHOLDS BY PURPOSE. Y-O-Y CHANGE % -10 -5 0 5 10 15 20 2015 2016 2017 2018 2019 OVERALL LENDING
LENDING OF RESIDENT CREDIT INSTITUTIONS AND SLIs DEBT SECURITIES
B LENDING TO NON-FINANCIAL CORPORATIONS. Y-O-Y CHANGE % 30 40 50 60 70 80 90 100 110 -4 -2 0 2 4 6 8 10 12 00 01 02 03 04 05 06 07 08 09 10 11 12 13 14 15 16 17 18 BUDGET DEFICIT (b) DEBT RATIO (right-hand scale) % of GDP
F FINANCIAL SITUATION OF GENERAL GOVERNMENT
This box analyses in greater detail some determinants of the behaviour of the consumer credit portfolio of Spanish deposit institutions. In particular, the size of this portfolio has expanded and the volume of NPLs increased since 2015, developments that have been closely linked to the expansionary behaviour of the segment of credit for the purchase of consumer durables. Specifically, over the last three years, consumer credit extended by deposit institutions and specialised lending institutions (SLIs) in Spain has grown by some €30 billion, increasing from somewhat more than €60 billion in December 2015 to almost €90 billion in December 2018 (i.e. growth of more than 40%). Credit for the acquisition of consumer durables has been the main driver of this growth, with year-on-year growth rates of close to or above 20% since late 2016. However, this growth slowed in the second half of 2018 (14.8% in December 2018, see Chart A). As regards the NPLs in this segment, they began to increase in 2017, reaching growth rates of around 20% by mid-2018, although their growth edged down in the second half of the year, to 18.4% in December 2018 (see Chart B).
One factor that has contributed to the growth of credit mentioned above is the behaviour of SLls. SLIs are a group of institutions that are not able to take deposits and that tend to grant credit in specific
business segments (consumer credit, mortgage credit, cards, guarantees, etc.). In December 2018, this group of institutions accounted for 4.3% of total credit to the resident private sector. In the case of households, SLIs accounted for 5.6% of all credit granted as at that date. However, the sectoral composition of the credit granted to households by SLIs has been changing in recent years, with the proportion of consumer credit rising, to the detriment of credit for house purchase. Thus, in December 2018, 67% of the credit extended to households by SLIs was for the purpose of acquisition of consumer goods. This reflects the contrasting behaviour of the credit granted by these institutions for house purchase (with negative rates of change in recent years) and for consumption, with year-on-year growth rates of well above 10% since 2014.
The relationship between the consumption of durable goods and disposable income enables us to obtain an indicator of the possible existence of restrictions on lending for the consumption of this type of goods. This is because one would expect the correlation between consumption and disposable income to be lower (higher), the smaller (larger) the percentage of restricted agents. Chart C shows the estimation for different periods of the parameter associated with disposable income in a regression model that relates this variable to the aggregate consumption series. The estimates for pre-crisis
BOX 1.1
DETERMINANTS OF THE BEHAVIOUR OF THE CONSUMER CREDIT PORTFOLIO
SOURCE: Banco de España. -5 0 5 10 15 20 25 30 35
Sep-15 Mar-16 Sep-16 Mar-17 Sep-17 Mar-18 Sep-18
% Chart A
YEAR-ON-YEAR RATE OF CHANGE OF CONSUMER CREDIT AND ITS COMPONENTS
Deposit-taking institutions and specialised lending institutions
-30 -20 -10 0 10 20 30
Sep-15 Mar-16 Sep-16 Mar-17 Sep-17 Mar-18 Sep-18 %
Chart B
YEAR-ON-YEAR RATE OF CHANGE OF NON-PERFORMING CONSUMER CREDIT AND ITS COMPONENTS
Deposit-taking institutions and specialised lending institutions
PURCHASE OF CONSUMER DURABLES PURCHASE OF OTHER GOODS AND SERVICES CONSUMER CREDIT
SOURCES: Banco de España and INE.
a The chart divides y-o-y growth (measured for each quarter) into two portions which relate to supply and demand factors. The breakdown is based on an SVAR model of the credit growth and interest rate series relating to credit for durable consumption.
-30 -20 -10 0 10 20 30
Jun-04 Jun-06 Jun-08 Jun-10 Jun-12 Jun-14 Jun-16 Jun-18 DEMAND SUPPLY CUMULATIVE Y-O-Y RATE Chart D
BREAKDOWN OF CONSUMER CREDIT SUPPLY AND DEMAND FACTORS. (a)
-2.0 -1.5 -1.0 -0.5 0.0 0.5 1.0 1.5 2.0 2.5 3.0
Dec-03 Dec-05 Dec-07 Dec-09 Dec-11 Dec-13 Dec-15 Dec-17 Chart C
RELATIONSHIP BETWEEN DURABLE GOOD CONSUMPTION AND DISPOSABLE INCOME