ScholarlyCommons
Finance Papers
Wharton Faculty Research
7-25-2013
Corporate Restructuring
B. Espen Eckbo
Tuck School of Business
Karin S. Thorburn
Follow this and additional works at:
http://repository.upenn.edu/fnce_papers
Part of the
Corporate Finance Commons
,
Finance Commons
, and the
Finance and Financial
Management Commons
author Karin S. Thorburn is affiliated with the Norwegian School of Economics, Norway. She is also a visiting faculty member in the Finance Department of the Wharton School at the University of Pennsylvania.
This paper is posted at ScholarlyCommons.http://repository.upenn.edu/fnce_papers/233 For more information, please [email protected].
Recommended Citation
Eckbo, B. E., & Thorburn, K. S. (2013). Corporate Restructuring.Foundations and Trends® in Finance, 7(3), 159-288.
Abstract
We survey the empirical literature on corporate financial restructuring, including breakup transactions (divestitures, spinoffs, equity carveouts, tracking stocks), leveraged recapitalizations, and leveraged buyouts (LBOs). For each transaction type, we survey techniques, deal financing, transaction volume, valuation effects and potential sources of restructuring gains. Many breakup transactions appear to be a response to excessive conglomeration and attempt to reverse a potentially costly diversification discount. The empirical evidence shows that the typical restructuring creates substantial value for shareholders. The value-drivers include elimination of costly cross-subsidizations characterizing internal capital markets, reduction in financing costs for subsidiaries through asset securitization and increased divisional transparency, improved (and more focused) investment programs, reduction in agency costs of free cash flow, implementation of executive compensation schemes with greater pay-performance sensitivity, and increased monitoring by lenders and LBO sponsors. Buyouts after the 1990s on average create value similar to LBOs of the 1980s. Recent
developments include consortiums of private equity funds (club deals), exits through secondary buyouts (sale to another LBO fund), and evidence of persistence in fund returns. LBO deal financing has evolved toward lower leverage ratios. In Europe, recent deals are financed with less leveraged loans and mezzanine debt and more high-yield debt than before. Future research challenges include integrating analyses across transaction types and financing mixes, and producing unbiased estimates of the expected return from buyout investments in the presence of limited data on portfolio companies that do not return to public status. DOI:10.1561/ 0500000028
Disciplines
Corporate Finance | Finance | Finance and Financial Management Comments
author Karin S. Thorburn is affiliated with the Norwegian School of Economics, Norway. She is also a visiting faculty member in the Finance Department of the Wharton School at the University of Pennsylvania.
Vol. 7, No. 3 (2012) 159–288 c
2013 B. E. Eckbo and K. S. Thorburn DOI: 10.1561/0500000028
Corporate Restructuring
By B. Espen Eckbo and Karin S. Thorburn
Contents
1 Introduction 161
2 Restructuring and the Boundary of the Firm 163
2.1 Breakups and the “Conglomerate Discount” 163 2.2 Highly Leveraged Transactions 167
3 Divestitures 170
3.1 Transaction Volume 170
3.2 Valuation Effects 172
3.3 Drivers of Value Creation in Divestitures 176
3.4 Corporate Governance 178
4 Spinoffs 182
4.1 Transaction Volume 183
4.2 Valuation Effects 185
4.3 Drivers of Value Creation in Spinoffs 187
4.4 Corporate Governance 192
4.5 Splitoffs 194
5 Equity Carveouts 196
5.3 Drivers of Value Creation in Equity Carveouts 199
5.4 Agency Issues 203
6 Tracking Stocks 205
6.1 Transaction Volume 206
6.2 Valuation Effects 206
6.3 Drivers of Value Creation in Tracking Stock 207
6.4 Agency Issues 208
7 Leveraged Recapitalizations 210
7.1 Transaction Volume 211
7.2 Valuation Effects 212
7.3 Drivers of Value Creation in Leveraged Recapitalizations 213
8 Leveraged Buyouts (LBOs) 216
8.1 Transaction Volume 217
8.2 The LBO Capital Structure 219
8.3 Value Creation in LBOs 233
8.4 Drivers of Value Creation in LBOs 237
8.5 Industry Effects 253
8.6 Organizational Longevity and Exit 254
9 Conclusions 258
Acknowledgments 262
Vol. 7, No. 3 (2012) 159–288 c
2013 B. E. Eckbo and K. S. Thorburn DOI: 10.1561/0500000028
Corporate Restructuring
∗B. Espen Eckbo
1and Karin S. Thorburn
2 1 Tuck School of Business at Dartmouth Hanover, NH 03755, USA2 Norwegian School of Economics, Helleveien 30, 5045 Bergen, Norway
Abstract
We survey the empirical literature on corporate financial restruc-turing, including breakup transactions (divestitures, spinoffs, equity carveouts, tracking stocks), leveraged recapitalizations, and leveraged buyouts (LBOs). For each transaction type, we survey techniques, deal financing, transaction volume, valuation effects and potential sources of restructuring gains. Many breakup transactions appear to be a response to excessive conglomeration and attempt to reverse a poten-tially costly diversification discount. The empirical evidence shows that the typical restructuring creates substantial value for shareholders. The value-drivers include elimination of costly cross-subsidizations characterizing internal capital markets, reduction in financing costs for subsidiaries through asset securitization and increased divisional trans-parency, improved (and more focused) investment programs, reduction in agency costs of free cash flow, implementation of executive compen-sation schemes with greater pay-performance sensitivity, and increased
*This monograph updates Eckbo and Thorburn (2008) with new data and research
devel-opments. It was in part written while Thorburn was a Visiting Professorial Fellow at the Australian Business School at University of New South Wales.
average create value similar to LBOs of the 1980s. Recent developments include consortiums of private equity funds (club deals), exits through secondary buyouts (sale to another LBO fund), and evidence of per-sistence in fund returns. LBO deal financing has evolved toward lower leverage ratios. In Europe, recent deals are financed with less leveraged loans and mezzanine debt and more high-yield debt than before. Future research challenges include integrating analyses across transaction types and financing mixes, and producing unbiased estimates of the expected return from buyout investments in the presence of limited data on portfolio companies that do not return to public status.
1
Introduction
Shocks to the corporate economic environment may give rise to severe organizational inefficiencies. For example, a vertically integrated firm may find that long-term contracts and/or spot market purchases of a key input have become more efficient. Or increased general capi-tal market liquidity may have rendered internal capicapi-tal markets a rel-atively costly divisional funding mechanism for conglomerates. High leverage may be optimal as financial innovations and expertise make it less expensive to manage financial distress. Financial innovations and general market liquidity may also render it optimal to securitize an entire division. The result is increased divisional managerial focus. In this monograph, we collectively refer to the transactions that imple-ment these and other changes in asset composition, financial contract-ing, and ownership structure as “corporate restructuring”.
We focus the survey on two broad groups of corporate restructuring procedures: corporate breakups and highly leveraged transactions. Cor-porate breakups include techniques to sell off and/or securitize part of the firm. They include divestitures, spinoffs, equity carveouts, and, for a brief period, tracking stock. Highly leveraged transactions involve a significant increase of debt in the firm’s capital structure, either through
a debt-financed special dividend in a leveraged recapitalization, or in a leveraged buyout (LBO), in which the entire firm is acquired by a financial buyer (a buyout fund).
In order to limit the scope of the survey, we do not review recap-italizations that do not involve extensive use of leverage. Examples include state privatizations (Megginson and Netter, 2001), conversions from mutual to stock companies (Masulis, 1987), and stock repurchases (Kalay and Lemmon, 2008). Moreover, for a review of the broader lit-erature on corporate takeovers and takeover bidding involving strategic buyers, see Betton et al. (2008). Also, we address distressed restructur-ing only tangentially (Hotchkiss et al., 2008; Senbet and Wang, 2012). As surveyed below, corporate restructuring may be initiated by top-level management, by divisional managers, or by outside sponsors like buyout funds. Occasionally, the restructuring is defensive, arising in response to a control threat from the market for corporate control. Regardless of who initiates the transaction, the parties are likely seek-ing to improve operatseek-ing efficiency, increase cash flow, and ultimately, enhance firm profitability. In breakup transactions, the evidence sug-gests that assets are transferred to higher-value users, while highly leveraged transactions involve optimizing capital structure, improving managerial incentives and achieving tax efficiency.
The monograph is organized as follows. Chapter 2 introduces the so-called diversification discount and the potential costs of diversifica-tion, which seem to motivate many breakup transactions. Chapters 3 through Chapter 6 then detail the frequency, structure, and economic effect of various types of breakup transactions, beginning with divesti-tures (Chapter 3), spinoffs (Chapter 4), equity carveouts (Chapter 5), and ending with tracking stock (Chapter 6). Next, we review highly leveraged transactions, including leveraged recapitalizations (Chap-ter 7), and we provide an extensive discussion of the empirical evidence on LBOs (Chapter 8). Chapter 9 concludes the monograph.
2
Restructuring and the Boundary of the Firm
2.1 Breakups and the “Conglomerate Discount”
The economic boundary of the firm may be defined as the point where within-firm transactions start to become more costly than arms-length (across market) transactions. There are numerous theories for why within-firm transactions may economically dominate market transac-tions, ranging from transactions costs (Coase, 1937) to agency costs and costs of imperfect contracting and moral hazard.1
Alternatives to outright ownership of resources include renting (long- or short-term contracts) and “spot” market transactions to ensure continued operations of the firm. These organizational alter-natives have different implications for corporate taxes, firm-specific resource specialization and development of appropriable quasi-rents (which in turn lead to bargaining issues and potential for opportunistic behavior), investment decisions, risk sharing, and financing costs.
An asset such as an operating plant may have greater value as a division of a conglomerate than as a stand-alone “pure play” entity. As
1See, e.g., Jensen and Meckling (1976), Klein et al. (1978), Williamson (1985), Grossman
and Hart (1986), Jensen (1986), and Hart and Moore (1990).
emphasized by Maksimovic and Phillips (2007), implicit in the belief that conglomerates create value is the idea that industries differ materi-ally in the skills and resources which are required to operate efficiently, and that this diversity of operating environments affects the cost of performing transactions within the firm. These costs could be due to financial externalities across industries, such as improved risk sharing within the firm, or real externalities that could arise due to the use of a shared factor of production.
The value of using shared resources, such as managerial time and internal capital, differs across firms and industries as well as through time as the boundaries of the firm change. For example, Comment and Jarrell (1995) document an increase in corporate focus in the 1980s. They show that 56% of exchange listed firms had a single business segment in 1988 compared to 38% in 1979. Breakup transactions create value when such synergies from conglomeration become negative, i.e., when the costs of keeping the company’s assets together exceed the benefits from doing so.
The corporate finance literature on diversification took off with the discovery of the “conglomerate discount” by Lang and Stulz (1994) and Berger and Ofek (1995). The discount is measured as the difference between the market value of the diversified firm and the sum of the estimated values of the (non-traded) divisions. The latter are estimated using multiples from single-segment (“pure play”) competitors. Berger and Ofek (1995) report a diversification discount of 13–15% for US publicly traded firms in the 1986–1991 period.
Internationally, Lins and Servaes (1999) analyze publicly traded firms from Germany, Japan, and the UK in 1992 and 1994. They report a significant discount of 10% in Japan and 15% in the UK, but do not find evidence of a discount in Germany. Their study suggests that, for Japan, the conglomerate discount only appears for firms with a strong Keiretsu affiliation. Fauver et al. (2003) study more than 8,000 firms from 35 countries and find that the financial, legal, and regula-tory environments each have an important influence on the value of diversification.
Empirical research has extended and reinterpreted the early results on the conglomerate discount. Lamont and Polk (2002) and Campa and
Kedia (2002) make the point that, since firms endogenously choose to diversify, exogenous variation in diversification is required to draw infer-ences about its causal effect on firm value. Lamont and Polk (2002) find that exogenous changes in corporate “diversity” (defined as the within-firm dispersion of industry investment) are negatively related to within-firm value. Thus, they argue that diversification destroys value. However, Campa and Kedia (2002) find that firms with low value are more likely to diversify. Controlling for this self-selection, the diversification dis-count drops and sometimes turns into a premium.
Maksimovic and Phillips (2007) conclude that diversified firms pre-dominantly behave like value maximizers, given their productivity and that internal capital markets tend to facilitate the efficient transfer of resources. However, they also point to ambiguities reflecting econo-metric issues of endogeneity and self-selection, as well as choice of data and industry classifications, at various steps of the overall test strategy. They further conclude that “there is some evidence that conglomerate firms that are busted up had investment patterns that varied from the neoclassical model” (p. 472). A sample of diversified firms that divested one or more divisions is more likely to be facing significant diversifica-tion costs than a random sample of conglomerates.
The literature on breakup transactions provides several examples of diversification costs and how they may distort investment. Scharf-stein and Stein (2000) describe conditions under which top management inefficiently allocates too much funds to divisions with poor invest-ment opportunities (cross-subsidization). Rajan et al. (2000) argue that investment choices may be distorted because top management cannot commit to future distribution of funds until a surplus has been realized. Goldman (2004) models the resource allocation inside a multidivision firm of a manager with stock-based compensation, and shows that the investment incentives improve after a spinoff of a division.
Another potential cost of diversification is related to executive com-pensation: the division being a private entity, it is difficult to tie divi-sional manager compensation directly to the underlying value of the operations under their control. Stock-based compensation policies may be critical to induce optimal investment decisions, and to retain man-agerial talent in a competitive labor market. A separate listing of
subsidiary stock resolves such compensation issues, lowering agency costs and increasing market value.2
Yet another motivation for breakup transactions is that conglomer-ation accentuates informconglomer-ation asymmetries between investors and cor-porate insiders. Nanda and Narayanan (1999) model a diversified firm’s decision to divest a division that is undervalued by the market. Outside investors observe the aggregated (conglomerate) cash flow only, while management also observes the divisional cash flows. Without detailed divisional information, the market rationally assigns an average perfor-mance to each division. This pooling results in undervaluation of the well-performing division and overvaluation of the poorly performing division. In this situation, it may be optimal to divest the overvalued (underperforming) division in order to lower the cost of capital for the undervalued division.
A related information-based argument is that conglomerates oper-ating in a wide range of industries are more difficult for analysts to value. This is true both because analysts tend to specialize in certain industries and because divisions may be relatively opaque in terms of financial information. A breakup may lead to increased analyst fol-lowing and improved quality of the information available to investors. Liu (2005) also argues that a breakup allows outsiders to discover firm value at a lower cost. He presents an equilibrium in which high-value firms break up to separate themselves from low-value firms, predicting a positive market reaction to breakup announcements.
The breakup motivations discussed above are all consistent with firm value maximization. However, Boot (1992) argues that self-interested managers are reluctant to sell assets because a divestiture may signal poor managerial quality. He claims that there are too few divestitures in reality, compared to the level that is optimal for share-holder wealth. Boot (1992) proposes that corporate control transactions play a critical role in enforcing more divestitures, for example by forc-ing managers to sell a “crown jewel” to prevent a takeover of the firm. Lang et al. (1995) also argue that managers value control and won’t sell assets to promote operating efficiency alone. They suggest that assets
are sold only when the firm is financially constrained and a divestiture is the least expensive way to raise capital.
These arguments emphasize how breakups create value by reversing negative synergies. However, a divisional or asset sale may also be the result of the demand side: the assets may simply be worth more under the buyer’s control. That is, the buyer may be a higher-quality manager and the divisional resources may offer a greater potential for synergies when merged with the acquiring firm. Also, corporate breakups may be forced by regulatory actions such as antitrust or by bankruptcy court.
2.2 Highly Leveraged Transactions
In a highly leveraged transaction, the focus of the restructuring is on the economic effects of the leverage increase. As discussed further below, whether undertaking a debt-financed dividend (leveraged recap), or a leveraged purchase of a division or the entire firm (LBO, where the firm goes private), it is primarily the leverage increase rather than any concomitant asset restructuring that provides the economic motivation for the transaction. As a result, LBOs tend to involve financial (as opposed to strategic) buyers, such as buyout funds.
The literature points to several possible sources of gains in leverage-increasing transactions. Under the classical trade-off theory of debt, firms move to a higher level of debt in order to capitalize on the cor-porate debt tax shield provided by the (U.S.) tax law.3 In addition to the potential for corporate tax benefits, the literature emphasizes ben-eficial managerial incentive and monitoring effects of higher leverage. Some highly leveraged firms may also gain a strategic advantage in product markets. On the other hand, high leverage is not for everyone: under conditions of financial distress, a debt overhang tends to prevent efficient investments (Myers, 1977).
In terms of managerial incentives, Ross (1977) presents a signal-ing model in which managers who face personal bankruptcy costs sig-nal their private information about higher future expected cash flows by committing to a greater corporate debt level. In the vernacular of
Jensen (1986), entrenched managers prefer to overinvest rather than pay out the firm’s “free cash flow” as dividends (where free cash flow is defined as corporate liquid funds in excess of what is required to fund all positive net present value projects).
A leveraged recapitalization, where the firm increases its debt with-out retaining the proceeds (thus increasing leverage ratios), reduces Jensen’s overinvestment problem by precommitting to disgorge future cash flows in the form of interest payment. Jensen (1986) further argues that the greater risk of financial distress associated with higher lever-age also helps discipline manlever-agerial investment policies. Stulz (1990) formalizes this intuition and shows that high leverage is particularly valuable when investment opportunities are poor, even if the free cash flow is negative.
Increasing leverage also allows wealth constrained managers to hold a greater percentage of total equity after the transaction is completed. For example, in a leveraged recapitalization, the debt may be paid out as cash dividend to non-managerial stockholders and as a stock divi-dend (or a cash dividivi-dend that is immediately reinvested in the firm) to managers. In an LBO, the managers may roll over their equity invest-ment, while other equity holders are paid out, again increasing man-agers’ fractional equity ownership. The incentive effect of such greater managerial equity ownership helps reduce manager–shareholder con-flicts of interest. Garvey (1992, 1995) explores the conditions under which leverage and management equity ownership are complementary in reducing the overinvestment problem of free cash flow.
Highly leveraged transactions may also lead to improved monitoring by banks, and by the LBO sponsor who has its own money at risk in the transaction. Jensen (1989) argues that active governance by buy-out sponsors and high-powered managerial incentives, combined with the pressure from high leverage, provides an incentive structure that is superior to that of public firms with dispersed ownership and weak gov-ernance. He suggests that the LBO organizational form may “eclipse” the traditional corporate form, a prediction that has yet to be proven (Kaplan and Stromberg, 2009).
Moreover, highly leveraged transactions may cause wealth trans-fers across the firm’s various constituencies. For example, bonds that
lack protective covenants may become more junior in the capital struc-ture, resulting in a bondholder loss (benefiting shareholders). It is also possible that incumbent managers participating in a leveraged buyout have inside information about the firm’s future prospects, expropri-ating selling shareholders. Muller and Panunzi (2004) argue that the LBO sponsor may be in a position to expropriate minority shareholders by merging the firm with the raider’s leveraged acquisition subsidiary. Perotti and Spier (1993) present a model in which the firm gains bar-gaining power in contracting renegotiations by temporarily increasing leverage. Specifically, after retiring equity through a junior debt issue, shareholders threaten to underinvest in valuable new projects unless employees concede to wage reductions. Finally, there is a growing litera-ture linking leverage to the firm’s strategic position in product markets. See Maksimovic (1995) and Parsons and Titman (2008) for reviews of this literature.
We now turn to a detailed description of the empirical evidence on breakups and highly leveraged transactions. In the course of discussing the evidence, we return to several of the hypotheses outlined above.
3
Divestitures
A divestiture is the sale of a portion of the firm’s assets to a third party — typically another company or a buyout fund — in a private transaction. The assets that are sold may be a division, segment, sub-sidiary, or product line. In return, the seller typically receives cash, but sometimes also securities or a combination of both. The proceeds from the sale are reinvested in the remaining business or distributed to the firm’s claim holders. While eliminating a fraction of its assets, the selling firm continues to exist in essentially the same form as before. Divestitures may trigger a substantial tax liability: the difference between the proceeds from the sale and the firm’s tax basis in the assets is a capital gain or capital loss, which is taxed at the corporate tax rate.
3.1 Transaction Volume
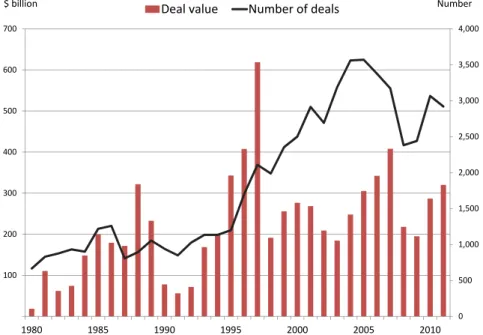
In 2011, U.S. corporations announced 2,919 divestitures with a total deal value of $320 billion (source: Mergerstat Review). 377 of these transactions had a deal value exceeding $100 billion, while 71 transac-tions had a value of $1 trillion or more. The line in Panel A of Figure 3.1 shows the annual number and the bars show the annual dollar volume
0 500 1,000 1,500 2,000 2,500 3,000 3,500 4,000 100 200 300 400 500 600 700 1980 1985 1990 1995 2000 2005 2010
Deal value Number of deals
$ billion Number
Panel B: Divestitures as a fraction of the U.S. merger and acquisition volume. Panel A: Total transaction value in $ billion and number of divestitures.
0% 10% 20% 30% 40% 50% 60% 1970 1975 1980 1985 1990 1995 2000 2005 2010 31%
of U.S. divestitures over the period 1980–2011. The number of transac-tions was relatively stable between 1980 and 1995. Since the mid-1990s, however, the divestiture activity tripled and reached record high levels in 2005–2006. After a drop in deal activity through the financial crises, the level of divestitures recovered quite well in 2010 and 2011.
The most aggressive U.S. divesters of subsidiaries and divisions in 2011 was General Electric (12 divestitures), followed by Bank of Amer-ica (11), Exxon Mobil (11), Citigroup (10), and asset management firm The Carlyle Group (11). Two of these sellers — General Electric and Citigroup — were also among the most aggressive divesters in 2010. In addition, General Electric was on the Mergerstat Review list of aggres-sive buyers in 2011, with 27 acquisitions.
The total divestiture activity tracks closely the merger and acquisi-tion (M&A) activity in the economy. Panel B of Figure 3.1 shows the annual number of U.S. divestitures as a percentage of all U.S. takeovers from 1970 and forward. While the number of divestitures increased sharply in the second half of the 1990s, it fell behind the even greater increase in M&A volume over the same period. This trend was reversed once the takeover activity slowed after the turn of the century. In 2011, divestitures made up 31% of all M&A transactions, somewhat below the annual average of 37% over the whole 1970–2011 period.
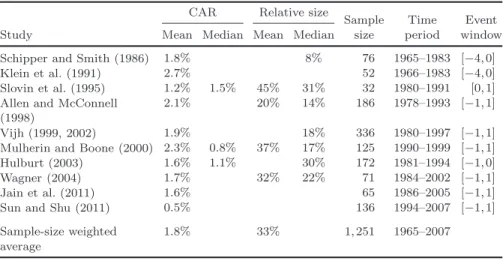
3.2 Valuation Effects
Panel A of Table 3.1 shows the stock price reaction of the divesting firm for 24 studies of divestiture announcements in the period 1963–2005. The studies generally report the cumulative abnormal stock return (CAR) over the two-day interval (−1,0) where day 0 is the announce-ment day.1 More recent studies often include day +1 as well, to capture
1A typical approach is to estimate the parameters using a single-factor market model over
approximately a year prior to the event:Rjt=αj+βjRmt+jt, whereRjt is the stock return of firmj and Rmt is the market return on day t. The abnormal return ARjτ over event day τ is computed as ARjτ =Rjτ −( ˆαj+ ˆβjRmτ), where ˆαj and ˆβj are the coefficient estimates from the time series regression. The cumulative abnormal return isCAR(τ1,τ2) = Σττ2=τ1ARjτ, whereτ1 andτ2 define the event window relative to the announcement day 0.
Table 3.1. Cumulative abnormal returns (CAR) for divestiture announcement of 7,544 sellers and 2,300 buyers in 25 selected studies, 1963–2005.
Relative size is the average ratio of the sales price of the divested assets to the pre-deal total assets (TA) and market value of equity (MVE) of the seller and buyer, respectively.
CAR Relative size
Sample Time Event Study Mean Median TA MVE size period window
Panel A: Seller returns:
Alexander et al. (1984)
0.3% 53 1964–1973 [−1,0]
Linn and Rozeff (1984) 1.6 % 77 [−1,0] Rosenfeld (1984) 2.3% 62 1969–1981 [−1,0] Jain (1985) 0.5% 1,062 1976–1978 [−1,0] Klein (1986) 1.1% 202 1970–1979 [−2,0] Hite et al. (1987) 1.5% 16% 114 1963–1981 [−1,0] Hirschey and Zaima
(1989)
1.6% 170 1975–1982 [−1,0]
Hirschey et al. (1990) 1.5% 38% 75 1975–1982 [−1,0] Afshar et al. (1992) 0.7% 10% 178 1985–1986 [−1,0] Sicherman and Pettway
(1992)
0.9% 30% 278 1980–1987 [−1,0] John and Ofek (1995) 1.5% 0.8% 39% 258 1986–1988 [−2,0] Lang et al. (1995) 1.4% 0.7% 11% 69% 93 1984–1989 [−1,0] Loh et al. (1995) 1.5% 59 1980–1987 [−1,0] Slovin et al. (1995) 1.7% 0.7% 33% 17% 179 1980–1991 [0,1] Hanson and Song
(2000)
0.6% 0.3% 27% 326 1981–1995 [−1,1] Mulherin and Boone
(2000)
2.6% 1.6% 18% 139 1990–1999 [−1,1] Clubb and Stouraitis
(2002)
1.1% 0.5% 14% 187 1984–1994 [−1,0] Dittmar and Shivdasani
(2003) 3.4% 31% 188 1983–1994 [−1,1] Kiymaz (2006) 3.2% 9% 205 1989–2002 [−1,1] Benou et al. (2008) 0.9% 1,812 1981–2001 [−1,1] Cao et al. (2008) 1.3% 668 1992–2003 [−1,1] Francoeur and Niyubahwe (2009) 0.6% 167 1990–2000 [−1,1] Ataullah et al. (2010) 2.0% 14% 195 1992–2005 [−1,1] Owen et al. (2010) 1.6% 0.6% 20% 797 1997–2005 [−1,1] Sample-size weighted seller average 1.2% 20% 27% 7,544 1963–2005 (Continued)
Table 3.1. (Continued) CAR Relative size
Sample Time Event Study Mean Median TA MVE size period window
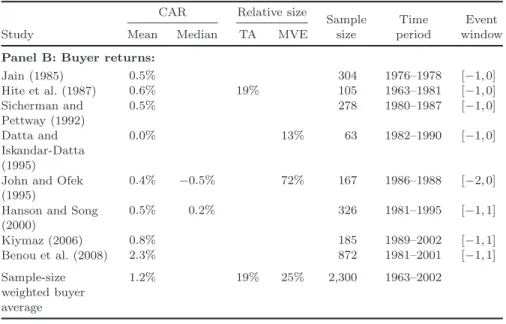
Panel B: Buyer returns:
Jain (1985) 0.5% 304 1976–1978 [−1,0] Hite et al. (1987) 0.6% 19% 105 1963–1981 [−1,0] Sicherman and Pettway (1992) 0.5% 278 1980–1987 [−1,0] Datta and Iskandar-Datta (1995) 0.0% 13% 63 1982–1990 [−1,0]
John and Ofek (1995)
0.4% −0.5% 72% 167 1986–1988 [−2,0] Hanson and Song
(2000) 0.5% 0.2% 326 1981–1995 [−1,1] Kiymaz (2006) 0.8% 185 1989–2002 [−1,1] Benou et al. (2008) 2.3% 872 1981–2001 [−1,1] Sample-size weighted buyer average 1.2% 19% 25% 2,300 1963–2002
the effect of an announcement after the closing of the stock exchange or misreporting of the announcement date. The average CAR for the announcements is positive — ranging from 0.3% to 3.4% across the different samples — and almost all of the estimates are statistically significant at the 1% level (two-sided t-test against zero). The sample-size-weighted average CAR for the combined sample of 7,544 divesti-tures is 1.2%. In sum, the evidence indicates that the average divestiture increases the value of the selling firm.
As further shown in the table, firms sell one-fifth of their total assets in the average transaction. Several studies find that the seller firm announcement returns are increasing in the relative size of the divested assets (Zaima and Hearth, 1985; Klein, 1986; Mulherin and Boone, 2000). It is possible that the returns on asset sales are inde-pendent of the size of the assets, so that relatively larger assets have a greater impact on the parent firm’s return. This is similar to the effect of the relative size of the target on bidder returns documented in the takeover literature and reviewed in Betton et al. (2008).
Klein (1986) reports that the disclosure of the sales price is central to the market’s assessment of the transaction. She finds a positive seller stock price reaction only when the price is disclosed at the initial divestiture announcement. Firms that fail to announce the transaction price have CARs close to zero. The significance of price disclosure is confirmed by Afshar et al. (1992) and Sicherman and Pettway (1992). Clubb and Stouraitis (2002) find that the announcement returns tend to increase with the difference between the sales price and an estimated value of the assets in their current use. Overall, this suggests that the market’s valuation of the transaction depends on the sales price relative to the value of the assets when operated by the firm.
The abnormal returns on divestiture announcements are positive also for buyers. For eight studies with data for the period 1963–2002 and listed in Panel B, the average buyer announcement CAR ranges from 0.0% to 2.3%. The sample-size-weighted buyer average CAR (ACAR) is 1.2% for the combined sample of 2,300 divestiture announcements. Note, however, that the study by Benou et al. (2008) of 872 high-tech divestitures in the period 1981–2001 generates much larger buyer returns than prior studies. Excluding this study from the total sample reduces buyer returns to a sample-size-weighted average of 0.5% — still positive, but of a smaller magnitude than for sellers. Sicherman and Pettway (1992) document a size effect in the buyer’s stock price reaction similar to that of sellers, i.e., buyer returns tend to increase with the relative size of the acquired assets.
While both sellers and buyers appear to gain from a divestiture, the division of the total gains depends on the relative bargaining strength of the two parties. Sicherman and Pettway (1992) use a debt down-grade prior to the asset sale as an indication of a weaker bargaining position vis-a-vis the buyer. As expected, they find significantly lower CARs for sellers whose debt was downgraded prior to the transaction. Moreover, the value creation is conditional on the successful comple-tion of the divestiture. Hite et al. (1987) show that the seller stock price drops back to its initial level if a previously announced divestiture is canceled. In addition, announcement returns are positive for buyers completing the transaction, but insignificant for buyers in transactions that subsequently fail.
3.3 Drivers of Value Creation in Divestitures
The positive announcement returns for sellers and buyers indicate that divestitures generally create value. We now turn to the evidence on the potential reasons for this value creation.
3.3.1 Increase in Corporate Focus
The typical divestiture involves sales of assets that are outside of the diversified firm’s core business, and it results in an increased focus of the remaining operations. John and Ofek (1995) show that three-quarters of divested segments are unrelated to the seller’s core business, defined as its primary four-digit Standard Industry Classification (SIC) code. Moreover, using various measures for firm focus, they find that sellers become more focused after the divestiture. Their focus measures include a sales-based Herfindahl index across the firm’s business segments, the total number of business lines reported by the firm, and whether the divested division is outside the firm’s core business.
Schlingemann et al. (2002) find that firms tend to divest non-core segments that are relatively small. Maksimovic and Phillips (2001) and Kaplan and Weisback (1992) show that firms are more likely to sell peripheral assets. Kaiser and Stouraitis (2001b) describe how Thorn EMI successfully raised cash by selling unrelated assets, reinvesting the proceeds in the company’s core business. In sum, divested assets are typically outside the firm’s core business and the asset sales result in an increased focus of the firm’s remaining operations.
An increase in corporate focus may create value if it allows manage-ment to focus their attention on the core business and therefore run the firm more efficiently. John and Ofek (1995) find that the divestment announcement returns are positively related to measures capturing the increase in focus. Moreover, the operating profitability of the remaining assets increases after a divestiture, but only for the firms that become more focused. Denis and Shome (2005) show that large firms downsiz-ing their assets become more focused and increase their operatdownsiz-ing per-formance. Berger and Ofek (1999) document average CARs of 7% for focusing-related announcements by diversified firms. Overall, there is substantial evidence that the value creation from divestitures is related to the resulting increase in business focus of the divesting firm.
3.3.2 Elimination of Negative Synergies
If the divested segment has negative synergies with other divisions of the diversified firms, the divestiture will create value simply by elimi-nating these negative synergies. Dittmar and Shivdasani (2003) exam-ine the investment efficiency of divesting firms. They find that the sale of a business segment is associated with a reduction of the diversi-fication discount. Moreover, they document significant improvements in the investment decisions of the firm’s remaining segments after the divestiture. Specifically, the investment level increases for segments that underinvest relative to single-segment firms and decreases for segments that overinvest relative to their peers. They also find that the announce-ment returns are higher the greater the subsequent reduction in the diversification discount and the greater the improvement in segment investments. Overall, their evidence suggests that divestitures create value by reducing costly cross-subsidization of inefficient investments in the diversified firm.
Colak and Whited (2007) reach a very different conclusion, address-ing the endogeneity of breakup decisions. They confirm that firms selecting a divestiture or spinoff are different from their peers: the firms that restructure are typically larger and more diversified, and are in relatively fast-growing industries. Controlling for these differences, they show that although spinoffs and divestitures are associated with improved investment efficiency, these improvements are not directly caused by the restructuring itself.
Kaplan and Weisback (1992) examine whether divestitures are evi-dence of failed acquisitions. Studying a sample of 271 large firms acquired between 1971 and 1982, they find that 44% of the targets were sold by the end of 1989. Only one-third of the divested seg-ments are classified as failed acquisitions, however, based on account-ing profitability and comments by managers and the business press. Kaplan and Weisback (1992) conclude that acquirers sell businesses that they have improved or that they once had synergies with but no longer do.2
2Fluck and Lynch (1999) model how firms make diversifying acquisitions to help finance
marginally profitable projects, to subsequently divest these subsidiaries once the projects are profitable and can generate the necessary funds internally.
3.3.3 Better Fit with the Buyer
As discussed above, a divestiture will create value if the assets are worth more to the buyer than the value in their current use. A buyer could, for example, have substantial synergies or superior management skills. John and Ofek (1995) find that seller announcement returns are higher when the buyer has some comparative advantage in manag-ing the assets, such as a buyer operatmanag-ing in the same industry as the divested division or a leveraged buyout group.
Using U.S. Bureau of Census data, Maksimovic and Phillips (2001) examine the effect of asset sales on the productivity at the plant level. They show that divestitures are more likely in business cycle upturns, when the assets are less productive than industry benchmarks, when the selling division is less efficient than the buyer, and when the firm has more efficient divisions in other industries. They conclude that most divestitures result in productivity gains by redeploying assets from relatively low-productivity sellers to higher-ability buyers.
Datta et al. (2003) also study the efficiency of the reallocation of assets in divestitures. They use Tobin’sq, defined as the ratio between the market value and the replacement cost (here the book value) of the assets, as a proxy for management’s capability to manage the assets. They find that the announcement returns are highest for transactions where the buyer has a relatively high q and the seller has a relatively lowq, possibly because the assets are transferred to a better managed firm. Overall, the evidence suggests that divestitures create value by transferring assets to higher-valuation buyers.
3.4 Corporate Governance
3.4.1 Agency Issues
Although a divestiture may be necessary to maximize shareholder wealth, some incumbent managements resist parting from assets. Berger and Ofek (1999) find that the announcements of focus-increasing transactions often are preceded by corporate control and incentive-altering events, including management turnover, outside shareholder pressure, changes in management compensation, and unsuccessful
takeover attempts. Gillan et al. (2000) describe how Sears announced the divestiture of financial services and refocusing on retail first after a long period of poor performance and coincident with substantial pressure from institutional investor activists. This suggests that the restructuring may have been postponed until it could not be delayed any longer.
Consistent with a reluctance to sell assets, the monitoring of and incentives provided to top management are critical to the value created by a divestiture. Tehranian et al. (1987) document significantly higher announcement returns for divesting firms that provide long-term per-formance plans to their top executives. Hirschey and Zaima (1989) find higher announcement returns for divestitures by companies with con-centrated ownership than sales by widely held firms. Also, the returns are higher for firms where insiders are net-buyers of the firm’s stock over the preceding six-month period. Hanson and Song (2000) further show that divestiture gains are increasing in the fraction of outside directors on the board and the percentage equity ownership of the management team. Pointing to the importance of banks as monitors, Hirschey et al. (1990) find some evidence of higher announcement returns for divesti-tures by firms with bank debt. Overall, firms with better monitoring and more managerial share ownership seem to make divestiture deci-sions that create more value.
The proceeds received by the divesting firm may be reinvested in the firm’s remaining operations, used to retire debt, or distributed to shareholders. Lang et al. (1995) and Kaiser and Stouraitis (2001a) show that the announcement returns are positive when the proceeds are used to pay back debt, but insignificant for firms that reinvest the proceeds. Slovin et al. (1995) also find higher announcement returns when the proceeds are paid out. Ataullah et al. (2010) show that the shareholder announcement returns increase with the shareownership of the CEO for firms that retain the proceeds. This suggests that management may employ the funds inefficiently if retained by the firm.
Bates (2005) examines the corporate payout and retention decision for 400 large asset sales between 1990 and 1998. He finds that the prob-ability of retaining the cash proceeds increases in the divesting firm’s growth opportunities, measured by its market-to-book ratio. However,
firms retaining the proceeds consistently overinvest (have higher cap-ital expenditure) relative to their industry peers. Also, the higher the equity ownership of officers and directors, the more likely is it that the sale proceeds are paid out. The evidence is again consistent with investment inefficiencies associated with the retention of proceeds from asset sales.
3.4.2 Financial Distress
Several studies indicate that asset sales are used as a way of generating cash when the firm is financially constrained. Divestiture announce-ments are typically preceded by a period of negative stock returns (Alexander et al., 1984; Jain, 1985; Hanson and Song, 2003) and poor operating performance (Lang et al., 1995; Schlingemann et al., 2002; Brown et al., 1994). Moreover, firms with high leverage are more likely to sell assets (Ofek, 1993; Kruse, 2002). Officer (2007) shows that divesting firms have lower cash balances, cash flow, and bond ratings than size- and industry-matched control firms, all of which suggest that the sellers are liquidity constrained. Also, Nixon et al. (2000) find that financially distressed firms prefer a divestiture to a spinoff, which does not generate cash. In addition, Asquith et al. (1992), Ofek (1993), and others show that firms in financial distress frequently sell assets as part of the restructuring process.
The optimal use of proceeds from asset sales changes when the firm is in financial distress. The firm’s ability to pay dividends to sharehold-ers is typically limited by debt covenants at this point, and the choice stands between reinvestment in the business or repayment of debt. For a sample of distressed firms, Brown et al. (1994) show that shareholder announcement returns are significantly higher when the proceeds are retained by the firm rather than used to repay debt. Also as expected, bondholder announcement returns are higher when the proceeds are used to pay off debt. Brown et al. (1994) suggest that creditor influence over distressed firms may force asset sales that benefits the firm’s credi-tors to the detriment of shareholders. Datta and Iskandar-Datta (1996) find that divestitures by financially distressed firms generate positive announcement returns for bondholders, but not for shareholders.
Shleifer and Vishny (1992) argue that financially distressed firms sell assets at depressed prices to lower-valuation industry outsiders because higher-valuation industry insiders are liquidity constrained. Consistent with this argument, Pulvino (1998) finds that financially constrained airlines sell aircrafts at lower prices than their unconstrained competi-tors. Moreover, Officer (2007) shows that acquisition multiples are lower when the parent firm has experienced negative abnormal stock returns over the year leading up to the sale and when the corporate loan spread above treasury rates is high. Also, Ramey and Shapiro (2001) show that more specialized assets sell at greater discounts, and that discounts are greater when assets are sold to industry outsiders than to industry insiders. Examining firms auctioned in Swedish bankruptcy, however, Eckbo and Thorburn (2008) reject the fire-sale hypothesis: they find little evidence of fire-sale discounts when assets are sold as going con-cerns.3
Liquidity may be a factor in the decision to sell assets. Kim (1998) documents that managers sell their most liquid assets first, before sell-ing more illiquid assets. Moreover, Mulherin and Boone (2000) and Schlingemann et al. (2002) show that breakup transactions tend to cluster in industries where the aggregate corporate transaction volume is large, i.e., in industries with relatively liquid markets for corporate assets.
3See Hotchkiss et al. (2008) for a more detailed review of asset restructurings by financially
4
Spinoffs
In a spinoff, a public company distributes its equity ownership in a subsidiary to its shareholders. The distribution is a pro-rata dividend and parent shareholders receive subsidiary stock in proportion to their ownership in the parent firm. The spinoff involves a complete separation of the two firms. After the spinoff, the subsidiary becomes a publicly traded company with a unique ticker symbol and an independent board of directors. In contrast to a divestiture, a spinoff does not generate any cash proceeds for the parent company. Also, since the spinoff involves a public listing of shares, it has higher transaction costs and takes longer time than a divestiture.
A spinoff may be structured as a tax free transaction if it quali-fies under Section 355 of the Internal Revenue Code. Among the most important requirements under Section 355 are (i) the parent must have control of the subsidiary (own at least 80% of the voting rights) prior to the distribution; (ii) the parent must distribute control (at least 80% of the votes) to shareholders and retain no practical control of the sub-sidiary; (iii) the spinoff must have a valid business purpose; and (iv) the parent or the subsidiary cannot be acquired within two years after the spinoff. If the spinoff qualifies under Section 355, there is no tax
on the distribution of stock, neither at the parent nor at the share-holder level. Most spinoffs in the United States are structured as tax free transactions.
If a spinoff does not qualify under Section 355, however, the distri-bution is taxed as a property dividend. The parent recognizes a gain equal to the difference between the fair market value of the subsidiary and the parent’s tax basis in the subsidiary, similar to a capital gain. This imputed gain is taxed at the corporate tax rate. Moreover, share-holders pay a dividend tax on the fair market value of the subsidiary (the distributed subsidiary stock).
The condition under Section 355 requiring that the subsidiary is not acquired within two years of the spinoff is outside the parent com-pany’s control. Yet, a potential acquisition of the subsidiary after a tax free spinoff would trigger an often substantial tax liability at the parent company level. To transfer the cost of this potential liability to the subsidiary and thus ultimately the acquirer, it is common practice that the subsidiary contractually commits to pay any such future tax liability of the parent, would the subsidiary be acquired within two years of the spinoff.
Maydew et al. (1999) compare 52 tax free spinoffs with 218 divesti-tures during the period 1987–1995. They find that tax costs average 8% of the divested assets. They suggest that managers prefer a taxable assets sale when the sales price is high enough to offset the associated tax cost.
4.1 Transaction Volume
Using data from Thompson SDC Platinum (SDC), Figure 4.1 plots the total deal value (bars) and annual number (line) of spinoffs announced worldwide between 1985 and 2012.1 The number of spinoffs soared in the second half of the 1990s, and reached a peak in year 2000 with
1Only 56% of the announced spinoffs are coded by SDC as completed. The rest are classified
largely as pending (27%), unknown (5%), or withdrawn (10%). Since many older spinoffs are coded as still pending, we ignore the deal status and report statistics for all announced spinoffs.
0 50 100 150 200 250 300 0 50 100 150 200 250 300 350 1985 1988 1991 1994 1997 2000 2003 2006 2009 2012
Deal value Number of deals Number
$ billion
Fig. 4.1 Annual volume of spinoffs worldwide, 1985–2012. Total transaction value of $ billion and number of spinoff announcements. (Source: SDC).
over 200 transactions and a total market value of $225 billion. Many companies tried to take advantage of the higher-valuation multiple investors were willing to pay for activities in the technology and inter-net sector by splitting off subsidiaries and divisions in that space.
While the interest for spinoffs plummeted with the burst of the internet bubble, the deal activity recovered through 2006 and 2007. The spinoff dollar deal volume fell again drastically with the onset of the financial crises and reached a trough in 2009, but has recovered through 2010 and 2011. In 2012, there were a total of 172 spinoffs announced globally for a combined value of $16 billion.
The largest U.S. transactions announced in 2012 were the spinoffs of The WhiteWave Foods from Dean Foods ($1.9 billion), Liberty Spinco from Liberty Media ($1.7 billion), and Sears Hometown and Outlet Stores from Sears Holdings ($0.7 billion). Internationally, the largest transactions were the spinoff of the tire manufacturer Hankook Tire, Korea ($5.4 billion); the separation of two mines in Sibanye Gold from Gold Fields, South Africa ($1.1 billion); and the split of PetroBakken Energy from Petrobank, Canada ($1.1 billion).
4.2 Valuation Effects
The results from 24 selected studies estimating shareholder gains from spinoff announcements are listed in Table 4.1. The samples contain a total of 2,957 spinoffs announced between 1962 and 2007. Share-holder average cumulative abnormal returns are significantly positive and ranges from 1.7% to 5.6% across the various studies. The low-est average CAR of 1.7% is for a sample of 156 European spinoffs announced in 1987–2000 and examined by Veld and Veld-Merkoulova (2004). Combining the 24 studies, the sample-size-weighted abnormal announcement return is 3.3%.
The average CAR of 3.3% in spinoffs is higher than the 1.2% average CAR for divestitures reported above. Recall, however, that also buy-ers tend to experience positive announcement returns in divestitures (average CAR of 1.2%). In contrast, the total gains from a spinoff are reflected in the parent company stock. Thus, some of the difference in announcement returns between spinoffs and divestitures could be explained by buyers sharing in the value creation from the latter trans-action.
Table 4.1 further shows that the market value of the subsidiary is about one-quarter of that of its parent in the average spinoff. As for divestitures, the announcement returns for spinoffs are increasing in the relative size of the subsidiary. Miles and Rosenfeld (1983) show that shareholder CARs are on average greater in spinoffs of subsidiaries with a market value exceeding 10% of the parent company’s market value compared to spinoffs of relatively small subsidiaries. In addition, Alli et al. (2001) find insignificant announcement returns for 47 spinoffs that are subsequently withdrawn, as if the market anticipates the with-drawal at the time of the announcement. See also Harris and Madura (2011) for more recent evidence on withdrawn spinoffs.
The evidence of positive announcement returns for spinoffs is com-pelling. Some studies also report long-term returns following spinoffs. Cusatis et al. (1993) estimate the buy-and-hold stock returns for par-ents and subsidiaries spun off in the 1965–1988 period. They find posi-tive average returns for holding periods of 24 and 36 months compared with portfolios of industry-and size-matched stocks. McConnell et al.
Table 4.1. Cumulative abnormal returns (CAR) for 2,957 spinoffs in 24 selected studies, 1962–2007.
Relative size is the ratio of the market value of equity of the spun off subsidiary and the parent company prior to the spinoff.
CAR Relative size
Sample Time Event Study Mean Median Mean Median size period window Miles and Rosenfeld
(1983)
3.3% 10% 55 1963–1980 [0,1]
Hite and Owers (1983) 3.3% 7% 123 1963–1981 [−1,0] Schipper and Smith
(1983) 2.8% 20% 93 1963–1981 [−1,0] Rosenfeld (1984) 5.6% 35 1969–1981 [−1,0] Vijh (1994) 2.9% 2.1% 29% 18% 113 1964–1990 [−1,0] Allen et al. (1995) 2.1% 94 1962–1991 [−1,0] Slovin et al. (1995) 1.3% 1.6% 33% 24% 37 1980–1991 [0,1] Daley et al. (1997) 3.4% 1.4% 85 1975–1991 [−1,0] Best et al. (1998) 3.4% 72 1979–1993 [−1,0] Desai and Jain (1999) 3.8% 29% 18% 144 1975–1991 [−1,1] Krishnaswami and
Subramaniam (1999)
3.1% 1.9% 31% 14% 118 1979–1993 [−1,0] Mulherin and Boone
(2000)
4.5% 3.6% 22% 14% 106 1990–1999 [−1,1] Gertner et al. (2002) 3.9% 2.2% 24% 19% 160 1982–1996 [−1,0] Wruck and Wruck
(2002)
3.6% 172 1985–1995 [−1,0]
Burch and Nanda (2003)
3.7% 3.2% 24% 20% 106 1979–1996 [−2,1] Maxwell and Rao
(2003)
3.6% 2.6% 25% 19% 80 1976–1997 [−1,0] Seoungpil and Denis
(2004)
4.0% 3.1% 25% 17% 150 1981–1988 [−1,1] Veld and
Veld-Merkoulova (2004)
1.7% 0.6% 156 1987–2000 [−1,0] McNeil and Moore
(2005)
3.5% 25% 23% 153 1980–1996 [−1,1] Qian and Sudarsanam
(2007) 4.8% 2.6% 157 1987–2005 [−1,1] Veld and Veld-Merkoulova (2008) 3.1% 2.6% 21% 91 1995–2002 [−1,1] Chemmanur et al. (2010) 2.2% 139 1990–2000 [−1,1]
Harris and Madura (2011) 2.5% 1.9% 472 1984–2007 [−1,1] Jain et al. (2011) 4.9% 46 1986–2005 [−1,1] Sample-size weighted average 3.3% 26% 18% 2,957 1962–2007
(2001) investigate portfolios of parents and subsidiaries in 89 spinoffs between 1989 and 1995. In contrast to the earlier work, they find little evidence of higher average buy-and-hold returns compared to portfolios matched on size and book-to-market. Also, using the Fama and French (1993) three-factor model as a benchmark, they reject the hypothesis that portfolios of spinoff companies exhibit abnormal returns. Klein and Rosenfeld (2010) show that “sponsored” spinoffs, where an outside investor purchases a substantial equity stake in the newly created firm around the spinoff date, perform worse than “conventional” spinoffs over a three-year period following the transaction.
4.3 Drivers of Value Creation in Spinoffs
4.3.1 Increased Corporate Focus
As with divestitures, a potential source of value creation in spinoffs is the increase in corporate focus resulting from the elimination of unre-lated divisions. Daley et al. (1997) report that the positive announce-ment returns are limited to spinoffs that increase corporate focus, defined as the parent and subsidiary having different two-digit SIC industry codes. They document substantial improvements in the return on assets for parents in focus-increasing spinoffs, but not for parents where the spun off subsidiary is in a related industry. Moreover, Desai and Jain (1999) find that focus-increasing spinoffs have significantly higher announcement returns, long-run abnormal stock returns, and improvements in operating performance than do non-focus increasing spinoffs.
Burch and Nanda (2003) estimate the change in the parent firm’s diversification discount from the year prior to the year after the spinoff. They find that the diversification discount is reduced when the spinoff increases corporate focus, but not otherwise. Overall, the evidence sug-gests that shareholder gains in spinoffs are associated with a subsequent increase in firm focus.
Jain et al. (2011) investigate firms’ decision to vertically disintegrate through a spinoff or an equity carveout. They find that the likelihood of vertical disintegration increases with positive subsidiary industry demand shocks and financing conditions, and decreases with parent
firm relative productivity. They find significantly positive announce-ment returns for parent firms, their rivals, and subsidiary supplier firms, suggesting that vertical divestitures result in efficiency gains to parent firms due to enhanced focus.
Dittmar (2004) examines the capital structure choice of spun off firms and their former parents. She shows that subsidiary debt levels are closer to (although still higher than) that of their industry rivals. Moreover, small subsidiaries with high growth opportunities have lower leverage ratios, while large subsidiaries with high collateral value have higher leverage ratios than do their parents. Thus, it appears that a spinoff allows the spun off entities to adopt a more suitable capital structure.
4.3.2 Elimination of Negative Synergies
The separation of an unrelated business segment may further reduce any negative synergies that exist between the subsidiary and the rest of the firm. Gertner et al. (2002) examine whether spinoffs help eliminate value-reducing cross-subsidization in diversified firms. They show that the subsidiary’s investment decisions become much more sensitive to the firm’s investment opportunities after the spinoff. Specifically, the total capital expenditure decreases for firms in low Tobin’sq industries and increases for firms in high q industries. These changes take place primarily for subsidiaries whose operations are unrelated to the parent’s core business and in spinoffs generating higher announcement returns. Ahn and Denis (2004) further find that, prior to the spinoff, parent firms trade at a discount to and invest less in their high-growth (highq) divisions than do their stand-alone peers. Following the spinoff, how-ever, the diversification discount is eliminated and investments have increased for the high-growth segments. Also, McNeil and Moore (2005) show that subsidiary capital expenditures move toward industry levels after the spinoff, both for previously rationed and subsidized divisions. Announcement returns are greater when parent firms previously allo-cated capital in a seemingly inefficient way, defined as rationing high
q and subsidizing low q spun off divisions, as is the reduction in the diversification discount.
Using plant-level data from the Longitudinal Research Database, Chemmanur and Nandy (2009) show that total factor productivity of plants remaining with the parent firm increases on average immediately after the spinoff. This productivity improvement can be attributed to cost savings and remains for the following five years. Overall, the evi-dence indicates that spinoffs create value by improving the investment decisions in diversified firms.2
Allen et al. (1995) propose that spinoffs provide a way to unwind unsuccessful prior acquisitions. They examine a sample of 94 spinoffs in which the spun off entity previously had been acquired by the parent firm. Their evidence suggests that the original acquisition was value destroying: the average acquisition announcement return is negative both for the acquirer and for the target and bidder combined. Moreover, the spinoff announcement return is positive and negatively correlated to the acquisitions return, i.e., the greater the anticipated loss from the acquisition, the larger the expected gain from the spinoff. While not identifying a unique source for the value creation in spinoffs, these results are consistent with the elimination of negative synergies between the parent and the subsidiary.
4.3.3 Wealth Transfer from Bondholders
A spinoff may increase shareholder value at the expense of the parent firm’s creditors by reducing the total assets of the firm. Also, if the spinoff increases the volatility of the cash flows of the two separate firms the expected payoff to debtholders will decrease, with a corresponding gain to shareholders (Galai and Masulis, 1976). MacMinn and Brockett (1995) further argue that a spinoff could transfer wealth from liability claimants by removing corporate assets from their reach. Neverthe-less, the impact of a spinoff on debtholders is limited by the existence of restrictive debt covenants. Hite and Owers (1983) find insignificant bondholder abnormal returns for a sample of 31 spinoff announcements in 1963–1981, as do Schipper and Smith (1983). For a more recent
2See also Fulghieri and Sevilir (2011) for a model of firms in industries with high human
capital intensity, showing that multidivisional firms can improve employee incentives to innovate through a spinoff.
sample from the period 1995–2002, Veld and Veld-Merkulova (2008) find small but significantlypositiveaverage bondholder returns around the spinoff announcement of 0.1% (median 0%).
In a case study of Marriott, however, Parrino (1997) documents a significant drop in the value of Marriott’s bonds following its spinoff announcement. At the same time, shareholder announcement returns were positive, suggesting a wealth transfer from bondholders. Maxwell and Rao (2003) examine monthly bond return data for a sample of 80 spinoffs between 1976 and 1997. They find that parent bondhold-ers tend to experience a price decline after the spinoff announcement. The average abnormal bond return (adjusted for the treasury rate) in the month of the spinoff is −0.9%, and decreasing in the relative size of the spun off subsidiary. Consistent with a bondholder loss, credit ratings are more likely to be downgraded than upgraded subsequent to the spinoff. They find, however, that the combined value of the pub-licly traded debt and equity increases, suggesting that a wealth transfer from bondholders could only explain part of the shareholder gains.
4.3.4 Information Asymmetries
The aggregation of financial data across divisions may exacerbate informational asymmetries between outside investors and insiders for diversified firms. Krishnaswami and Subramaniam (1999) examine whether spinoffs reduce such information gaps, using the dispersion in analysts’ forecasts and analysts’ forecast error as a measure for the information asymmetry. They find that spinoffs are more common for firms with relatively high levels of information asymmetry compared to their industry rivals. The announcement returns are higher for firms with a greater degree of information asymmetry, and the information gap tends to decrease after the spinoff. Best et al. (1998) also find that spinoff announcement returns are increasing in financial analysts’ earnings forecast errors. Overall, this suggests that one source of value creation in spinoffs is the mitigation of information asymmetries.
Analysts play an important role in producing and disseminating information about the firm. Gilson et al. (2001) study changes in the coverage by financial analysts for a sample of 103 focus-increasing spinoffs and equity carveouts over 1990–1995. They document a 45%
increase in analysts coverage in the three years following a breakup. The new analysts tend to be specialists in the subsidiary’s industry. Moreover, the accuracy of the earnings forecast improves by 30–50%, and in particular for the industry specialists. In sum, increases in cor-porate focus seem to improve the information provided by analysts, both in quality and quantity.
Huson and MacKinnon (2003) further show that analysts tend to revise upward their short-term earnings forecast in response to a spinoff. Also, idiosyncratic stock return volatility increases following a spinoff, and more so when the spun off subsidiary is unrelated to the parent firm. They conclude that the stock price becomes more sensitive to firm-specific information, which benefits informed traders relative to uninformed traders.3
4.3.5 Clientele Effects
Previously combined into a single security, the spinoff creates an opportunity to hold the subsidiary stock separately. This expansion of investors’ opportunity set increases liquidity and opportunities for investor diversification. In a sample of 113 spinoffs during 1964–1990, Vijh (1994) finds abnormal stock returns of 3.0% on the spinoff ex-date, i.e., the day that the subsidiary starts trading separately, accompanied by an increased trading volume. He attributes the positive returns to higher demand for the parent and subsidiary stocks once they have been separated.
Abarbanell et al. (2003) show that institutional investors rebal-ance their portfolio holdings in parents and their spun off subsidiaries dependent on the fund’s investment style and fiduciary restrictions. However, they find little evidence that such rebalancing trades lead to abnormal price pressures for parents or subsidiaries around the spinoff. Chemmanur and He (2007) examine the trading of institu-tional investors in 66 spinoffs between 1999 and 2004. They find large imbalances in the post-spinoff trading of parent and subsidiary stock: 46% of the trades are in the opposite direction and trades in the same
3See also Chemmanur and Liu (2011) for a model where the increased information
direction are heavily concentrated in one of the firms. This imbalance increases in the measure of information asymmetry and the difference in beta risk and growth rates between the parent and subsidiary. See also Bardong et al. (2008) for evidence on the market microstructure environment for spinoffs. Overall, spinoffs seem to relax a trading con-straint that existed prior to the distribution of the subsidiary stock. 4.3.6 Increased Probability of a Takeover
The fact that it is now possible to acquire control of the division through a stock purchase increases the likelihood that the division will become a future takeover target. The spinoff may also increase the probability that the parent will become a target as the parent is now a smaller and more focused firm. Cusatis et al. (1993) examine 146 tax free spinoffs over the period 1965–1988 and show that both the parent and the spun off subsidiary are indeed more likely to become takeover targets, compared to a set of control firms matched on size and industry. They suggest that the two pure plays created by a spinoff are more attractive as targets than the combined company. Most of the takeovers occur two to three years after the spinoff, possibly to protect the tax free status of the spinoff. Given the large premiums typically paid in control transactions, they attribute the positive abnormal stock returns at the time of the spinoff to the increased probability of being acquired. This inference is supported by Harris and Glegg (2008), who find that cross-border spinoff announcements are higher when the subsidiary is located in a country with a more active takeover market.
Chemmanur and Yan (2004) formalize this idea in a model where all shareholders benefit if incumbent management loses control of a division to a more able rival. A spinoff forces the manager either to work harder in running the firm or to relinquish control of one of the firms resulting from the spinoff. Either outcome leads to an increase in the combined equity value of the two firms resulting from the spinoff.
4.4 Corporate Governance
Self-interested managers may be reluctant to downsize assets under their control. Ahn and Walker (2007) study the importance of effective