The Offshore Services
Global Value Chain
March 1, 2010
Gary Gereffi & Karina Fernandez-Stark
Contributing CGGC researchers:
Penny Bamber, Yuber Romero & Anuradha Phulekar
Center on Globalization, Governance & Competitiveness,
Duke University
CONTENTS
Executive Summary ... 3
I. Introduction... 6
II. The Offshore Services Industry in the World ... 7
A. Definition and Importance ... 7
B. Global Services Models ... 10
III. Offshore Services Global Value Chain ...13
A. Upgrading in the Offshore Services Industry ... 18
B. The Current State of the Global Offshore Services Industry ... 23
1. Size of the Industry ... 23
2. Supply and Demand ... 26
3. The Most Dynamic Offshore Services Sectors... 37
IV. Country Cases ...39
A. India ... 39
B. Ireland ... 43
C. Eastern Europe ... 46
Policy Interventions in the Czech Republic ... 51
V. Industry Trends and Conclusions ...52
Appendix ...54
A. Acronyms ... 54
B. Glossary ... 55
C. Description of Activities in the Offshore Services Industry ... 57
1. Information Technology Outsourcing (ITO) ... 57
2. Business Process Outsourcing (BPO) ... 58
3. Knowledge Process Outsourcing (KPO) ... 60
FIGURES
Figure 1. Actual Adoption of Offshore Practices ... 9
Figure 2. Business Models in the Outsourcing and Offshore Services Industry ... 11
Figure 3. Offshore Services Value Chain ... 14
Figure 4. Offshore Services in the Pharmaceutical Value Chain ... 17
Figure 5. Global Demand of Offshore Services by Activity ... 25
Figure 6. Industry Participation in the Offshoring Market ... 28
Figure 7. The Global Supply and Demand for Offshore Services ... 31
Figure 8. Business Model of an Indian Offshore Services Provider ... 33
Figure 9. Distribution of Functions by Company Size ... 38
Figure 10. Indian Service Provision in 2000-2006 ... 39
Figure 11. Total Employment by Sector 1997-2007 ... 44
Figure 12. Selected Business Service Exports as Share of Third Party Sales to the EU Available Countries, 2004 ... 46
Figure 13. The Supply of Offshore Talent in Services in Eastern Europe ... 49
TABLES Table 1. Offshore Services Horizontal Activities ... 16
Table 2. Offshore Service Companies by Vertical Activities ... 22
Table 3. Global Offshore Services Market Size ... 24
Table 4. Top 20 Offshore Services Providers ... 30
Table 5. Top 10 Indian Offshore Services Companies ... 32
Table 6. Companies offering KPO Services ... 35
Table 7. Companies by Activity ... 36
Table 8. Factors of Attraction for Offshoring in India ... 40
Table 9. Factors of Attraction for Offshoring in Ireland ... 45
Executive Summary
This report analyzes the evolving offshore services industry employing the Global Value Chain framework. Offshore services emerged as a dynamic global sector in the past two decades. The information and communication technology (ICT) revolution that began in the early 1990s transformed the way companies do business by allowing for the separation of the
production and consumption of services. In the search for efficiencies and economies of scale, firms began offshoring and outsourcing a variety of corporate functions. Driven by the need to lower costs and access talent, firms look beyond the boundaries of the developed world. This provides important opportunities for growth and employment in the developing world. Firms are attracted to developing countries as offshore destinations for their competitive advantages, such as low human resources costs, technological skills, language proficiency, similar time zones, and geographic and cultural proximity to major markets. As more sophisticated work such as new product development, research and development (R&D), and other knowledge-intensive activities are performed abroad, the supply of scientific, engineering and analytical talent offered by developing countries also becomes key in attracting firms.
The global value chain for offshore services provides policy makers with a tool to support decision-making with respect to market entry. The chain incorporates all services that are currently being provided in the industry and value is correlated to employee education level. The lower value segments are basic services in information technology outsourcing (ITO) and business process outsourcing (BPO). At the higher end of the value chain are services in knowledge process
outsourcing (KPO) segment, including market research and business intelligence that require highly specialized expertise. Industry-specific services that cannot be easily applied in other industries are referred to as verticals. Vertical chains include lower value ITO and BPO services, with research and development (R&D) at the high end. In order to develop this global value chain, the industry is analyzed at both the firm and country levels. Lead firms are identified and their key activities are categorized, including the evolution or upgrading of the firms´ key service offerings.
The industry has grown rapidly during the past decade and estimates for its size at a global level range widely from US$ 101 to US$157 billion for 2008. Demand in the industry is analyzed at three levels: geographic, firm type and industry. Geographically, demand continues to be led by the United States and Canada, which together account for 51.1% of industry demand, followed by Europe (30.6%) and Asia (16.2%) (Datamonitor, 2009). At a firm level, multinational corporations and large firms receive the largest proportion of business services,
particularly in the ITO and BPO segments of the value chain. At an industry level, the financial and manufacturing sectors use the most offshore services at 32% and 20% respectively, followed by Telecom (12%) and Energy (11%).
Supply in offshore services is highly concentrated, the top five firms are, IBM, Accenture, EDS (today HP Enterprise Services), Computer Science Corporation and Capgemini. Lead firms tend to operate in more than one segment of the value chain and all have a strong presence in both ITO and BPO sectors. The most common upgrading trajectories include the movement of firms from IT hardware provision into software and IT services, from IT services to BPO services, and IT services to specialized vertical R&D functions. The knowledge-process outsourcing (KPO) segment has shown some upgrading from ITO and BPO firms, but it also includes a large proportion of new market entrants, particularly small and medium sized suppliers.
Supply firms in all segments of the value chain operate at a global scale with a similar business model generally referred to as the Global Delivery Model (Sako, 2009b; Tata Consultancy Services, 2009a; William F. Achtmeyer Center for Global Leadership, 2008). This consists of a global network of customer support offices and specialized delivery centers in lower cost countries and the headquarters. India and the Philippines are the most mature providers of offshore services with the highest number of these delivery centers, followed by a group of 11 emerging nations including Chile, Poland and Malaysia and finally the new comers to the industry include South Africa, Morocco and Egypt. The Global Delivery Model allows global services companies to be close to their clients and, at the same time, to undertake projects with multidisciplinary experts from different parts of the world. The model is facilitated by high concentration in the early segments of the supply chain, which has led to global standardization of both operating systems and telecommunications infrastructure platforms.
The most dynamic activities are in the knowledge process outsourcing (KPO) segment and advanced industry-specific vertical activities. In R&D, offshoring to emerging markets is expected to reach $20 billion in 2009, showing a strong increase from earlier years despite the economic crisis. High value added services require a relatively high degree of interaction between the client and the supplier because activities are complex and require a high degree of customization, and thus this segment provides greater opportunities for knowledge transfer to the host country than ITO and BPO segments that have become largely commoditized with little interaction
between the client and provider. Industries leading demand in this segment include the high-tech, automotive, aerospace and health care sectors.
As the offshore services industry continues to evolve, the following trends are expected to shape growth. Firstly, the substantial industry growth achieved in the past decades will continue to grow as an increasing number of firms realize the advantages of offshoring and incorporate the practice into their global business strategy. Secondly, the economic geography of the industry will continue to evolve with new countries entering the market. This can be seen in the recent advent of South Africa and Egypt to the BPO segment. Thirdly, the market is becoming
increasingly consolidated. Lead firms are expanding globally making it more and more difficult for local and regional firms to compete. Firms with captive centers are also recognizing the advantages of outsourcing services to these lead firms, such as reducing the burden of high recruitment costs and underutilized capacity, and are looking to create joint ventures. Captive centers are thus on the decline. Fourth, the KPO segment and advanced activities in specific industries will continue to grow rapidly as firms outsource their R&D functions to exploit pools of skilled labor at reduced costs, while at the same time reducing time to market for innovations and the ability to tailor goods and services to a particular market. Finally, niche markets will emerge to serve R&D requirements in different industries, offering unique opportunities for developing countries with existing industry expertise.
I.
Introduction
Prior to the turn of the century, the provision of services was restricted to on-site or face-to-face interactions. However, the information and communication technologies (ICT) revolution of the early 21st century has dramatically reshaped the industry. The traditional service model has
been replaced by remote, coordinated systems and trade liberalization around the world has meant that the ensuing fragmentation of supply has occurred not only within countries but also across borders. Marking a new stage in the evolution of the world economy, the shift of service jobs from the developed countries provides an important opportunity for developing nations to drive growth and improve both social and economic conditions.
Forced to lower costs by growing global competition, firms have been attracted to the tremendous untapped labor pools in developing countries. The considerable cost arbitrage provided by this cheap labor has propelled the offshoring of services in much the same way as it did in the manufacturing sector. The developing world has thus begun to play a significant role in providing business services to advanced industrial nations, and the industry has become a
tremendous source of employment around the globe.
Furthermore, the offshore services industry has shown important resilience to economic downturns. During the 2008-9 economic crisis, the industry maintained positive annual growth rates above 15% in different regions, despite the recession in all major industrialized nations. This contra-cyclical characteristic of the industry is the result of companies having to redesign processes and emigrate to new models of lean and efficient operations as world markets cool. If a country can maintain competitive labor costs, the industry will continue to provide a stable source of employment and income.
Given the growing importance of the industry for developing nations, this paper seeks to provide a clear understanding of offshore services in order for policy makers to effectively promote their development. First, the paper provides a general characterization of the industry, with an overview of the main segments and business models. This is followed by an analysis of the supply and demand for offshore services, focused on identifying the leading firms and economic sectors driving the industry’s growth. The final section includes an analysis of the evolution of the industry in three leading countries (India, Ireland and Eastern Europe) to identify best practices and new opportunities.
II.
The Offshore Services Industry in the World
A. Definition and Importance
Offshoring services is a new and growing phenomenon. It began in the last decade, characterized by a dynamism rarely seen in other economic activities. In 2006, estimates of CAGR (Compound Annual Growth Rate) for the years 2005-2010 were as high as 43.2%, while estimates of global revenues in the industry ranged from $101 to $157 billion in 2008
(NASSCOM, 2009b; OECD, 2008; The Boston Consulting Group, 2007). Buoyed by demand from client firms looking to further reduce their costs in order to survive, the industry has demonstrated tremendous resilience during the 2008-9 economic crisis. While the more mature supplier markets such as India saw growth fall to half of its previous levels (NASSCOM, 2009b), emerging
suppliers including Brazil1 have experienced only marginal declines in growth rates.
Defined by a McKinsey Institute’s report as “a company’s decision process of performing functions or activities anywhere in the world” (McKinsey Global Institute, 2005, p. 454), the offshore services industry specifically refers to services conducted in one country and consumed in another. Generally, the suppliers are developing countries and the buyers are developed economies. During the 20th century, these service activities were reserved for the developed world; however, over the past decade, developing economies have emerged as strong competitors with increasingly complex service offerings.
Offshoring as a business practice is not as new as it seems to be. International trade over the past two decades has been marked by the fragmentation of production processes across many countries. Specifically, this began with the relocation of production in the manufacturing sector in the mid-1980s from the United States and Europe across the US-Mexico border and to East Asia (Baldwin & Robert-Nicoud, 2008). Hence prior to the turn of the century, offshoring was characterized by the interconnection of manufacturing processes between developed and
developing countries resulting from the firm’s search for lower costs.
However, the offshoring phenomenon is no longer confined to the manufacturing sector. Today, services are increasingly tradable, fueled by the information and communication
technologies (ICT) revolution of the early 21th century (Kenney & Dossani, 2006). The remarkable
developments in this sector have resulted in lower transaction costs. By significantly reducing the cost and time required to generate, process, store and transmit information from remote locations
(Lopez et al., 2008), this has enabled the separation of service production and consumption (Sako, 2005).
Given the extraordinary growth rates of the industry, the offshoring of services has been the subject of numerous studies in recent years (AT Kearney, 2004; Dossani, 2005; Lopez et al., 2008; McKinsey Global Institute, 2005; Mullan et al., 2008; Sako, 2005; The Boston Consulting Group, 2007). In particular, its potential socio-economic impact in developed as well as
developing countries has attracted the attention of both analysts and the media around the world. In this new knowledge era, developing countries can play a significant role in the international division of labor as they supply a cheaper, yet talented workforce to provide offshore services to customers in developed countries. This allows these countries to increase their employment and also improve social conditions in the service sector (Barrientos et al., 2008).
This positive impact can be seen in India. The offshore services industry created 2.2 million jobs in 2008 (NASSCOM, 2009b). However, the vast majority of this potential is still largely untapped. The McKinsey Global Institute Labor Supply Report estimates that up to 161 million jobs can be performed remotely. It states that “any task that requires no physical or complex interaction between an employee and customers or colleagues, and requires little or no local knowledge, could be performed anywhere in the world by a suitable qualified person” (McKinsey Global Institute, 2009).
Figure 1 illustrates the significant growth prospects of the offshore services industry. The orange bars represent the adoption of offshore practices in the years 2003 (dark orange) and 2008 (light orange). In just 5 years (2003-2008), this industry has demonstrated rapid growth; however, the dark grey line presents the vast opportunities that still exist to offshore activities across different industries.
Figure 1. Actual Adoption of Offshore Practices
Source: (McKinsey Global Institute, 2009)
* Adoption of offshoring assesses the current and projected level of offshoring to low-wage countries within a sector. * Theoretical Maximum Global Resourcing Potential describes the percentage of a sector or function may be
performed remotely.
While the industry is still in its nascent stages, global employment in offshore services reached 4.1 million by 2008 (McKinsey Global Institute, 2009). This growth is driven by an increasing number of businesses procuring services abroad to improve their efficiency levels in the global economy, enter new markets and gain access to “strategic assets” in other countries (Lopez et al., 2008). They are attracted to developing countries by competitive advantages, such as low human resources costs, technological skills and language proficiency (AT Kearney, 2007), as well as similar time zones and geographical and cultural proximity to major markets (ECLAC, 2008). For example, demand for delivery centers from Indian firms in Mexico has grown due to its proximity to U.S customers, while Eastern European delivery centers support the offshoring needs of a multitude of languages and cultures across Western Europe. This permits these companies to offer nearshore services (Mullan et al., 2008). Operating in the same time zone helps to facilitate connections between countries, optimizing time and accelerating decision-making. In addition, as more sophisticated work such as new product development, R&D, and other knowledge-intensive activities are being performed abroad the supply of scientific, engineering and analytical talent
offered by developing countries becomes much more important (Duke Offshoring Reserach Network & Booz&Co., 2007).
This has important implications for countries seeking to establish themselves as destinations in the offshore services industry, especially developing countries with the adequate infrastructure and human capital. However, in order to capture significant gains from the growth of this new industry, policy makers and firms alike require a clear understanding of its dynamics. The industry is global and the scale and complexity of the activities involved require an analytical framework that disaggregates the market in a useful way. It must identify industry drivers, relations between clients and suppliers, and the power of lead firms to influence the market demand. For this reason, the following sections introduce the Global Value Chains framework, which uses firm-level analysis to determine the different stages of production of a good or service and the value level of each component. In this way, it provides decision makers with an instrument to determine where they may be best suited to enter the value chain in order to achieve their desired outcomes. B. Global Services Models
The first stage in disaggregating the global services market is to categorize services provided in a number of different scenarios based on the two dimensions of offshoring and outsourcing. These dimensions distinguish location and control over the organization contracted to perform the tasks. The first dimension, outsourcing, is the action of contracting a special function or service from a legally separate unit (outside the boundaries of the company) rather than using the company’s own internal resources and capabilities (in-house provision). The second dimension is offshoring, which is the provision of a function or service beyond the national, rather than firm, boundaries. It is this dimension that is of particular importance for policy makers and firms in developing countries.2
Figure 2 shows different business models or trajectories that may develop in the outsourcing and offshore services industry (Sako, 2005).
2 While outsourcing contributes significantly to gross domestic product in developed countries, it requires internal or
domestic demand to drive it. Most developing countries do not have sufficient demand for these internal services to be relevant factors in economic development.
Figure 2. Business Models in the Outsourcing and Offshore Services Industry
Offshoring Outsourcing
Source from Foreign Suppliers
(International trade) Domestic C or por a te B ound a ry D e c is ion Overseas Location Decision In so u rc e Out sour ce Domestic Divisions/Affiliates 1
Establishing Foreign Affiliates
(FDI and trade)
5
Source from Domestic
Suppliers
2 3
4
Source: (Sako, 2005)
The first scenario (Arrow 1) describes a firm’s decision to outsource services locally. For example, in November 2005, the Brazilian airplane manufacturer, Embraer, contracted the country´s leading IT outsourcing firm, CPM Braxis, to implement and provide on-going support of the SAP Netweaver application integration platform, the key for all IT processes within the company (CPM Braxis, 2007). This is called outsourcing.
Arrow 2 shows the firm’s decision to outsource a service to a foreign provider instead of a domestic supplier as in Arrow 1. For example, British Communications (BT) located in the UK contracted Tech Mahindra from India to provide ITO services in application maintenance and support services (Computer Business Review Magazine, 2009). This is called offshoring.
Arrow 3 shows the trajectory for firms that make the decision to outsource services to a foreign supplier. An example is the 2008 deal between the French industrial group, Saint-Gobain, and IBM that in effect sends all of the French giant’s IT infrastructure services to IBM Brazil (Triangle Business Journal, 2008). This is called offshore outsourcing 3.
Arrow 4 describes the firm’s decision to move its service provision to a foreign affiliate. This is often referred to as ‘captive offshoring’, 4 which means that the firm is sourcing from an
overseas location but maintains full control of the provision of the service. For example, Australian mining giant BHP Billiton has established a shared services center in Kuala Lumpur that will
provide all BPO services to the company’s global operations (Infante, 2009).
3 This term is frequently shortened to “offshoring”, as compared to “captive offshoring”. 4 “Captive offshoring” is also referred to as “shared services centers” in the literature.
The final scenario is mapped by Arrow 5. This shows the shift from service provision by a foreign affiliate to provision by a foreign supplier. Generally, this may occur with the sale of foreign affiliates to a third party provider. In the process of changing from ‘captive offshoring’ to ‘offshoring’ “host economies are likely to benefit from greater beneficial spillovers in terms of technology and higher skilled jobs” (Sako, 2005, p. 6). One of the best known examples of this is the spinoff of General Electric’s captive center, Gecis, in India in 2004 in a sale to two private equity firms (McDougall, 2004). The firm, now known as Genpact, is one of India’s leading suppliers in the offshoring industry.
The process of choosing a business model, that is, determining a firm’s geographic location and level of control, is not a simple decision and depends on several factors, including the nature of the service, size of investment required, entrepreneurship, local knowledge of the firm and internal experience, among others (The Boston Consulting Group, 2007). The following sections of this paper will refer to the offshoring categories of global services model.
III.
Offshore Services Global Value Chain
A global value chain identifies all aspects of the production of a good or service and measures the different values at each stage. Once this has been established, it is possible to identify which firms participate in the industry, understand the relationship between supply and demand, and in turn, determine the most important regions of the world in the industry’s
development.
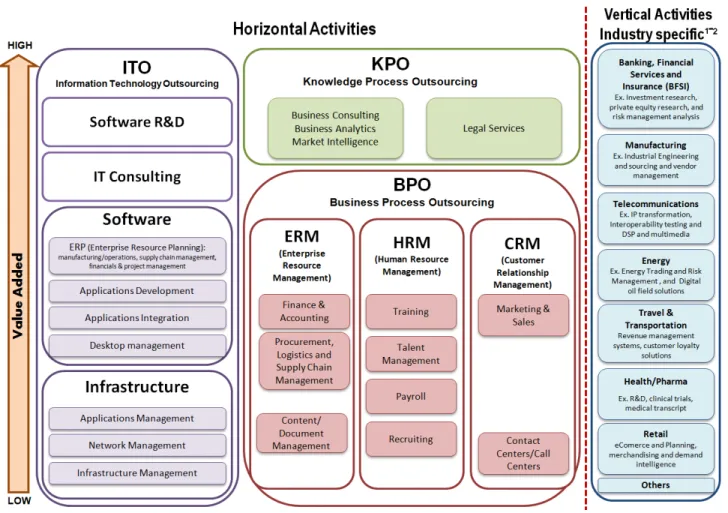
While the offshore services industry has evolved substantially over the past decade, and continues to do so today, three main segments can be identified: Information Technology
Outsourcing (ITO), Business Process Outsourcing (BPO) and Knowledge Process Outsourcing (KPO). However, establishing a global value chain for the industry is challenging not only due its rapid evolution but also the wide variety of services that it has come to include as companies become more comfortable with and recognize the benefits of vertical disintegration. In order to establish meaningful categories of economic activity, the industry is first subdivided into services that can be provided across all industries (horizontal services) and those services that are industry specific (verticals). Firms operating in the horizontal services must be process experts, while those in the vertical chains must have industry expertise and their services may have limited applicability in other industries.
Within the horizontal services, all activities are related to supporting generic business functions such as network management, application integration, payroll, call centers, accounting and human resources. In addition, they include higher value services such as, market intelligence, business analytics and legal services. For the purposes of this paper, these higher value horizontal services are referred to as Knowledge Process Outsourcing5. Figure 3 shows the main segments
and activities of the offshore services value chain.
5 The term KPO was introduced by certain companies such as Evalueserve to describe activities that are more
advanced than BPO (Sako 2009a). Higher value added activities in specific industries (vertical activities) will be referred to as advanced activities. For a further discussion about the KPO term, please see Appendix D.
Figure 3. Offshore Services Value Chain
Source: CGGC
¹ Vertical Activities- Industry specific: Each industry has its own value chain. Within each of these chains, there are associated services that can be offshored. This diagram captures the industries with the highest demand for offshore services.
² This graphical depiction of vertical activities does not imply value levels. Each industry may include ITO, BPO and advanced activities.
Note: For in-depth descriptions of each category, please see Appendix C.
Within horizontal services, ITO make up the low, mid and high segments of the offshore services value chain, BPO activities are in the low and mid segments while KPO are considered the highest segment of the chain. The value of each activity is correlated with human capital (education level), that is to say, lower value-add services are performed by people with fewer years of formal education. Call centers or routine BPO activities, for example, are performed by employees with just a high school diploma. Market research or business intelligence is typically carried out by employees with a minimum of a Bachelor’s degree if not a more advanced one, while the highest-level research and analysis is carried out by employees holding specialized masters degrees or PhDs.
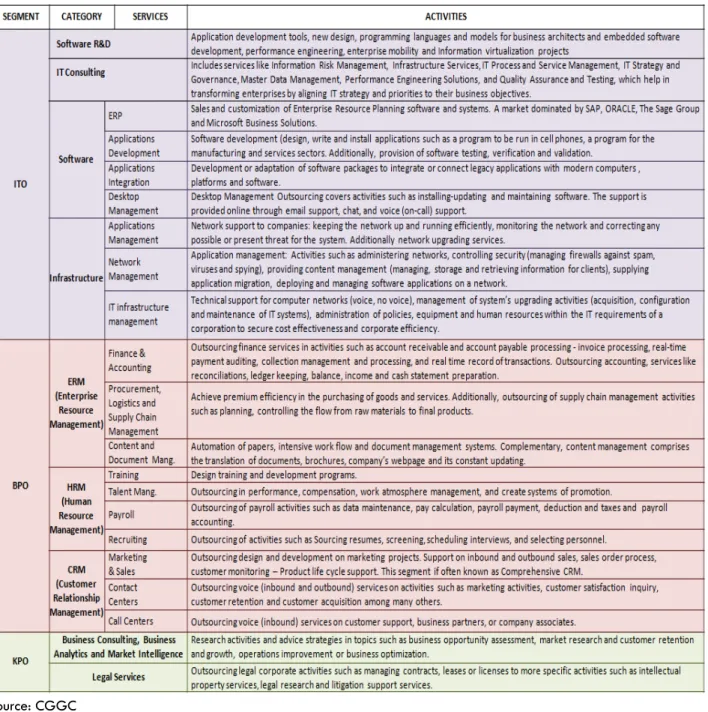
Table 1 introduces a detailed explanation of the different activities in each segment of horizontal services in the value chain. The ITO segment is made up of four categories. The first category is software R&D, the second is IT consulting, the third is software and includes activities such as ERP (Enterprise Resource Planning -software development for Enterprise Resource Management activities), applications development, applications integration and desktop
management, while the infrastructure category is composed of applications management, network management and infrastructure management. The BPO segment contains three main categories. The first category is Enterprise Resource Management (ERM) consisting of: finance & accounting; procurement, logistics and supply chain management; and content and document management. The second category is Human Resource Management (HRM) made up of training, talent management, payroll and recruiting. Customer Relationship Management (CRM) is the last
category, being composed of marketing & sales, contact centers and call centers. Finally, the KPO segment includes business consulting, business analytics, market intelligence and legal services. For in-depth descriptions of each category, please see Appendix C.
Table 1. Offshore Services Horizontal Activities
Source: CGGC
Note: For in-depth descriptions of each category, please see Appendix C.
Due to the broad range of activities that can be offshored in different vertical industries, vertical services have not been included in this table.
In contrast, vertical services include a variety of activities that are offshored by different industries but are not related to general business functions and require specific industry
knowledge. Examples of these services include functions performed for the pharmaceutical industry such as clinical trials, or R&D for new consumer products. These services are currently provided along the length of value chains and, as with firms searching to lower costs in non-core
business activities, firms are seeking out low cost locations for low value services and high talent locations for high value services.
The relative value of vertical services is determined using the same human capital proxy as those for horizontal services. Activities lower in the value chain, such as check processing in the financial services chain, only require employees with high school education and a minimal training on the software required for processing (Mongillo & Tasner, 2009). In the pharmaceutical value chain, clinical trials monitoring requires both qualified nurses and doctors (Rigotti et al., 2009); however, the highest level of activities in this chain which involves the identification of the
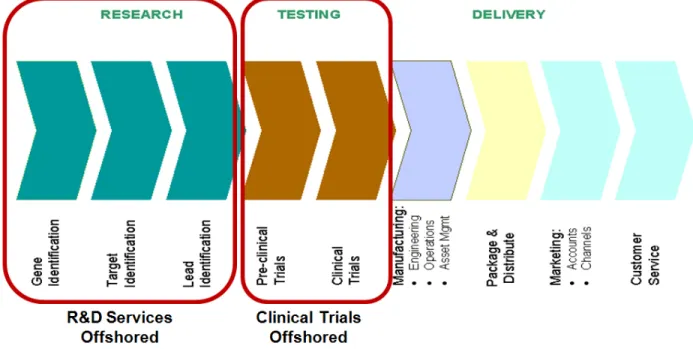
molecules to be used in medications is carried out by scientists with doctoral degrees and years of experience. These vertical higher value added activities are not consistently referred to as KPO activities and so in this report they are advanced activities. Figure 4 illustrates the offshore opportunities for the pharmaceutical value chain. A similar chain should be established for each vertical industry in order to fully identify opportunities for to exploit.
Figure 4. Offshore Services in the Pharmaceutical Value Chain
A further challenge in the analysis of the offshoring of vertical services is the differing pace and scale of the practice across industries. The financial services and banking sector have led the demand for vertical services to date, followed by manufacturing, telecom, health care,
transportation and energy.6 The high demand from these industries means that some supply firms
provide both horizontal services as well as services specific to certain industries.7 Examples
include Tata Consultancy Services that offers check processing services for the banking sector in addition to ITO services in all industries, or Evaluserve that provides equities research and other analytics for investment banks while at same time offering intellectual property and patent application services in all market sectors (Srivastava & Ortiz, 2009).
Furthermore, a recent trend has seen growth in the area of offshoring in the highest portion of many different industry value chains – that is in research and new product development. Research and development offshoring was initially driven by the need to reduce both cost and risk from the R&D activities while increasing company flexibility and addressing resource challenges. However these drivers have changed over the years. Companies now consider R&D outsourcing a value adding activity that will generate revenue with access to the worldwide skills and capabilities to improve existing products and services and accelerate new R&D, rather than simply reducing costs (Jaruzelski & Dehoff, 2008).
A. Upgrading in the Offshore Services Industry
The evolution of this industry has been highly dynamic as client firms have become
increasingly comfortable with vertical disintegration, demanding more services from their suppliers while supply firms have been able to develop new competencies to meet those demands (Mulder et al., 2007). Within the global value chain framework, this evolution is referred to as upgrading. Four types of upgrading can be expected to develop: functional, process, product, and inter-sectoral (Humphrey & Schmitz, 2002).
First, functional upgrading is acquiring new functions to create higher value-added services (higher skill content in the activities). Examples of this moving up the value chain are included below:
• The shift of large IT manufacturing companies to the IT services industry. In a clear example of functional upgrading, a number of the world’s leading offshore services firms
6 See section on Supply and Demand for a further discussion of the demand by industry for offshoring services. 7 As is explained later in this report, as firms gain experience exporting services through a Global Delivery Model,
including IBM, Tata Consultancy Services (TCS) and WIPRO began as large computer manufacturers before shifting into the services industry (see Box 1, IBM Evolution). Another example is the firm ADP that upgrade it activities from computer manufacturing
(mainframe computers and check printing machines) to become a leading provider of human resources outsourcing including benefits and payroll administration (ADP, 2009; IBM, 2009).
• Evolution of Indian firms from ITO to BPO and several have now embarked into KPO. For example, having consolidated the company as a leading BPO service provider with 21,000 employees and annual sales of $460 million, WNS launched their Knowledge Services division in 2003, hiring 300 MBAs and PhDs in response to demands from clients (PR Newswire, 2003). Genpact is another example of an Indian firm moving upwards from BPO to KPO. Initially the BPO operation of GE in India, the company expanded aggressively and today has 1,500 analysts with advanced degrees providing Risk Analysis, Customer Analytics, Market Research and Business Intelligence services from delivery centers in India. Finally, Indian ITO firm, Patni set up a joint venture, Bohdi Global, with prestigious Indian law firm, AZB, in order to provide legal processes support services for both corporations and law firms (Sako, 2009b).
• Specialization of offshore services companies. Top offshore services companies started providing simple and generic activities evolving to offering advanced activities - highly specialized services for specific industries. For example Tata Consultancy Services (TCS) has six R&D labs (Engineering & Industrial solutions, Insurance, Telecom, Travel&
Hospitality, Retail, and IT). TCS has 40 patents and more than 200 applications pending (Tata Consultancy Services, 2009b).
Box 1. Evolution of IBM
Originally, a hardware and components manufacturer, IBM has evolved continuously over the last 100 years. In 2008, revenue from its hardware division accounted for only 9%, while the software
accounted for 40% and services 42% of the total revenue. During the 1990s IBM started offering services; not only after-sales activities, but services to assist customers in their ongoing business operations, and in the early 2000s, IBM launched its management consulting and business process outsourcing services unit. In 2006, IBM opened its first Electronics Innovation Center as an extension of Tokyo Research Lab. It also opened centers of excellence in China, Mexico and India in 2008 and started collaborative research programs with many top schools in the world.
Source: (Datamonitor, 2008a; IBM, 2002, 2009)
Secondly, process upgrading is either the introduction of new technologies in the production system or the restructuring of the existing system to generate services more efficiently.
• Citibank has improved its customer services by creating a 'service equation' “where processes, organizational initiatives and operational and technological tactics are aimed at integrating technology development with improvements in customer service” (Mathe & Dagi, 1996, p. 454).
• When Infosys launched its consulting firm, Infosys Consulting, in 2004, they applied the global delivery model that they had refined in the ITO sector to improve upon the
traditional consulting company model, essentially allowing them to deliver their projects at a much lower cost than the competition (William F. Achtmeyer Center for Global
Leadership, 2008).
• The Capability Maturity Model (CMM) certification was created in 1989 with the purpose of developing and refining software development processes. However, CMM evolved,
being replaced by CMMI (Capability Maturity Model Integration) in 2007. Software development companies throughout the world adopted CMM as a quality certification. Alternatively, CMMI is a process improvement approach that aims to increase efficiency and quality of processes and functions applied to any sector, as opposed to just software (Software Engineering Institute, 2009).
• Softtek has introduced the Six Sigma Program, a customer-focused and data-driven management method, to improve business processes and problem resolution (Softtek, 2009).
Third, product upgrading is increasing the complexity of the product or service offered, moving into more sophisticated services.
• Capgemini encourages new clients to adopt their standardized BPO services rather than creating new teams specialized in the clients’ former model. This allows the client to benefit from the economies of scale of the firm as well as a more highly refined process that has evolved through countless iterations with previous clients (Mongillo & Tasner, 2009).
Finally, inter-sectoral upgrading is acquiring knowledge or competence from a particular function to implement them in another sector (Humphrey & Schmitz, 2002).
• ITO firms leverage Global Delivery Model to provide R&D services to different industries. Software companies in India have transformed their supply of low-skill software services to providing high-skill R&D services. This movement shifted them from a low value added activity in ITO to a higher value-added function in vertical chains. Examples include: TCS -- building on the strengths of sister companies in the TATA Holding Group, the company has established Innovation Centers focused on the automotive and aeronautical industries (Tata Consultancy Services, 2009b); KPIT Infosystems was acquired by Cummins in 2002 in order to leverage their success as a ITO provider for the high-tech and auto industry (KPIT Cummins Infosystems, 2009); and Wipro, which through the
acquisition of Ericsson´s R&D unit in 2002 established a Center of Excellence in Innovation and R&D specifically for the telecommunications industry (Wipro Limited, 2008).
• The expansion of firms across vertical chains. Computer Science Corporation began providing software for the aerospace industry; it then expanded into financial services and manufacturing in the 1990s and today services a broad range of industries such as communications, media and entertainment, retail, transportation, manufacturing and
government (CSC, 2009). Infosys began as a specialist in the financial sector and today, like CSC, has clients in all industries. Table 2 shows a list of providers offering services in different industries.
Table 2. Offshore Service Companies by Vertical Activities
Company Name
Banki
ng, Financial
Services and Insurance (BFSI) Manufacturing Telecommu
nications
Energy Travel & Transportation Health/Pharma Retail Others
Electronic Data Systems X X X X X X X
Accenture X X X X X X X
IBM Global Business Services X X X X X X X
Computer Sciences Corp X X X X X X X X
Automatic Data Processing X X
Capgemini X X X X X X X
Logica X X X X X X X
Affiliated Computer Services X X X X X X X
Tata Consultancy Services X X X X X X X X
Wipro Technologies X X X X X X X X
Infosys Technologies X X X X X X
CGI Group X X X X X X
Hewitt Associates X X X X X X X X
Cognizant Technology Solutions X X X X X X X
Convergys Corporation X X X X X X X
Perot Systems X X X X X
Teleperformance Group X X X X X X X X
Satyam Computer Services X X X X X X X X
HCL Technologies X X X X X X X X
SITEL X X X X X X
B. The Current State of the Global Offshore Services Industry 1. Size of the Industry
The global offshore services industry is growing substantially. However, there is no consensus on how to collect data that corresponds to appropriate definitions of services in this industry (Sako, 2005). Measuring offshore services is not a simple task because official statistics do not provide accurate or comprehensive quantitative information (ECLAC, 2009; Sturgeon & Gereffi, 2009).
While the market estimates for this industry may vary because of the different
methodologies adopted, there are a number of different institutions that have published their estimates. Table 3 provides a list of estimates from private consulting firms, business associations and international organizations. These figures vary significantly due to the lack of the official data available. Generally, countries do not have data for these types of service exports and there are no detailed trade categories to track this information. Additionally, companies have little incentive to disclose this information.
Two clarifications must be made at this stage:
1. Outsourcing vs. offshoring: Some organizations, such as Gartner, have measured the entire outsourcing industry; this refers to both domestic outsourcing and offshore
outsourcing. The numbers for outsourcing are generally higher as they include offshoring services. Another set of organizations, such as OECD, BCG, and NASSCOM-Everest, have measured only offshore services.
2. Activities included: This paper presents three types of industry segments: ITO, BPO and KPO plus industry-specific higher value activities. The estimates in the table may refer to one, two or all of the categories. Some provide estimates for just the ITO and BPO segments (i.e., the McKinsey estimate), while the other estimates include KPO in the BPO category. (This is the case of the Gartner and BCG estimates.) Generally, the KPO segment and advanced activities industry specific are the most difficult to quantify and it may be underrepresented since some relevant activities may not be included.
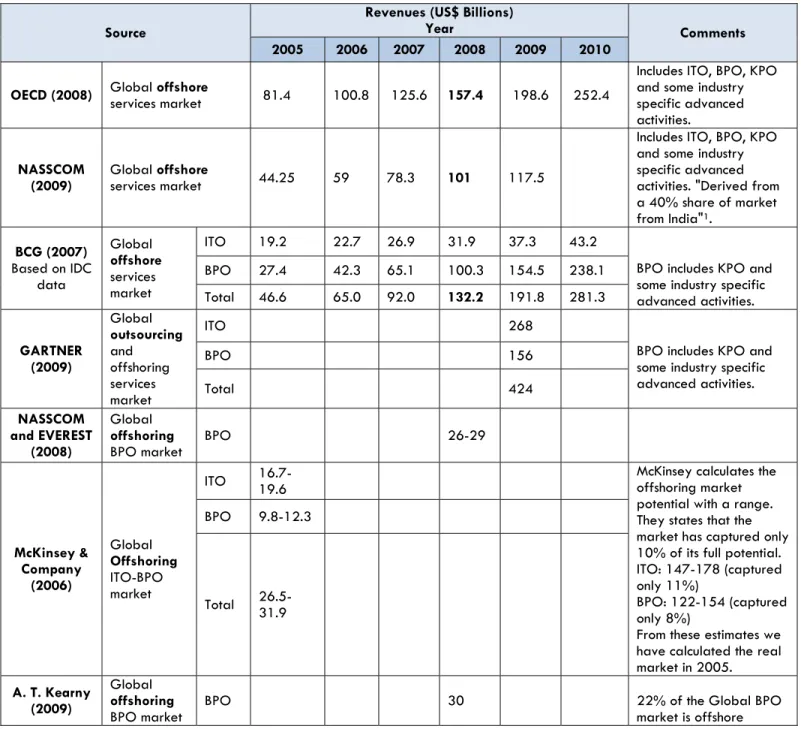
This paper focuses specifically on offshore services; the estimates for this particular industry are from NASSCOM, Boston Consulting Group (BCG) and OECD, ranging from a low of US$ 101 billion (NASSCOM) to a high of $157 billion (OECD) in 2008.
Table 3. Global Offshore Services Market Size Source
Revenues (US$ Billions)
Year Comments
2005 2006 2007 2008 2009 2010
OECD (2008) Global offshore
services market 81.4 100.8 125.6 157.4 198.6 252.4
Includes ITO, BPO, KPO and some industry specific advanced activities.
NASSCOM
(2009) Global services market offshore 44.25 59 78.3 101 117.5
Includes ITO, BPO, KPO and some industry specific advanced activities. "Derived from a 40% share of market from India"¹. BCG (2007) Based on IDC data Global offshore services market ITO 19.2 22.7 26.9 31.9 37.3 43.2
BPO includes KPO and some industry specific advanced activities. BPO 27.4 42.3 65.1 100.3 154.5 238.1 Total 46.6 65.0 92.0 132.2 191.8 281.3 GARTNER (2009) Global outsourcing and offshoring services market ITO 268
BPO includes KPO and some industry specific advanced activities. BPO 156 Total 424 NASSCOM and EVEREST (2008) Global offshoring BPO market BPO 26-29 McKinsey & Company (2006) Global Offshoring ITO-BPO market
ITO 16.7-19.6 McKinsey calculates the offshoring market potential with a range. They states that the market has captured only 10% of its full potential. ITO: 147-178 (captured only 11%)
BPO: 122-154 (captured only 8%)
From these estimates we have calculated the real market in 2005. BPO 9.8-12.3 Total 26.5-31.9 A. T. Kearny (2009) Global offshoring BPO market
BPO 30 22% of the Global BPO market is offshore
Source: CGGC based on OECD 2008, NASSCOM 2009, Boston Consulting Group 2007, Gartner 2009, NASSCOM-Everest 2008, McKinsey & Company 2006, A.T. Kearney 2009.
¹Based on the reports from Boston Consulting Group (2007) and the Nasscom-Everest study in 2009. BCG estimated that Indian market share was 46% in 2007, while Nasscom-Everest estimate lies between 41% and 46% (Nasscom, 2008).
According to OECD estimates (2008), the size of the offshore services market will reach $252 billion in 2010. They stress, however, that growth rates will be different in each segment
(See Figure 5). The study projected that the global demand for BPO services, especially those related to call centers and the financial services industry, is expected to triple between 2005 and 2010 and IT services are expected to continue growing at a similar pace. The KPO segment and industry specific advanced activities are expected to reach $31 billion by 2010. This growth translates into a compound annual growth rate of 58% between 2005 and 2010, much more than what is expected for the demand of the BPO (25%) and ITO (26%) segments. However, the 2008-2009 global economic crisis has impacted the industry, slowing growth and making it increasingly difficult to quantify potential growth moving forward. The effect on the industry has been uneven with a CAGR of 16% for 2009 in India (NASSCOM, 2009b), while countries such as Brazil did not present any negative outcome from the crisis with a CAGR of 36% for 2009 (Global Services, 2009).
Figure 5. Global Demand of Offshore Services by Activity
29.3 93.1 19.3 58.8 3.1 31 5.8 19 9.9 14.5 4.1 12.4 5.9 11.4 3.2 11 2005 2010(e) IT Products
Localization and language services call centers
Engineering/Technical support centers Content development and managemnet R&D Engineering KPO Services BPO Services ITO Services 05‐10 CAGR 7% 28% 14% 25% 8% 27% 58% 25% 26% Source: (OECD, 2008)
2. Supply and Demand Demand
As can be seen by the varied growth in the different service segments in Figure 5, demand in the industry is being driven in a number of different ways that are evolving over time. This demand can be analyzed at three levels: geographic, firm and industry.
Geographic Level:
The industry to date has been led by the United States and Canada, the first region to offshore services. While estimates of the region’s market share vary from over 70% of global demand (The Boston Consulting Group, 2007) to 51.1%, it is clear that North America still the industry leader. North America is followed by Europe (30.6%), Asia (16.2%) and the rest of the world (2.1%) (Datamonitor, 2009)8.
Emerging Trends:
• Demand patterns in the rest of the world (2.1%) tend to follow the geographic distribution of multinational firms looking to support regional operations. Time zone constraints,
language requirements and cultural affinity with their clients and subsidiaries favor
regional centers rather than one global center. Examples of this include Unilever’s decision to initially set up BPO shared centers in Brazil and Chile to provide finance and accounting support services for operations in 19 Latin American countries (Mongillo & Tasner, 2009).
• There is growing demand for services from the new southern multinational corporations (MNCs). These firms, headquartered in the developing world, account for 26% of the Forbes Global 2000 firms (The Forbes Global 2000, 2009). Many consultants, academics, and IT and BPO outsourcing firms have overlooked these in the past, seeing the developed world as their natural market. However, the developing country market is beginning to grow. Examples include a new BPO center established by WIPRO in Curitiba, Brazil in November 2008 to provide finance and accounting, procurement and HR services to its new client AmBev, Latin America’s largest brewery company. The delivery center will go on to provide services for other clients around Latin America (Business Line, 2008).
Firm-Level Demand:
Demand for offshore services is led by large firms and MNCs with burgeoning global operations. The magnitude of their activities and the complexity of their infrastructure and systems led to significant operational costs, which, in turn, impacted their competitiveness. These high overhead expenses pushed the MNCs to look for strategies to reduce costs, including establishing captive centers in low-cost countries or alliances with outsourcing providers (third party
contractors) ((Dossani, 2005; Mullan et al., 2008). This demand is reflected by the fact that most of the leading ITO and BPO companies in the world have those large corporations as their natural market.
Emerging Trends:
• Small and medium-sized firms are beginning to offshore certain services. By 2006, small firms accounted for more than 30% of companies initiating outsourcing processes, while in 2000 less than 10% of small companies offshored services (Duke Offshoring Research Network & Booz&Co., 2006). Partly due to requirements from venture capital firms that they include offshoring in their business models, these small firms are beginning to see the value in offshore practices. Given that many service providers have set up operations around the world to support large clients, small firms are thus able to find providers in locations that are convenient for their businesses. These firms make up the largest share of clients for higher value added services; 24% of the services they outsource are for new product development compared with 16% of large corporations (Lewin & Cuoto, 2007). Small and medium-sized tend to be more flexible than large firms, and can make the most of new technologies being developed by the offshore providers as they are not hindered by large legacy systems as are many MNCs.
Industry-Level Demand:
Demand levels differ by industry. The financial services industry and the manufacturing sector lead the demand for offshore services, representing 32% and 20% respectively. These are followed by telecom (12%) and energy9 (11%). Figure 6 below shows industry participation in
the outsourcing market based on a survey by contracts for over $25 million (Technology Partners International, 2008).
Figure 6. Industry Participation in the Offshoring Market
Financial Services 32% Manufacturing 20% Telecom 12% Energy 11% Travel & Transport 7% Retail 5%
Health Care & Pharma 5% Business Services 5% Media & Entertainment 3%
Source: (Technology Partners International, 2008).
Emerging Trends:
• As costs rise for the pharmaceutical industry in developed countries, they are exploring Latin America, Eastern Europe and Asia as offshore locations for clinical trials and R&D. Offshore clinical trials expenses in the developing world are about one-tenth of western levels, while R&D costs are about one-eighth of U.S. costs (Rao, 2008). Other advantages include extensive native patient populations, trained scientists and a large pharmaceutical presence. Spending in research and development reached $97.8 billion in 2006 while in 2007 this figure increased to $109 billion, representing a growth of 12.8%. (Jaruzelski & Dehoff, 2008). Innovation activities are beginning to move to the developing world. According to McKinsey & Co, the major global pharmaceutical companies will invest around $1.5 billion in India alone by 2010 (Maiti & M, 2007).
• In 2006, R&D spending in all industries increased with the exception of the automotive industry. Along with health care, software and the internet sector are the fastest growing industries in R&D spending, maintaining a strong year-on-year growth rate since 2001. Although growth has slowed slightly in the computer and electronics sector, it remains the largest R&D sector spending $142 billion on innovation in 2007(Jaruzelski & Dehoff, 2008).
Supply
The supply of global services is highly concentrated amongst a small group of firms from a handful of countries. As shown in Table 4, thirteen of these firms are headquartered in North America, four are headquartered in India and three are based in Europe.
Table 4. Top 20 Offshore Services Providers
# Company Sales 2008 Total
(US$ Mil)1
Total Employees2
Total Services Sales 2008
(US$ Mil) Main Services Activities
1 IBM – US 103,630 398,455 58,892 Consulting, IT services, application and outsourcing services
2 Accenture – US 23,171 177,000 23,171 Consulting, IT and outsourcing services
3 CorporationElectronic Data Systems (EDS, now HP
Enterprise Services) -US 22,100 139,500 22,100 IT, applications and BPO services
4 Corporation (CSC) - Computer Sciences US 16,740 92,000 16,740
ITO (software management) BPO in CRM, supply chain management and KPO in legal matters
5 Capgemini- France 12,740 89,453 12,740 Consulting, IT and outsourcing services
6 Processing (ADP) - Automatic Data US 8,867 45,000 8,867 BPO (human resource, payroll, tax and benefits outsourcing) 7 Affiliated Computer
Services – US 6,523 76,000 6,523
ITO and BPO in CRM and HRM. Also e-Government
8 LogicaCMG) Logica (Formerly – UK 6,577 39,525 6,320 Business consulting, IT and BPO services 9 Tata ConsultancyServices – India 6,048 111,407 5,824 Consulting, IT, engineering and BPO (includes KPO) services 10 Infosys Technologies - India 4,717 105,453 4,533 IT, engineering, consulting and BPO services (knowledge and legal services) 11 Wipro Technologies - India 5,645 98,521 4,234 Consulting, IT and BPO services 12 CGI Group - Canada 3,673 25,500 3,673 Consulting, IT, BPO and systems integration services 13 Hewitt Associates - US 3,228 23,000 3,228 Human resource consulting and outsourcing 14 Cognizant Technology Solutions - US 2,816 68,000 2,816 Consulting, IT and BPO services 15 Convergys CorporationUS – 2,786 75,000 2,786 BPO (Customer Care - Call Centers)
16 Perot Systems –US 2,779 23,100 2,779 Consulting, IT and BPO services
17 Teleperformance GroupFrance – 2,605 102,186 2,605 BPO (Customer Care - Call Centers)
18 SITEL – US 1,700 66,000 1,700 BPO (Customer Care - Call Centers)
19 Ceridian Corporation - US 1,695 8,776 1,695 Payroll services & Human Resources management solutions
20 Genpact Ltd. - India 1,041 36,200 1,041 IT and BPO services
TOTAL 240,210 1,815,519 192,267 --
Source: CGGC based on OneSource, companies’ websites and companies’ annual reports.
The large global service providers operating in the offshore industry include IBM, , Accenture, EDS (HP Enterprise Services) CSC and Capgemini, which are principally dedicated to serving large multinational corporations and governments (Datamonitor, 2009). All of these firms have operations in developing countries that serve as platforms for services exports. In 2007,
Accenture employed more persons in India than anywhere else in the world. IBM had 60,000 employees in India in 2006 while CapGemini had 12,000 in the same year (Dossani & Kenney, 2007).
At a country level, it can be seen in Figure 7 below, the most mature providers of offshore services (in green) are India and the Philippines, with over 50 centers in each country, followed by emerging nations (in yellow) including Chile, Poland and Malaysia. In addition, there are new locations that are beginning to compete in the industry (in red), such as South Africa, Morocco and Egypt.
Figure 7. The Global Supply and Demand for Offshore Services
Source: CGGC based on data from Everest and Datamonitor.
India continues to be the global leader in the offshore services industry. Total offshore services sales were US$46.3 billion (NASSCOM, 2009c), and the largest 10 Indian suppliers reported US$26.1 billion in total sales. Table 5 provides more detailed information about each company. Remaining sales in India are driven principally by the other lead companies with large delivery centers in the country including IBM, Accenture, EDS and Computer Science Corporation
as well as smaller indigenous companies such as MindTree, NIIT Technologies and KPIT Cummins Infosystems10.
Table 5. Top 10 Indian Offshore Services Companies
Company Sales – 08
(USD mil) Employees
Total Services Sales 2008 (US$ Mil)
Tata Consultancy Services (TCS) 6,048 111,407 5,824
Infosys Technologies 4,717 105,453 4,533
Wipro Technologies 5,645 98,521 4,234
HCL Technologies 1,879 54,026 1,879
Genpact Ltd. 1,041 36,200 1,041
Tech Mahindra 963 24,972 963
Patni Computer Systems 746 14,894 746
WNS Global Services (India 539 21,494 539
MphasiS Ltd.(A Hewlett Packard
Company) 455 28,795 416
Polaris Software Lab Limited 300 9,238 300
TOTAL 22,923 520,443 21,604
Source: CGGC based on OneSource, NASSCOM, companies’ websites and companies’ annual reports.
Lead Firm Characteristics
Most lead firms are present in both the ITO and BPO segments and operate at a global scale with a similar business model generally referred to as the “global delivery model” (Sako, 2009b; Tata Consultancy Services, 2009a; William F. Achtmeyer Center for Global Leadership, 2008) This consists of a global network of customer support offices, specialized delivery centers in lower cost countries and the headquarters . This structure allows global service companies to be close to their clients and understand what they need, and at the same time to undertake projects with multidisciplinary experts from different parts of the world. For example, Tata Consultancy Services has established global delivery centers in Beijing, Mexico and Hungary amongst other places; WIPRO, the next largest Indian provider, serves clients in different markets by connecting and coordinating activities between more than 60 delivery centers in the world with the help of customer support offices and the headquarter in India. The more traditional companies such as
10 Analysis of the Indian offshore services industry is based on information gathered from NASSCOM, Hoovers,
IBM and Accenture have adjusted their business models in order to compete with the new firms emerging from India. IBM now has delivery centers in over 50 countries, including China, India and Mexico (IBM Global Business Services, 2009). Figure 8 below provides an example of how these companies operate.
Figure 8. Business Model of an Indian Offshore Services Provider
• Headquarter: Corporate offices where most of the important administrative functions of the organization are carried out. It is not uncommon for offshore services providers from developing countries to have delivery centers attached to their headquarters.
• Delivery center: The facility where services are developed tailored for each client and executed. These offices are almost always located in developing countries.
• Customer support offices: These are principally sales and customer service offices. They provide a direct point of contact with the client to develop an understanding of client needs.
Source: CGGC based on Indian offshore service company delivery models.
The customer support offices play a central role in the daily operations of a global services company. Specialists develop close ties with their customers, giving support for current service offerings as well as identifying and codifying future needs. This information is then sent to the delivery centers (sometimes referred to as centers of development), where services are further tailored and executed. Standardized operating and telecommunications systems aroud the globe
facilitate the transfer of the information.11 This system allows companies to be close to their
customers while taking advantage of the economies of scale generated by dedicated delivery centers.
Beyond these large firms, the market is divided into medium to small providers competing for local and regional clients (Datamonitor, 2009). These firms specialize in providing BPO services to vertical chains such as health care, the insurance industry or the financial sector.
Promantra Synergy Solutions, for example, has less than 500 employees. The company serves the vertical BPO market (BPO in Health Care) delivering services such as billing and revenue cycle management and BPO services in finance and accounting, as well as some advanced services such as cost report analysis and financial decision support (Promantra, 2009).
KPO Segment
Still very much a nascent part of industry, the KPO segment is more evenly balanced between small to medium providers and large firms.12 While the firm size is typically a fraction
of that of the BPO firms, these companies have leveraged the success of the same global deliver model. The leading firms have customer support offices in the US (New York and Boston), Europe (Germany and the UK) and Asia (Singapore and Hong Kong), with delivery centers in India (Bangalore, Mumbai, and New Delhi) and the Philippines (Sako, 2009a) .Evalueserve, one of the first firms to begin to provide KPO activities, now has delivery centers in India, China, Chile and Romania (Gupta, 2009), suggesting that these firms may eventually follow the same expansion pattern as BPO providers model in order to offer services 24/5 days a week.
y
11 Global operating and telecommunications systems are dominated by Cisco, Microsoft, SAP and Oracle. 12 The top 10 companies have on average, over 50,000 employees; the larger KPO firms have 1,500-2,000
Table 6. Companies offering KPO Services
Company s (US$ million) Employees Revenue/Sale Business Services
Gartner, Inc. 1,270 4,000 Research services, consulting services and executive education programs
Genpact 1000 36,000 Business analytics and finance research services
WNS 460 21,000 Business analytics, financial research and industry research services
Forrester Research, Inc.
240 1000 Proprietary research, consumer insight, consulting, events and peer-to-peer executive programs to clients
Evalueserve 68 2431 Business research, IP and legal services, market research, investment research and data analytics
Integreon Managed Services
36 2000 Research and analytics, legal and financial document services, legal and discovery services, and finance and accounting services
CPA Global 33.5 1,200
Document management solutions, patent research or intellectual property support services, and litigation services like legal research and preparation of standard litigation documents and deposition summaries
Pangea3 5 270 Patent drafting and litigation services, contract drafting and management systems, document review services and legal research and support services
Fractal
Analytics NA 120 Advanced analytics, CRM analytics, risk analytics and marketing optimization
Boston
Analytics NA 50 Business analytics, focusing on providing consulting and financial services Source: (Sako, 2009a and companies' websites)
Table 7 shows a list of major companies and the offered activities. As can be seen, firms are providing a variety of activities in each segment leveraging the global delivery model.
Table 7. Companies by Activity
Source: CGGC based on OneSource, Hoovers, Annual Company Reports, Global Services reports, Gartner, the Black Book of Outsourcing reports and companies’ websites.
1 Comprehensive F&A: Provision into the same contract of activities such as accounts payable, accounts receivable,
general ledger, tax management and cash management.
2 Comprehensive CRM: Blends sales, marketing, customer service and other supporting activities.
Software R&D IT Consul
ting Applic ations De ve lopment Applic ations I n gration te Desktop M anag ement Infrastr ucture Manageme nt Applic ations M a nagement Network Mana g ement Conten t and Doc ument Manageme nt Compre h ensi ve F & A 1 Procurement and Supply Chain M a nagem ent
Payroll and Benefit Adminis
t n ratio Recruiti ng Trainin g and Comprehensi ve Human
Resources Call Cen
ter Conta ct Cen ter Comprehensi ve CR M 2 Company Name
1. ITO 2. BPO 3. KPO
Software Hardware ERM Enterprise Resource Management HRM Human Resources Management CRM Customer Relationship Management Business Cons ulti ng; Business Analyt ics; Mar ke t Intellige nce Legal Services
Software R&D IT Consul
ting Applic ations De ve lopment Applic ations I nte gration Desktop M anag ement Infrastr ucture Manageme nt Applic ations M a nagement Network Mana g ement Conten t and Doc ument Manageme nt Comprehensi ve F & A 1 Procurement and Supply Chain M anagem ent
Payroll and Benefit Adminis
tratio n Recruiti ng Trainin g and Comprehensi ve Human
Resources Call Cen
ter Conta ct Cen ter Comprehensi ve CRM 2
Electronic Data Systems X X X X X X X X X X X
Accenture X X X X X X X X
IBM Global Business
Services X X X X X X X X X X X X X X
Computer Sciences Corp X X X X X X X X
Automatic Data Processing X X X
Capgemini X X X X X X X X
Logica X X X X X X X X
Affiliated Computer
Services X X X X X X X X
Tata Consultancy Services X X X X X X X X X X X X
Wipro Technologies X X X X X X X X X X X X X Infosys Technologies X X X X X X X X X X X X X CGI Group X X X X Hewitt Associates X X X Cognizant Technology Solutions X X X X X X X X Convergys Corporation X X X X X X Perot Systems X X X X X X X Teleperformance Group X X
Satyam Computer Services X X X X
HCL Technologies X X X X X X X X X SITEL X X X Ceridian Corporation X X Genpact X X X X Hov Services X X Manpower X X TalentFusion X 24/7 X X WNS Global Services X X Epitome X Smart Cube X Evalueserve X X