Systems
Musa Abubakar Muhammad
Mobile Cognitive Systems (MCS) Research Group, Cyber TechnologyInstitute, De Montfort University The Gateway, Leicester
United Kingdom [email protected]
Aladdin Ayesh
Mobile Cognitive Systems (MCS) Research Group, Cyber TechnologyInstitute, De Montfort University The Gateway, Leicester
United Kingdom [email protected]
Isabel Wagner
Cyber Security Center, Cyber Technology Institute, De MontfortUniversity The Gateway, Leicester
United Kingdom [email protected]
ABSTRACT
Network Access Control (NAC) systems manage the access of new devices into enterprise networks to prevent unauthorised devices from attacking network services. The main difficulty with this ap-proach is that NAC cannot detect abnormal behaviour of devices connected to an enterprise network. These abnormal devices can be detected using outlier detection techniques. Existing outlier detection techniques focus on specific application domains such as fraud, event or system health monitoring. In this paper, we review attacks on Bring Your Own Device (BYOD) enterprise networks as well as existing clustering-based outlier detection algorithms along with their limitations. Importantly, existing techniques can detect outliers, but cannot detect where or which device is causing the abnormal behaviour. We develop a novel behaviour-based outlier detection technique which detects abnormal behaviour according to a device type profile. Based on data analysis with K-means clustering, we build device type profiles using Clustering-based Multivariate Gaussian Outlier Score (CMGOS) and filter out abnor-mal devices from the device type profile. The experimental results show the applicability of our approach as we can obtain a device type profile for five dell-netbooks, three iPads, two iPhone 3G, two iPhones 4G and Nokia Phones and detect outlying devices within the device type profile.
ACM Reference format:
Musa Abubakar Muhammad, Aladdin Ayesh, and Isabel Wagner. 2019. Behavior-Based Outlier Detection for Network Access Control Systems. InProceedings of 3rd International Conference on Future Networks and Dis-tributed Systems, Paris, France, July 1–2, 2019 (ICFNDS ’19),6 pages.
DOI: 10.1145/3341325.3342004
1
INTRODUCTION
Mobile device security has become a necessity in our daily life due to the proliferation of the Internet of Things (IoT). The mass usage of mobile devices in workplaces has given rise to security threats such as malware, spyware, and distributed denial of service Permission to make digital or hard copies of all or part of this work for personal or classroom use is granted without fee provided that copies are not made or distributed for profit or commercial advantage and that copies bear this notice and the full citation on the first page. Copyrights for components of this work owned by others than ACM must be honored. Abstracting with credit is permitted. To copy otherwise, or republish, to post on servers or to redistribute to lists, requires prior specific permission and/or a fee. Request permissions from [email protected].
ICFNDS ’19, Paris, France
© 2019 ACM. 978-1-4503-7163-6/19/07...$15.00 DOI: 10.1145/3341325.3342004
attacks [8]. The evolution of BYOD has tremendously increased security concerns, particularly in Network Access Control (NAC) systems despite using pre-shared key (PSK) mode, but there are still security vulnerabilities. Enterprise networks are susceptible to security attacks when employee devices are lost or stolen. Anyone in possession of the lost or stolen device with malicious intent could use the saved passwords and gain access to the enterprise network illegally. NAC systems were developed to addresses these concerns. The NAC system unifies endpoint security solutions to enable and enforce access control security policies to devices connecting to an enterprise network through a RADIUS authentication server; which is a prerequisite for 802.1x authentication [11]. The Radius server enables the creation of unique usernames and passwords and could help network administrators to revoke access to lost or stolen employee devices. Another concern arises from devices with outdated security patches. For example, an attacker can exploit a vulnerability to capture device login credentials using fake RADIUS requests [19]. RADIUS impersonation is another security vulnera-bility that uses an NPS vulneravulnera-bility to gain unauthorised access or redirect authorised users to a rogue access point to gain their login credentials [4]. The device type behaviour profiling addresses NAC limitations by allowing the administrators to create a device type profile for each device type and detect abnormal devices from the device types profiles.
The organisation of this paper is as follows: Section 2 discusses the limitations of BYOD security-enabling technologies. The review of outlier detection algorithms based on clustering techniques along with their limitations is presented in Section 3. Section 4 analyses the dataset used in developing our behaviour-based outlier detec-tion technique. Device type profiling and detecdetec-tion of an abnormal device from the device type profile were introduced and analysed in section 5. Section 6 concludes the paper.
2
BRING YOUR OWN DEVICE ENTERPRISE
NETWORK
BYOD is a new trend that allows employees to use their own smartphones, tablets and laptops to access enterprise resources for work [22]. Enterprise Mobility Management (EMM) suites and Network Access Control (NAC) systems are the enabling technolo-gies used in BYOD to manage, monitor, control the data on mobile devices and to enforce access control security policies to devices connecting to the BYOD enterprise network [18]. BYOD uses tra-ditional security measures such as antivirus, anti-malware and
IDS/IPS systems to protect the enterprise network. However, these security measures are not sufficient to counter security concerns that arise from abnormal behaviour of the devices connected to the network [17]. Li et al. [14] proposed a behaviour profiling approach on mobile devices to detect abnormal patterns or devi-ations from normal usage. They built a user profile by taking the pattern of device usage, text messages, application and Bluetooth scanning. The profile was built to detect abnormal usage by spec-ifying a normal usage profile and considering other uses outside the profile abnormal. However, this framework focuses only on the user and not on their devices. Muhammad et al. [17] proposed a device type profiling approach that detects the variations of packet inter-arrival times from smartphones, tablets and laptops and filters the device causing the abnormal pattern, their approach is limited to k-means clustering approach. However, this work identified some limitations in using clustering in building a device or device profiling.
The abnormal behaviour detection technique by Kang et al. [11] uses contextual data of users having access to an enterprise network. The technique models a device’s contextual data, such as the type of device used, access time, access location and time of use and builds a usage pattern for detection of abnormal behaviours inside an enterprise network. Kim and Kim [12] propose a behaviour-based anomaly detection technique that detects abnormal behaviours in services used in a BYOD environment. They build behaviour patterns for network usage using contextual data such as device type, access time, access location and use time. The approaches in [21, 23] focus on device fingerprinting to identify devices.
However, none of the above techniques considers detecting ab-normal patterns from network devices or device types. In contrast, our behaviour-based outlier detection technique adopts unsuper-vised outlier detection to build a device type profile. The device type profiles can be used in detecting abnormal device(s) that can cause harm to the network. The unsupervised outlier detection approaches consist of one class Support Vector Machine (SVM), Nearest Neighbor (NN) and clustering techniques. The clustering-based technique was adopted due to limitations of SVM and NN that the former needs labels assigned to data instances and the latter is computationally extensive and can fail to label the data correctly. The advantages of clustering techniques are their speed, their ability to handle complex problems and their ability to use unlabelled data instances.
3
OUTLIER DETECTION
Outliers are extreme patterns of observation that significantly de-viate from the majority of a data sample [3]. Outlier detection problems can be solved using local or global approaches [1, 9]. The research approaches in [5–7, 9, 10] developed outlier detection al-gorithms that detect outliers from data. These clustering-based algorithms include Cluster-Based Local Outlier Factor (CBLOF), Local Density Based Outlier Factor (LDCOF) and Clustering-based Multivariate Gaussian Outlier Score (CMGOS). Each algorithm uses clustered data as input, calculates an outlier score and visualises the results. We used their implementations in RapidMiner Studio [16].
3.1
Cluster-Based Local Outlier Factor (CBLOF)
CBLOF adopts global outlier detection approach, in which each instance of a data is assigned an outlier score. He et al. [10] develop CBLOF technique to detect outliers using the squeezer algorithm. The squeezer algorithm calculates the outlier score and partitions the data into large and small clusters using two parametersαand β, whereαspecifies the percentage of the dataset assumed to be outlier-free andβspecifies the boundaries between large and small clusters. The outlier score is assigned to instances nearest to large clusters multiplied by the cluster size. This technique uses cluster density as a scaling factor, which can result in incorrect density estimation. Therefore, Goldstein et al. [9] proposed unweighted-CBLOF (uunweighted-CBLOF) which disables cluster estimation using local density. uCBLOF significantly improves the outlier detection.3.2
Local Density Cluster-Based Outlier Factor
(LDCOF)
LDCOF [1] follows a similar approach to CBLOF. It adopts a local outlier detection approach using the direct neighbourhood of a data instance to calculate the outlier score. This local outlier detection approach detects outliers that are ignored by global approaches, especially in cases where local densities within datasets are varied. LDCOF addresses CBLOF weaknesses by estimating the local den-sity of data instances based on the average distance of all cluster members to the nearest cluster centroid and by assuming a spher-ical distribution of the cluster members. In contrast to CBLOF,γ replacesα andβto calculate the outlier score, where an outlier score of greater than or equal to 1.0 indicates abnormal instances. One of the limitations of this approach is that outliers far from the centroid point tend to increase the average distance and when the average distance is high, the outliers cannot be detected because they appear as normal.
3.3
Clustering-based Multivariate Gaussian
Outlier Score (CMGOS)
In contrast to CBLOF and LDCOF, CMGOS uses two separate algo-rithms: a clustering algorithm and a density estimation algorithm using a subspace of each cluster. The clustering algorithm is per-formed using existing clustering techniques, for example, k-means, x-means, or DBSCAN. Density estimation is performed using a multivariate Gaussian model that can use distance measures such as Mahalanobis, Euclidean distance, or Square loss [20] to com-pute the outlier score. This algorithm takes cluster output as input, calculates the outlier score based on the multivariate Gaussian of the cluster centroid and computes the covariance matrix of each cluster centroid. Since a covariance matrix is sensitive to outliers, the algorithm is configured to remove outliers according to ex-pected percentage and recompute the matrix using estimations such as reduction, regularisation and minimum covariance deter-minant (MCD). The reduction is similar to a multivariate Grubb’s test, regularisation is similar to classification, and MCD is the idea of estimating a compact covariance matrix by brute-force search for normal records. The outlier score is computed by dividing the divergence of an instance to its nearest centroid using a distribu-tion fitting with a certain confidence interval as a normalisadistribu-tion process such that an outlier score≤1.0 indicates a high probability
Research Algorithm Technique Data Points
He et al. [10] Squeezer CBLOF All Data
Duan et al. [6] LDBSCAN LOF All data
Amer et al. [1] One-class SVM CBLOF All Data
Goldstein et al. [9] K-means CBLOF, uCBLOF, LDCOF, CMGOS All Data
Behavior-Based Outlier Detection (BBOD) K-means CMGOS, IFT Device Type Table 1: Related work comparisons
of normal instance. The implementation of CMGOS algorithm can be found in RapidMiner Studio [16] and the following steps can be used to configure CMGOS algorithm.
(1) Cluster the data using clustering technique e.g. K-Means (2) Input the resulting cluster results into CMGOS operator (3) Assign thresholds to the parameterspandγ
(4) Select Reduction, Regularisation or Minimum Covariance Determinant (MCD) in the operator menu
(5) Specify the number of samples for MCD (If MCD is chosen) according to the probability of normal class
(6) Iterate and compute the distance measure (e.g Euclidean) for all instances of the data to the cluster centroids (7) Calculate the outlier score of all instances and visualise the
result
In contrast to these existing cluster-based outlier detection tech-niques, which detect outliers based on all data points, our Behaviour-Based Outlier Detection (BBOD) technique detects outliers accord-ing to the device type (see Table 1). The device type profile is built to identify the normal and abnormal instances from each device based on the outlier score. The profile for each device in the device type profile is considered normal if the outlier score of the data instances is≤1.0 and vice versa for the abnormal profiles.
4
BEHAVIOUR-BASED OUTLIER DETECTION
(BBOD)
Behaviour-based outlier detection consists of two stages (behaviour profiling and Intelligent Filtering Technique (IFT)). These two stages were developed using publicly available test-bed data collected from mobile devices [24]. The dataset was used in [13, 21] for active and passive fingerprinting of wireless devices and their types from wired-side observation. It is publicly available in [23] and contains packet Inter-Arrival Times (IATs) of twenty-seven mobile devices including smartphones, tablets and laptops, the analysis of this data can be found in [17]. The packet IAT measures the time between two consecutive packets received and is unique for each device type [2]. For example, the IAT of iPhone 3G is unique and different to the IATs of iPhone 4G. Therefore, the IAT could help in learning the differences between the same device types connected to the same enterprise network.
For this work, we focus on isolated test-bed data because it was collected in an isolated environment without interference. The data contains 94 files containing IAT records of 14 mobile devices including five Dell-Netbooks, three iPads, two iPhone 3G, two iPhone 4G and two Nokia Phones. To analyse and develop a device type profile using this data, we focus on the iPerf TCP Case 2 traces
though the same procedure may be applied to the remaining data traces.
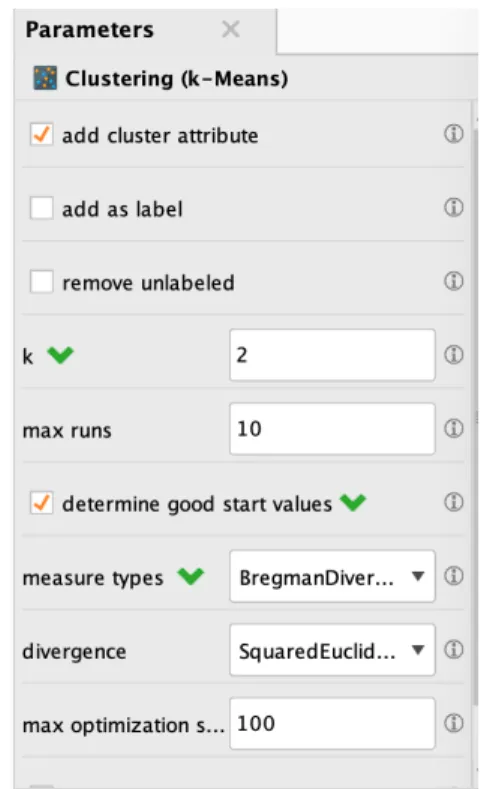
A descriptive analysis of the data was conducted using K-means clustering. We used the K-means implementation in Rapidminer Studio [16] with the following settings (See Figure 1):k=2 deter-mined using DB-index. The DB-index produces clusters with low or high results attached to the number ofk; the smallest DB-index is considered the best criterion for specifying the optimal number ofk[15]. We set the maximum runs to 10 to produce random initial centroids for each run and the robustness of k-means data assignments depends on its reproducibility. We used the squared euclidean distance because it is faster than other distance measures and set the maximum optimisation to 100 as the maximum number of iterations for each run.
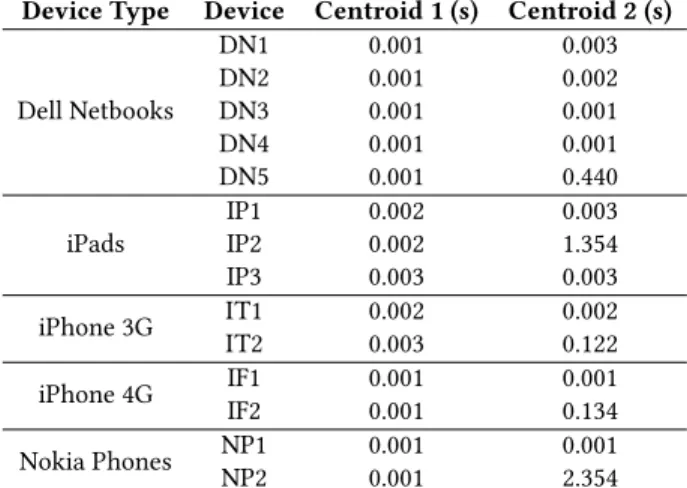
Figure 1: Configuration of K-means Operator Table 2 presents the clustering results. As can be seen from the results the IATs of Dell Netbooks (DN1-5) in centroid 1 equals to 0.001ms in all the devices while the devices in centroid 2 fall within the range 0.001 - 0.003ms except DN5 which has 0.440ms, this shows that there are some irregularities in DN5. We observed
Device Type Device Centroid 1 (s) Centroid 2 (s) Dell Netbooks DN1 0.001 0.003 DN2 0.001 0.002 DN3 0.001 0.001 DN4 0.001 0.001 DN5 0.001 0.440
iPads IP1IP2 0.0020.002 0.0031.354
IP3 0.003 0.003
iPhone 3G IT1IT2 0.0020.003 0.0020.122 iPhone 4G IF1IF2 0.0010.001 0.0010.134 Nokia Phones NP1NP2 0.0010.001 0.0012.354 Table 2: Cluster Analysis for iPerf-Tcp-Case 2 data based on packet inter-arrival-times
that cluster 2 of DN5 consisted of only four IATs in the range of 0.463 - 0.514ms. As can be seen in Table 2, we observed similar patterns for the other device types.
From the above analysis, it can be seen that the Centroid 1 in all the devices ranges between 0.001 and 0.003ms, while the Centroid 2 shows some discrepancies. Also, it can be clearly understood that there may be potential outliers in most of the devices that the k-means clustering algorithm was not able to detect. Therefore, we use k-means clustering only to help configure the boundaries (Centroid 1 and 2) for detection of normal and abnormal patterns. As stated in Section 3.3, the output of the k-means clustering is used as an input for the Clustering-based Multivariate Gaussian Outlier Score (CMGOS) in the implementation of a device type profiling approach.
5
DEVICE TYPE PROFILING
Behaviour profiling is a technique used for the detection of un-usual patterns or deviations from normal behaviour. The proposed Device Type Profiling in algorithm 1 was used in implementing behaviour-based outlier detection. The following steps were fol-lowed to configure the algorithm. In step (1 and 2) the data was concatenated into one data file and partitioned into two (See section 4) to obtain boundaries for the normal and abnormal patterns. In step (3) the boundaries from the cluster output are used as input for CMGOS operator. Step (4,5,6) sets parameters for normal and ab-normal profiles. Step (7) calculates the outlier score for each device type and (8) filters the outlier scores≥1 (the value is constant [9]). Then step (9) generates a labelled data with two classes (normal and abnormal) and visualise the results profiles and the final step (10) applies intelligent filtering technique to detect and block the abnormal device.
5.1
Experiments Settings
The experiment was carried out in RapidMiner Studio [16] using the sequence of operators shown in Fig. 2. The algorithm was configured to load and process data according to device type. The data operator loads individual data files from each device and device
type, K-means operator calculates and set the boundaries using the settings described in section 4. In configuring CMGOS operator different settings has been experimented, below setting produce the best results, the probability of normal=0.99, gamma(γ)=0.1, covariance estimation=Reduction, Time to remove outlier = 1 (i.e. the number of times minimum covariance matrix remove outliers) and the measure type=mixed measure using mixed Euclidean distance. The local density estimation of each cluster boundary is estimated using a multivariate Gaussian model, whereas the Euclidean distance serves as a basis for computing the outlier score for each data instance in the cluster boundary. Then computes the covariance matrix for each cluster boundary using two iterations to remove outliers and compute the covariance matrix again. Then calculates the outlier score by dividing the Euclidean distance of a data instance nearest to each cluster boundary to normalise the data with a certain confidence interval. The chi-squared distribution is used in normalisation such that the outlier score<=1.0 indicates a high probability of the data instance fall into the normal profile.
Figure 2: Device type Profiling Process
Algorithm 1Device Type Profiling algorithm
(1) Concatenate the Data from all devices into one file (Device Type)
(2) Cluster the IAT data using K-Means withk=2.
(3) Input the resulting cluster results into CMGOS operator, assign threshold into the parameterpand assign threshold toγ
(4) Select Reduction in the operator menu (5) Specify the values for times to remove outlier
(6) Iterate and compute the Squared Euclidean Distance for all instances of IAT to the cluster centroids
(7) Calculate and display the outlier score of all instances (8) Apply and use filter in the Outlier Score to compute the
score≤ 1.0 for normal instances and> 1 to abnormal instances
(9) Extract normal and abnormal profiles and visualise the result
(10) Apply Intelligent Filtering Technique (IFT) to the profiles and block the abnormal device
5.2
Analysis of Device Type Profiling
The result presented in Table 3 shows implementation of device type profiling Steps 1-8 of Algorithm 1 for Dell Netbooks, iPads, iPhone 3G and Nokia though more devices can be added later. From the Dell-Netbooks results, it can be seen that the total IAT points equal to 9,100,324 out of which the normal profile contains 99.3%
and the abnormal profile with 0.7%. In the iPads, the total number of IAT points is 4,581,539 where the normal profile has 99.8% and abnormal with 0.2% of the IAT points. In the device type profiles of iPhone 3G, there was a total of 1,129,399 IAT points out of which the normal profiles are estimated at 98.6% and abnormal at 1.4%. Also, in iPhone 4G the total number of IAT points is 8,300,764 in which the normal profile has 99.5% of the IAT points and abnormal with 0.5%. In the case of Nokia Phones, the total number of IAT points is 1,563,011 where the normal profile contains 99.7% of the points and abnormal 0.3%. Based on the above analysis, it can be seen that the normal profiles in all cases have the largest number of IAT points and the abnormal have much smaller numbers. Thus, the boundaries used from the clustering only help in building device type profiles but do not determine which device has a higher number of abnormal patterns.
Device Type Normal IAT points Abnormal IAT points % abnormal Dell-Netbooks 9,034,201 66,123 0.7 iPads 4,570,163 11,376 0.2 iPhone 3G 1,113,549 15,850 1.4 iPhone 4G 8,260,063 40,701 0.5 Nokia Phones 1,558,888 4,123 0.3
Table 3: Device Type Profiling using Clustering-based Mul-tivariate Gaussian Outlier Score
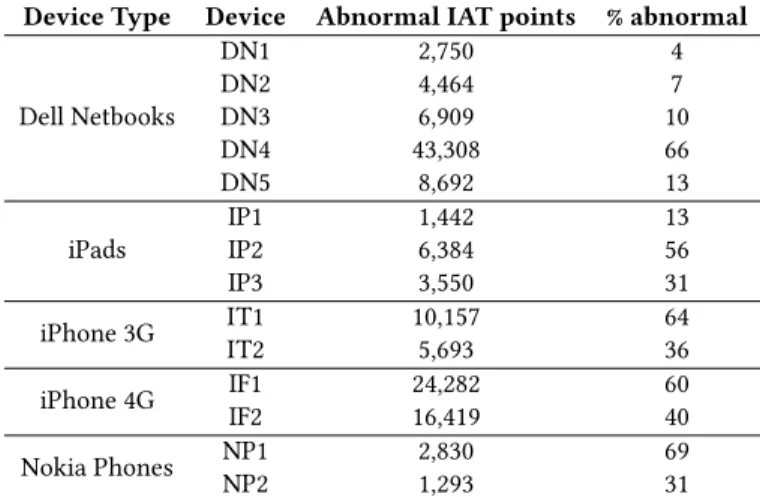
The results in Table 4 helps in identifying the device having a large number of outliers within the device type profile. This was investigated to identify the device influencing the abnormal patterns from each device type profiles presented in Table 3. As can be seen from Table 4, DN4 contains 66% of the outlying points spreading around while other devices are falling into the range between 4-7% respectively. It can be seen that DN4 is the outlying device and the other devices having a smaller percentage of outliers that may be due to measurement errors which will be investigated further in the future enhancement of this technique. We observed similar pattern in the other device type where IP2, IT1, IF1 and NP1 were identified as the abnormal devices that are blocked by IFT. To the best of our knowledge this is the first technique that applies a fingerprinting and profiling technique to identify abnormal device from the profiles and intelligent filtering technique to block the abnormal device identified in the profile.
The related works in [2, 21, 24] developed a fingerprinting tech-nique that identifies a device and device type using device sig-natures. The fingerprinting technique is part of reconnaissance (i.e. gathering information about an attacker) but does not de-tect abnormal behaviour or attacks in a network. Whereas, the research approaches in [11, 12, 14, 17] developed a behaviour pro-filing techniques that builds a behaviour profiles from device usage, network characteristics and contextual network data to detect a pattern(s) that deviates from the normal profile and alert a network administrator. The novelty of BBOD is that it combines both the fingerprinting and behaviour profiling approaches to identify, de-tect and block the abnormal device identified in a network. The BBOD is developed using Clustering-based Multivariate Gaussian Outlier Score to define a normal and abnormal profile and applies
intelligent filtering technique to identify and block the device(s) causing the abnormal pattern in the network which improves the research works in [1, 10, 16] that focus on detecting outliers from the whole network.
Device Type Device Abnormal IAT points % abnormal
Dell Netbooks DN1 2,750 4 DN2 4,464 7 DN3 6,909 10 DN4 43,308 66 DN5 8,692 13
iPads IP1IP2 1,4426,384 1356
IP3 3,550 31
iPhone 3G IT1IT2 10,1575,693 6436 iPhone 4G IF1IF2 24,28216,419 6040 Nokia Phones NP1NP2 2,8301,293 6931 Table 4: Distribution of abnormal points in Table 3 over in-dividual devices
6
CONCLUSION
We present a novel behaviour-based outlier detection technique that builds a device-type profile, detects and filters out abnormal devices from the device type profile. We compared the technique with related outlier detection techniques and discussed their limita-tions along with improvements. The literature review discusses the limitations of BYOD security-enabling technologies and gives an insight into how the traditional security measures are used in NAC systems to monitor and block malicious devices in the BYOD plat-forms. Also, monitor the devices that do not comply with enterprise security policy. As stated in the literature review, the existing BYOD security-enabling technologies do not detect the device causing an abnormal pattern within the BYOD enterprise network. One of the limitations of these techniques is that they either block the devices that do not comply with enterprise policy or produce false alarms. This work improved the current techniques by developing a device type profile to detect abnormal device from the device type profile. The technique is an improvement of work in [17, 18] which adopts k-means clustering and CMGOS outlier detection technique to de-tect and filter out abnormal device(s) from device type profiles. The experimental results show the applicability of this behaviour-based outlier detection approach as we are able to identify and analyse the device(s) raising the inter-arrival time traffic in the network.
REFERENCES
[1] Mennatallah Amer, Markus Goldstein, and Slim Abdennadher. 2013. Enhancing One-class Support Vector Machines for Unsupervised Anomaly Detection. In
Proceedings of the ACM SIGKDD Workshop on Outlier Detection and Description (ODD ’13). ACM, New York, NY, USA, 8–15.
[2] Sandhya Aneja, Nagender Aneja, and Md Shohidul Islam. 2018. IoT Device Fingerprint using Deep Learning. In2018 IEEE International Conference on Internet of Things and Intelligence System (IOTAIS). IEEE, 174–179.
[3] Varun Chandola, Arindam Banerjee, and Vipin Kumar. 2009. Anomaly Detection: A Survey.ACM Comput. Surv.41, 3, Article 15 (July 2009), 58 pages.
[4] Gurjeet Singh Dhillon. 2017. Vulnerabilities & Attacks in Mobile Adhoc Networks (MANET).International Journal of Advanced Research in Computer Science8, 4
(2017).
[5] Xuemei Ding, Yuhua Li, Ammar Belatreche, and Liam P Maguire. 2014. An experimental evaluation of novelty detection methods. Neurocomputing135
(2014), 313–327.
[6] Lian Duan, Lida Xu, Ying Liu, and Jun Lee. 2009. Cluster-based outlier detection.
Annals of Operations Research168, 1 (01 Apr 2009), 151–168.
[7] Eleazar Eskin, Andrew Arnold, Michael Prerau, Leonid Portnoy, and Sal Stolfo. 2002. A geometric framework for unsupervised anomaly detection. In Applica-tions of data mining in computer security. Springer, 77–101.
[8] M. Eslahi, M. V. Naseri, H. Hashim, N. M. Tahir, and E. H. M. Saad. 2014. BYOD: Current state and security challenges. InComputer Applications and Industrial Electronics (ISCAIE), 2014 IEEE Symposium on. 189–192.
[9] Markus Goldstein and Seiichi Uchida. 2016. A Comparative Evaluation of Unsu-pervised Anomaly Detection Algorithms for Multivariate Data.PLOS ONE11, 4
(04 2016), 1–31.
[10] Zengyou He, Xiaofei Xu, and Shengchun Deng. 2003. Discovering cluster-based local outliers.Pattern Recognition Letters24, 9 (2003), 1641 – 1650. http:
//www.sciencedirect.com/science/article/pii/S0167865503000035
[11] Dongwan Kang, Joohyung Oh, and Chaetae Im. 2014. Context based smart access control on BYOD environments. InInternational Workshop on Information Security Applications. Springer, 165–176.
[12] T. Kim and H. Kim. 2015. A system for detection of abnormal behavior in BYOD based on web usage patterns. InInformation and Communication Technology Convergence (ICTC), 2015 International Conference on. 1288–1293.
[13] Merima Kulin, Carolina Fortuna, Eli De Poorter, Dirk Deschrijver, and Ingrid Mo-erman. 2016. Data-driven design of intelligent wireless networks: An overview and tutorial.Sensors16, 6 (2016), 790.
[14] Fudong Li, Nathan Clarke, Maria Papadaki, and Paul Dowland. 2010. Behaviour profiling on mobile devices. InEmerging Security Technologies (EST), 2010 Inter-national Conference on. IEEE, 77–82.
[15] Jos´e Mar´ıa Luna-Romera, Jorge Garc´ıa-Guti´errez, Mar´ıa Mart´ınez-Ballesteros, and Jos´e C Riquelme Santos. 2018. An approach to validity indices for clustering techniques in Big Data.Progress in Artificial Intelligence(2018), 1–14. [16] Ingo Mierswa, Michael Wurst, Ralf Klinkenberg, Martin Scholz, and Timm Euler.
2006. YALE: Rapid Prototyping for Complex Data Mining Tasks. InProceedings of the 12th ACM SIGKDD International Conference on Knowledge Discovery and Data Mining (KDD ’06). ACM, New York, NY, USA, 935–940.
[17] Musa Abubakar Muhammad and Aladdin Ayesh. 2019. A Behaviour Profiling Based Technique for Network Access Control Systems.International Journal of Cyber-Security and Digital Forensics (IJCSDF)Vol. 8, No. 1 (2019), 23–30.
[18] Musa Abubakar Muhammad, Aladdin Ayesh, and Pooneh Bagheri Zadeh. 2017. Developing an Intelligent Filtering Technique for Bring Your Own Device Net-work Access Control. InProceedings of the International Conference on Future Networks and Distributed Systems (ICFNDS ’17). ACM, Article 46, 8 pages.
[19] Danny Palmer. 2017. Your failure to apply critical cybersecu-rity updates is putting your company at risk from the next Wan-naCry or Petya. (Aug 2017). https://www.zdnet.com/article/
your-failure-to-apply-critical-cyber-security-updates-puts-your-company-at-risk-from-the-next/ [20] Vaishali R Patel and Rupa G Mehta. 2012. Data clustering: integrating different
distance measures with modified k-means algorithm. (2012), 691–700. [21] Sakthi Vignesh Radhakrishnan, A Selcuk Uluagac, and Raheem Beyah. 2015.
GTID: A technique for physical device and device type fingerprinting. IEEE Transactions on Dependable and Secure Computing12, 5 (2015), 519–532. [22] Manmeet Mahinderjit Singh, Soh Sin Siang, Oh Ying San, Nurul Hashimah,
Ahamed Hassain Malim, and Azizul Rahman Mohd Shariff. 2014. Security Attacks Taxonomy on Bring Your Own Devices (BYOD) Model.International Journal of Mobile Network Communications & Telematics (IJMNCT) Vol4 (2014).
[23] A. Uluagac. 2018. CRAWDAD dataset gatech/fingerprinting (v.2014-06-09). (2018). https://crawdad.org/gatech/fingerprinting/20140609/
[24] A Selcuk Uluagac, Sakthi V Radhakrishnan, Cherita Corbett, Antony Baca, and Raheem Beyah. 2013. A passive technique for fingerprinting wireless devices with wired-side observations. InCommunications and Network Security (CNS), 2013 IEEE Conference on. IEEE, 305–313.