Sentiment and Stock Returns
Ahmed Salhin
Submitted for the degree of
Doctor of Philosophy in Finance
Department of Accounting, Economics & Finance
School of Social Sciences
Heriot-Watt University
June 2017
c
The copyright in this thesis is owned by the author. Any quotation from the thesis or use of any of the information contained in it must acknowledge this thesis as the source of the
It is well established that investor sentiment plays a vital role in global finan-cial markets. However, the sentiment of other economic agents has received less attention in the behavioural finance literature. This thesis aims to address the impact of managerial sentiment on the UK stock market. It investigates the per-formance of managerial sentiment in predicting stock returns relative to investor and consumer sentiments. In addition, it examines how sentiment is transmit-ted from managers to investors and whether the response of investor sentiment is asymmetric towards positive versus negative managerial sentiment. Finally, this thesis provides a comparative study of traditional and sentiment-augmented asset pricing models.
Using monthly data from January 1985 to December 2014 and a sample of consumer and business confidence indicators provided by the European Commis-sion, the first chapter provides novel evidence on how managerial and consumer sentiment indicators affect stock returns. The findings show no support for con-sumer confidence as a predictor of stock returns. However, managerial sentiment shows a significant impact on aggregate market and sector return indices. Fur-thermore, results indicate that parameter estimates for sector groupings are not consistent, implying that the sentiment-return relationship differs across sectors and that parameters are sensitive to industry characteristics.
In the second chapter, the investigation extends to assess the long and short-run dynamics of the sentiment transmission from managers to investors. Using threshold autoregressive (TAR), momentum threshold autoregressive (MTAR), and asymmetric threshold vector error correction (ATVECM) models, the findings provide evidence on the impact of managerial sentiment on investor sentiment in support of the Catering Theory. Results show that investors’ sentiments converge with long-run equilibrium relationships in response to positive rather than nega-tive shocks in managerial sentiment. Furthermore, findings indicate that investor sentiment reacts negatively to positive managerial sentiment with a delay of four
business outcomes.
Finally, the third chapter examines the ability of managerial and investor sen-timent to explain cross-sectional variation in stock returns. It compares the
perfor-mance of CAPM, Fama & French (1993) Three factor model and Carhart (1997)
four factor model to sentiment-augmented asset pricing models, which incorporate measures of both managerial and investor sentiment. The findings indicate that inclusion of sentiment factors significantly adds to the power of traditional asset pricing models to explain the cross-sectional variation in stock returns. In addi-tion, results show that managerial sentiment outperforms investor sentiment in ex-plaining three out of four test portfolios formed on size, book-to-market, volatility and size/momentum factors. Moreover, findings show that managerial sentiment exhibits stronger prediction power for size premium over short (1-3 months) fore-casting horizon relative to investor sentiment. However, value premiums respond to changes in managerial and investor sentiment over the relatively longer time of 12 months. In addition, the investigation failed to find any significant relationship between sentiment indices and momentum premium.
This study has several implications for empirical researchers, practitioners and policy makers. It provides academics who are concerned with the empirical tests of asset pricing models with new insights on how the inclusion of managerial sentiment impacts the performance of longer term investigated models. For prac-titioners, our findings suggest that managerial sentiment and its impact on sector returns provide new opportunities for enhancing trading as well as asset allocation strategies. In developing investment strategies, practitioners may consider sectors that are more or less prone to sentiment in response to investor risk preferences. In addition, results on sentiment-augmented asset pricing models may be of interest to regulators who are concerned with the estimation of businesses’ cost of capital when pricing public services.
To my loving parents Fouad Salhin and Sediqa Mahmoud, without
whom non of my success would be possible.
Acknowledgements
In the name of Allah, the Most Gracious and the Most Merciful
Alhamdulillah! All praise is due to Allah for giving me the strength and His blessings in completing my thesis. He supplied me with guidance, courage and patience to complete this research. Peace and blessing be upon my beloved prophet Muhammad, from whom I learned good manners and the love of knowledge.
Firstly, I pay sincere gratitude and profound appreciation to my supervisor Dr. Mohamed Sherif for the continuous support, patience, motivation, and immense knowledge during my PhD studies. He helped me throughout my research and the writing of my thesis. I thank him for his continuous encouragement and believing in my ability to succeed. I could not have imagined having a better supervisor and mentor for my PhD studies than Dr. Sherif. I am also deeply indebted to my second supervisor, Dr. Edward Jones, who provided me with insightful comments on my research and generous advices on my academic life. In addition to my supervisors, I would like to thank the School of Social Sciences (formerly the School of Management of Languages) for providing the funding towards this degree.
Most important of all, this journey would not have been possible without the support of my parents. Thank you for all the sacrifices you have made for me. You believed in me and wanted nothing but the best for me and my family. Your help was always infinite. I express my heart-felt gratitude to my parents in law Fatema Alzahraa and Salah Sabrah whose support and constant encouragement helped me through the hard times of this journey. I wish to thank my siblings; Amany and Fouad Elshafey, Radwa and Mohamed Samy, Saleh and Hadeer Salhin, Amr and Samir Sabrah for supporting me throughout writing this thesis and throughout my life. I am deeply grateful for your patience throughout my absence, especially when you needed me.
life and laughter into my heart. Ruqaya, Arwa and Adam, your happiness is my bliss. But most of all, I want my wife to know, that the success of this is due to her. Thoraia, you are the reason and purpose of my accomplishments. Saying that fills me with a lot of confidence and a lot of pride. When I look at you, I know I will always have the strength I need to get through anything. Despite the endless work of raising a family and countless sleepless nights, you remain beautiful, smart, and selfless. I am so grateful to be able to spend my life with you. My gratitude is never ending. Your sacrifices and patience made my studies possible, but it is our love that makes my life wonderful. You give me something to look forward to every day I wake up. You bring the best out in me. Thank you for every single thing you have done for me. I love you and always will.
I am greatly indebted to my closest friend Maysara Sayed whose friendship I deeply treasure. I have always received your support when needed. I wish to thank my fellow office mates Fisayo, Kenny, Sering, Wahida, and Yusuf for the stimulating discussions, encouragement, support and fun moments they have given me in the last four years. I will certainly miss your company in the future. I would also like to thank my family in the UK; Eltayeb Bensaad, Nazmi Sellami, Robert Short, Mossadek Yessaad and their families for their love and support during my stay in Edinburgh.
A paper extracted from the second chapter of this thesis titled ‘Managerial Sentiment, Consumer Confidence and Sector Returns’ (co-authored with Dr. Mo-hamed Sherif and Dr. Edward Jones) is published in the International Review of Financial Analysis. I would like to thank the editors and referees of this journal for their insightful comments on the study.
On a final note, I would like to thank the American Finance Association for the grant to attend their 2016 annual meeting in San Francisco. I would also like express my gratitude to Santander Bank for their mobility grant in which I used to support my research.
Contents
1 Introduction 1
1.1 Research background and motivation . . . 1
1.2 Study aims and contribution to knowledge . . . 3
1.3 The UK stock market. . . 6
1.4 Outline of the thesis . . . 7
2 Managerial Sentiment, Consumer Confidence and Sector Returns 8 2.1 Introduction . . . 8
2.2 Literature review . . . 10
2.2.1 Market-based measures of sentiment . . . 10
2.2.2 Survey-based measures of sentiment . . . 12
2.2.3 Sector effect . . . 13
2.3 Data and descriptive statistics . . . 15
2.3.1 Data on investor sentiment . . . 15
2.3.2 Data on stock returns . . . 20
2.3.3 Preliminary tests . . . 22
2.4 Methodology and findings . . . 23
2.4.1 Robustness tests . . . 30
2.4.1.1 Causality using FTSE100 Index, sectors return in-dex and Managerial Sentiment Indicator (MSI) . . 30
2.4.1.2 Causality during different periods . . . 32
2.5 Conclusion . . . 37 Appendix 1 . . . 39 Appendix 2 . . . 41 Appendix 3 . . . 42 Appendix 4 . . . 44 Appendix 5 . . . 45
3 Sentiment Transmission between Managers and Investors 46 3.1 Introduction . . . 46
3.2 Literature review . . . 49
3.2.1 Investor sentiment . . . 49
3.2.3 Catering theory . . . 51
3.3 Data and preliminary tests . . . 52
3.3.1 Investor sentiment . . . 52
3.3.1.1 Closed-end fund discount (CEFD) . . . 53
3.3.1.2 Number of initial public offerings (NIPOs) . . . 53
3.3.1.3 FTSE100 Volatility Index (VFTSEIX) . . . 54
3.3.2 Managerial sentiment . . . 55
3.3.3 Return indices. . . 55
3.3.4 Macroeconomic variables . . . 58
3.3.5 Preliminary tests . . . 60
3.4 Investor sentiment, managerial sentiment and stock returns . . . 61
3.5 The relationship between managerial and investor sentiments . . . . 62
3.6 Asymmetric sentiment transmission from managers to investors . . 65
3.7 Conclusion . . . 74
Appendix 1 . . . 76
Appendix 2 . . . 78
4 Managerial Sentiment, Asset Prices and Risk Premiums 80 4.1 Introduction . . . 80
4.2 Empirical models, specification tests and variable constructions . . 83
4.2.1 Empirical models . . . 83
4.2.1.1 Capital Asset Pricing Model (CAPM) . . . 83
4.2.1.2 Fama-French (1993) three factor model (FF). . . . 83
4.2.1.3 Carhart (1997) four factor model (4FF) . . . 84
4.2.1.4 Four factor model plus managerial sentiment. . . . 84
4.2.1.5 Four factor model plus investor sentiment . . . 84
4.2.1.6 Four factor model plus investor and managerial sentiment . . . 85 4.2.2 Specification tests . . . 86 4.2.2.1 Parametric tests . . . 86 4.2.2.2 Non-parametric test . . . 86 4.2.3 Variables constructions . . . 88 4.2.3.1 Investor Sentiment . . . 88 4.2.3.2 Managerial Sentiment . . . 90 4.3 Data . . . 91
4.3.1 Data on risk factors. . . 91
4.3.2 Data on investor sentiment . . . 92
4.3.3 Data on managerial sentiment . . . 93
4.3.4 Test portfolios . . . 93
4.3.5 Macroeconomic variables . . . 94
4.4 Testing fundamental and behavioural asset pricing models . . . 94
4.5 Sentiment and size, value and momentum premiums . . . 108
5 Conclusion 120
5.1 Introduction . . . 120
5.2 Summary of the main findings . . . 120
5.3 Implications of the study . . . 121
5.4 Limitations of the study . . . 122
List of Figures
1.1 Global Financial Centres Index . . . 6
2.1 Sentiment indicators . . . 17
2.2 UK GDP growth rate . . . 18
2.3 Rolling correlation between sentiment indicators . . . 19
2.4 Market and sectors returns . . . 21
2.5 Correlogram of confidence indicators at both level and differenced values . . . 42
2.6 Correlogram of returns at both level and differenced values . . . 43
2.7 Sentiment and returns cross correlation function . . . 44
3.1 Sentiment and stock market return indices . . . 56
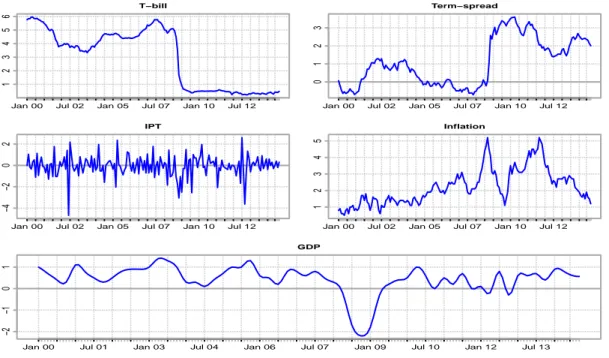
3.2 Macroeconomic indices . . . 58
3.3 Illustration of the path from company fundamentals to stock market returns. . . 65
3.4 A composite measure of investor sentiment . . . 66
3.5 An area plot of managerial sentiment vs investor sentiment indices . 68 4.1 Hansen-Jagannathan Bounds . . . 114
List of Tables
2.1 Sample size for business surveys in the UK and the EU. . . 16
2.2 Descriptive statistics and correlation for economic, consumer and managerial sentiment indicators. . . 17
2.3 Descriptive statistics and correlation for market and sector returns. 22
2.4 Unit root tests. . . 23
2.5 p-values for Granger causality tests for sentiment and aggregate market and sector returns. . . 26
2.6 p-values for Granger causality tests for survey questions and returns. 29
2.7 Granger causality tests using different sentiment and return indices. 31
2.8 p-values for Granger causality tests for aggregate market and sec-toral levels (pre-dotcom collapse). . . 33
2.9 p-values for Granger causality tests for aggregate market and sec-toral levels (post-dotcom collapse). . . 34
2.10 p-values for Granger causality tests for aggregate market and sec-toral levels (pre-GFC). . . 35
2.11 p-values for Granger causality tests for aggregate market and sec-toral levels (post-GFC).. . . 36
3.1 Descriptive statistics sentiment, returns and macroeconomic indices. 54
3.2 Correlation for sentiment, returns and macroeconomic indices. . . . 57
3.3 Data sources of investor and managerial sentiment, stock returns and macroeconomic variables . . . 59
3.4 Unit root tests. . . 60
3.5 p-values for Granger causality tests for sentiment and aggregate market returns. . . 62
3.6 Effects of Managerial sentiment on investor sentiment . . . 64
3.8 MTAR (steepness asymmetry) results . . . 71
3.9 Results of the asymmetric sentiment transmission from managers to investors . . . 73
3.10 Survey questions for constructing the Core Managerial Sentiment Index . . . 76
4.1 Survey questions for constructing the Core Managerial Sentiment Index. . . 90
4.2 Descriptive statistics for sentiment indicators, Fama-French and Carhart factors and macroeconomic indices. . . 95
4.3 Correlation for sentiment, Fama-French and Carhart factors and macroeconomic indices. . . 96
4.4 Descriptive statistics for the 10 Book-to-Market (BTM) portfolios. . 97
4.5 Descriptive statistics for the 10 size portfolios. . . 98
4.6 Descriptive statistics for 25 standard deviation portfolios. . . 99
4.7 Descriptive statistics for 25 size and momentum portfolios. . . 100
4.8 Time-series regression with 10 value test portfolios. . . 101
4.9 Time-series regression with 10 size test portfolios. . . 103
4.10 Time-series regression with 25 standard deviation test portfolios. . . 105
4.10 Time-series regression with 25 standard deviation test portfolios (Continued). . . 106
4.10 Time-series regression with 25 standard deviation test portfolios (Continued). . . 107
4.11 Time-series regression with 25 size and momentum test portfolios. . 109
4.11 Time-series regression with 25 size and momentum test portfolios (Continued). . . 110
4.11 Time-series regression with 25 size and momentum test portfolios (Continued). . . 111
4.12 Summary of GRS results for asset pricing models tested on equally and value-weighted portfolios . . . 112
4.13 Hansen and Jagannathan model specification tests . . . 113
4.15 Predictive regressions for value premium . . . 116
Abbreviations
3FF Three Factor Model
4FF Four Factor Model
ADF AugmentedDickey-Fuller
AIC AkaikeInformation Criterion
ATVECM AsymmetricThreshold Vector Error Correction Model
BTM Book to Market
CAPM Capital Asset Pricing Model
CCI Consumer Confidence Indicators
CEFD Closed-end Fund Discount
CMSI Core Managerial Sentiment Index
EC European Commission
ECT Error Correction Term
EMH Efficient Market Hypothesis
ESI Economic Sentiment Indicator
EW Equally-weighted
EXP Experian
GDP Gross Domestic Product
GFC Global FinancialCrisis
HJ Hansen and Jagannathan
HML High MinusLow
ICB Industry Classification Benchmark
INF Inflation
KPSS Kwiatkowski-Phillips-Schmidt-Shin
LRE Long-runEquilibrium
MOM Momentum
MSI Managerial Sentiment Idex
MTAR MomentumThreshold Autoregressive
NACE Nomenclature Statistique des Activit´es E´conomiques
dans la Communaut´e Europ´eenne
NAV Net Asset Value
NI National Institutions
NIPOs Number of Initial Public Offerings
ONS Office of NationalStatistics
PCA Principal Component Analysis
PP Philips-Perron
RI ReturnIndex
RMRF Return on Market portfolio minusRisk Free rate
SD Standard Deviation
SDF Stochastic Discount Factors
SMB Small Minus Big
TAR ThresholdAutoregressive
T-bill Treasury Bill
UNEMP Unemployment Rate
VARX Vector Autoregressive model with exogenous variables
VFTSEIX Volatility of FTSE100 IndeX
List of Publications
Peer Reviewed Publications
• Shehata, N., Salhin, A., and El-Helaly, M. (2017). Board Diversity and
Firm Performance: Evidence from UK SMEs. Applied Economics, 1-16.
• Salhin, A., Sherif, M. and Jones, E. (2016). Managerial Sentiment,
Con-sumer Confidence and Sector Returns. International Review of Financial
Analysis, 47, 24-38.
• Salhin, A. (2013). The impact of hard Discount Control Mechanism on
the discount volatility of UK closed end funds. Investment Management and
Financial Innovation, 10(3).
Working and Discussion Papers
• Salhin, A., Sherif, M. and Jones, E. (2017). Sentiment Transmission
be-tween Managers and Investors.
• Salhin, A., Sherif, M. and Jones, E. (2017). Managerial Sentiment, Asset
Prices and Risk Premiums.
• Salhin, A., Sherif, M. and Jones, E. (2016). Investor Sentiment and Sector
Returns. Centre for Finance and Investment Discussion Paper, Heriot Watt
• Salhin, A., Kyiu, A., Taheri, B., Porter, C., Valantasis-Kanellos, N. and
K¨onig, C. (2016). Quantitative Data Gathering Techniques. In: K. O’Gorman,
R. MacIntosh and A. Paternson,Research Methods for Accountancy and
Fi-nance, 1st ed. Edinburgh: Goodfellow Publishers.
• Rae, S., Salhin, A., Taheri, B., Porter, C., K¨onig, C., and
Valantasis-Kanellos, N. (2016). Quantitative Data Analysis Approaches. In: K. O’Gorman,
R. MacIntosh and A. Paternson,Research Methods for Accountancy and
Chapter 1
Introduction
“Surely, an economy cannot be rational, which for its very being depends upon
practices that are a disgrace to human nature.”
– James Beattie, Dissertations Moral and Critical, (1783, p. 587)
1.1. Research background and motivation
In his early work on the behavioural foundations of economic theory, Kenneth
Arrow (1986) argues that individual rationality is often an essential assumption for an economic theory to exist. The importance of the rationality assumption stems from its usefulness in providing solutions to frequent theoretical economic and financial problems in which economic agents are assumed to maximise their expected utility. For example, classical finance theory assumes investors are ratio-nal and diversify to optimize the statistical properties of their investments. In an economy with such rational investors, markets are efficient as asset prices fully
re-flect all available information and follow martingales (Lucas, 1978). Even if some
investors are irrational and drive prices away from their intrinsic values, prices
are brought back into equilibrium by the actions of arbitrageurs (Antoniou et al.,
However, a considerable body of evidence has developed involving prolonged price anomalies in stock markets such as the closed-end fund puzzle, excess volatil-ity, and calendar effects. Such anomalies cannot be understood under the
tradi-tional Efficient Market Hypothesis (EMH) of Fama (1970). In addition, studies
show that arbitrage is limited and incurs costs that prevent rational investors from
restoring market equilibrium (Shleifer & Vishny, 1997). Consequently, the
influ-ence of irrational investors or ‘noise traders’ on stock prices persist, so relaxing the rationality assumption becomes crucial to understand the dynamics of the stock market.
Moreover, psychological studies pioneered by Herbert Simon (1955, 1979)
show that decision makers’ rationality is bounded and individuals’ reasoning pro-cesses frequently involve systematic errors. Furthermore, relaxing the rationality assumption led to developing theories that attempt to understand how investors make choices under risk and uncertainty. One example is the Prospect Theory
developed by Kahneman & Tversky (1979). In Prospect Theory, investors
eval-uate their assets based on gains and losses instead of their final wealth. They are also loss averse in the sense that their avoidance of losses is greater than their attraction to gains. Moreover, individuals often rely on their intuition and feelings
instead of on more deliberative, tedious reasoning (Glatzeder et al.,2010). Under
such perspective, the dynamics of the economy and financial markets cannot be isolated from the nature of individual behaviour.
Therefore, the role of investor sentiment in causing mispricing of securities
becomes more important than previously anticipated (Cook et al., 2003).
How-ever, researchers continue to debate investor sentiment measures and their impact on stock returns. For instance, closed-end fund discounts, which are considered to be a measure of (small) investor sentiment, remain a puzzle. Other sentiment measures like investor surveys, trading volume, mutual fund flow, retail investor trading, dividend premiums and insider trading have all been proposed as indica-tors of investor optimism and pessimism. Furthermore, several studies have used
consumer confidence as a proxy for investor sentiment (Jansen & Nahuis, 2003;
However, the literature on behavioural finance has focussed less attention on the role of managerial sentiment in the stock market. Managers have superior information about their companies that gives them an advantage over investors.
For example,Meulbroek (1992) shows that insider trading led to higher abnormal
returns due to information asymmetry. We expect that if managers hold sentiment towards their businesses, it must be informed and have the capability to forecast future stock prices. Furthermore, and as evidenced by the literature, managers continuously aim to influence stock prices by using corporate activities to cater for
investor sentiment (Baker & Wurgler, 2013). Revealing their sentiment towards
the future of their businesses may represent one such activity. It follows then that investigating managerial sentiment would provide more insights into how managers interacts with investors in the stock market.
1.2. Study aims and contribution to knowledge
The objective of this thesis is to understand the impact of managerial senti-ment on stock returns. To achieve our objective, we aim to answer three streams of questions; the first stream concerns the impact of managerial sentiment on stock returns at aggregate market and sector levels. In particular, the study attempts to answer the following questions: Does managerial sentiment significantly predict aggregate market returns? If so, is the aggregate sentiment-return relationship driven by specific sectors in the market? Does the impact of sentiment on stock returns differ across sectors? If so, what characteristics affect the nature of the relationship in each sector? What is the impact of major events on relationship between sentiment and returns? Does the impact differ in specific sectors more than others? How does managerial sentiment compare to consumer and investor sentiments in predicting stock market returns?In the second stream, the main questions we attempt to answer are whether the sentiment of managers is transmitted to investor sentiment? If so, does in-vestor sentiment asymmetrically respond to positive versus negative managerial
sentiment? Finally, in the light of previous answers, the study aims to understand the impact of the inclusion of managerial and investor sentiment on the perfor-mance of traditional asset pricing models and what influence do managerial and investor sentiment indicators have on size, value and momentum anomalies.
The study contributes to the literature by answering these questions. It argues that managerial sentiment should be used as a powerful predictor of stock returns. It also sheds some light on the importance of studying sentiment at a disaggregated level since market participants do not hold the same sentiment towards each sector of the market. In addition, this thesis contributes knowledge on how managers interact with investors in the stock market and reveals some managerial practices that affect stock prices and how they drive investor sentiment to achieve their goals.
In chapter 2, the thesis investigates the relationship between managerial sen-timent and sector returns. Using UK monthly data from January 1985 to Decem-ber 2014 and a sample of consumer and business confidence indicators provided by the European Commission, we provide novel evidence on how managerial and con-sumer sentiment indicators affect stock returns. We find no support for concon-sumer confidence as a predictor of stock returns. However, managerial sentiment shows a significant impact on aggregate market and sector return indices. Furthermore, we find that parameter estimates for sector groupings are not consistent, implying that the sentiment-return relationship differs across sectors. We also find parameters are sensitive to industry characteristics. Importantly, the overall sentiment-return relationship is dominated by sentiment associated with manufacturing firms.
In chapter 3, we investigate the relationship between managerial and investor sentiments in the UK market. As a starting point, we construct a core managerial
sentiment index (CMSI) based on the findings of Salhin et al. (2016). Relative
to individual measures of investor sentiment, our tests indicate that CMSI is a powerful predictor of stock returns and its performance is less sensitive to changes in stock market return indices. Moreover, we provide evidence for the impact
of managerial sentiment on investor sentiment in support of the Catering The-ory. In addition, we use Threshold Autoregressive (TAR), Momentum Thresh-old Autoregressive (MTAR), and Asymmetric ThreshThresh-old Vector Error Correction (ATVECM) models to estimate the asymmetric long and short-run dynamics of sentiment transmission from managers to investors. Our findings show that in-vestor sentiment converges to a long-run equilibrium relationship in response to positive rather than negative shocks in managerial sentiment. Furthermore, results indicate that investor sentiment reacts negatively to positive managerial sentiment with a delay of four months. These results suggest that managers are generally over-confident with regards to the future outcomes of their businesses.
The final chapter examines the ability of managerial and investor sentiment to
explain UK stock returns. We compare the performance of CAPM,Fama & French
(1993) Three Factor Model, andCarhart (1997) Four Factor Model to
sentiment-augmented asset pricing models, which incorporate measures of both managerial and investor sentiment. Our findings indicate that the inclusion of sentiment fac-tors significantly adds to the power of traditional asset pricing models in explaining the cross-sectional variation in stock returns. In addition, results show that man-agerial sentiment outperforms investor sentiment in explaining three out of four test portfolios formed on size, book-to-market, volatility and size/momentum fac-tors. Furthermore, we evaluate the relative pricing errors of the models using
the non-parametric distance of Hansen & Jagannathan (1997). Our results offer
evidence that managerial sentiment models yield small distance errors relative to traditional asset pricing models. Moreover, we investigate whether managerial and investor sentiment can predict size, value, and momentum premiums over different forecasting horizons. We show that managerial and investor sentiment indicators exhibit stronger forecasting power for size premiums over a shorter forecasting horizon. On the contrary, value premiums are affected by managerial and investor sentiment over a longer horizon of 12 months. However, we find no evidence for the impact of sentiment indices on momentum premium.
1.3. The UK stock market
The focus of this study is on the UK market. The main reason for select-ing the UK market is due to the availability of data on managerial sentiment for the aggregate market and for sectors. Data for our sample is provided by the European Commission (EC) which spans the period from January 1985 to De-cember 2014. The data provides essential information for business activities and short-term forecasting and is often used to predict turning points in the economic cycle.
In addition, the London Stock Exchange is considered one of the major stock exchanges in the world and is the largest in Europe. It has roots that stretchs back to the coffee houses of the 17th century and it operates in London which ranks at
the top of the Global Financial Centres Index (see Figure 1.1). The exchange has
approximately 3000 companies from over 70 countries that are listed and traded on its markets. Therefore, investigating the UK market would provide more insights for understanding the impact of managerial sentiment in Europe and the global market.
Figure 1.1: Global Financial Centres Index
The figure is adapted from Accessing the Global Market Through London report, available at: http://www.lseg.com
Furthermore, another reason for investigating the UK market is to antici-pate future research opportunities. The European Commission (EC) provides the data on managerial and consumer sentiments for 27 European Countries. For ev-ery country, businesses and consumers are surveyed for their opinions regarding economic and business conditions. The surveys are then harmonized to generate comparable data for the countries that have been surveyed. The availability of such data will allow for an expansion of this research to other European countries.
1.4. Outline of the thesis
The rest of the thesis is structured as follows: Chapter 2 investigates the rela-tionship between managerial sentiment and stock returns at the aggregate market and sectors levels. Chapter 3 examines sentiment transmission from managers to investors. The empirical tests of traditional versus sentiment-augmented asset pricing models are detailed in chapter 4. Chapter 5 concludes the thesis.
Chapter 2
Managerial Sentiment, Consumer
Confidence and Sector Returns
2.1. Introduction
Studies in the relatively recent field of behavioural finance have identified pricing anomalies which contradict the expectations of the efficient markets hy-pothesis. In particular, considerable attention has focused on how market prices
are influenced by investor sentiment (Baker & Wurgler, 2006; Baker et al., 2012;
Da et al., 2015; Lee et al., 1991). Investor or market sentiment is defined in the financial literature as the prevailing attitude or feeling in the market as revealed by movements of stock prices. A large and growing literature examines the rela-tionship between various proxies for investor sentiment and stock returns. We add to this literature in two ways. Using UK data from European Commission (EC) business and consumer surveys between January 1985 and December 2014, we analyse managerial sentiment as a proxy for investor sentiment. Further, we ex-amine the impact of managerial sentiment and consumer confidence, a commonly used proxy for investor sentiment, on stock returns at the sectoral level.
Investment-related sentiment is not directly observable and so previous stud-ies have used a number of proxstud-ies - including investor surveys, closed-end fund
discounts, mutual fund flows and composite sentiment indices - which have been
found to significantly influence stock prices (Baker & Wurgler, 2006; Frazzini &
Lamont, 2008; Lee et al., 1991). In addition, various studies use information
pro-vided by consumer sentiment surveys as measure of investor sentiment (Ferrer
et al., 2016; Fisher & Statman, 2003; Jansen & Nahuis, 2003; Otoo, 1999). How-ever, their findings do not provide a consistent view of the association between consumer confidence and market values.
Contrary to consumer confidence studies, surveys of business confidence assess managerial sentiment regarding past and future performance. When compared to consumers, managerial access to business information allows for a more informed opinion of future market conditions. In this view, managerial sentiment informs
investor sentiment and thereby stock-pricing. Baker & Wurgler (2013) include
both sentiment from corporate insiders and surveys of consumer confidence in their list of potential proxies for investor sentiment. Thus, the first contribution of our study is to provide evidence on how managerial sentiment differs from consumer confidence in predicting stock returns.
Furthermore, sentiment studies predominantly examine the impact of investor
sentiment proxies on aggregate market sentiment. Brown & Cliff (2004) suggest
that aggregate sentiment measures are used primarily due to data limitations since sentiment measures such as surveys, advance-decline ratio and closed-end fund discounts are not commonly available at disaggregated levels. In addition, Brown and Cliff argue that aggregate sentiment effects become negligible when the number of stocks affected by high sentiment equals the number of stocks affected by low sentiment. This argument suggests that, when sentiment varies between sectors, aggregate measures of sentiment may not be sufficient to detect impacts on stock prices. Thus, our study also provides new evidence on the impact of investor sentiment on sector returns. Moreover, increasing attention to industry effects in the investment allocation literature provides further support for
exam-ination of sentiment at industry level. For example, Chen et al. (2006) suggest
strategies. Marcelo et al. (2013) find that diversification based on industry leads to more efficient portfolios.
By examining the associations between managerial sentiment and sector re-turns, we provide significant evidence for investors and portfolio managers regard-ing which industries are most susceptible to sentiment. In addition, our findregard-ings are informative for policy-makers and regulators whose decisions affect stock prices. The rest of this chapter is structured as follows: The next section reviews the existing literature. Section 3 describes the data and provides some descriptive statistics and preliminary tests. Section 4 describes the methodology used and discusses results. Section 5 concludes.
2.2. Literature review
There has been a long running debate in the academic literature regarding the success of the efficient market hypothesis in explaining the predictability in asset returns. The classical theory assumes financial markets are efficient; investors are rational and diversify to optimize the statistical properties of their investments. Even if some investors are irrational, prices are brought back into equilibrium
by the actions of arbitrageurs (Antoniou et al., 2013; Baker & Wurgler, 2006).
It follows then that there is no role for investor irrationality on asset pricing. However, research on behavioural finance confirms that investor sentiment affects stock prices and mispricing is persistent due to costly and non-profitable arbitrage (Lee et al., 1991).
2.2.1 Market-based measures of sentiment
Although the relation between investor sentiment and stock returns is well
documented in numerous studies (Baker & Wurgler, 2006, 2007; Brown & Cliff,
2004; Da et al., 2015; Schmeling, 2009), researchers continue to debate sentiment measures and their impact on stock returns. Indeed, there is a large literature
that documents the measurability of investor sentiment and its impact on stock prices. Despite using different proxies to measure sentiment, the overall conclusion
is that sentiment is highly correlated with stock returns. For example, Baker &
Wurgler(2006) use a group of sentiment proxies and principal component analysis to investigate the relationship between sentiment and stock returns. Their results suggest a significant correlation between sentiment and lead returns, in particular younger and smaller stocks. Such stocks are more likely to attract the attention of optimists and speculators who buy on the hype of stocks and sell after the hype is over. Similarly, using technical indicators, survey data from investor intelligence,
and trading activity-related variables,Brown & Cliff(2004) find evidence
support-ing the co-movement of sentiment measures with market returns, particular in the long-run.
Another strand of research focuses on the predictability of sentiment to stock
returns using individual sentiment proxies. For example,Fisher & Statman(2000)
used Wall Street strategists’ mean allocation to stocks as a proxy for sentiment of large investors and report a negative relationship with S&P 500 returns. In another
key study, Lee et al.(1991) used closed-end fund discount as a proxy for investor
sentiment, and argued that closed-end fund discounts and small stocks owned by
individuals co-move with investor sentiment. In the same vein,Kaniel et al.(2008)
use the imbalances in the orders of individual stocks on the NYSE as a sentiment measure and find evidence supporting strong predicative power of future returns.
Further, using net flows of mutual funds as a proxy of investor sentiment,
Ben-Rephael et al.(2012) found a contemporaneous relationship between net exchanges to equity funds and changes in stock market prices. Similarly, issuing higher levels of equity shares compared to debt is believed to capture the market enthusiasm and
predicts subsequent lower returns (Baker & Wurgler,2000). Lee et al. (1991) use
the number of IPOs and average first day returns of IPOs as proxies for investor sentiment. They find that companies tend to time the market and issue IPOs
during periods of positive sentiment. Consistent with Lee et al. (1991), Cornelli
2.2.2 Survey-based measures of sentiment
Due to the lack of directly-observable indicators measuring investor senti-ment, a number of previous empirical studies employ consumer confidence indices
to proxy for investor sentiment (Schmeling,2009). Consumer confidence indicators
(CCIs) are perceived to contain information that predicts future market conditions such as household spending, total personal consumption growth and expenditures
on consumer durables (Bram & Ludvigson, 1998; Carroll et al., 1994; Throop,
1992). Furthermore, stock market studies report a contemporaneous correlation
between CCIs and stock market returns. However, results vary on the direction
of causality between them. For example, Fisher & Statman(2003) investigate the
validity of consumer confidence as a proxy of the individual investor sentiment and its predictive power of stock returns. Overall, they find a positive contemporane-ous relationship between changes in consumer confidence and S&P 500 returns.
In another study, Otoo (1999) use US data and find that consumer confidence
is affected by the increase in equity value. Elsewhere, using EU data, Jansen &
Nahuis (2003) find evidence supporting the relationship between CCIs and stock returns, in particular in the short run. Additionally, they reported that stock
returns predict consumer confidence but not vice versa. In contrast, Schmeling
(2009) found that consumer confidence negatively predicts stock market return for
18 industrialized countries. Further, Charoenrook (2005) investigate the
Univer-sity of Michigan Consumer Sentiment Index explanatory power for stock market return and find a positive relationship between the changes in consumer sentiment and the contemporaneous excess market returns in the long run, but negatively related to the future excess returns at one-month and one-year horizons.
Consistent with Brown & Cliff (2004), Wang et al. (2006) and Canba¸s &
Kandır (2009) indicate that investor sentiment proxies are caused by stock
re-turns and volatility rather than vice versa. According to Ferrer et al. (2016), the
causality from stock returns to CCIs could be interpreted as an information effect (higher stock returns means good economic conditions and higher optimism) or as a wealth effect (higher value of equity leads to higher wealth). On the other
hand, Lemmon & Portniaguina(2006) identified the forecasting power of investor sentiment, as measured by consumer confidence, in predicting stock market re-turns and find a relationship between consumer confidence and stock rere-turns only for small stocks and stocks with low degrees of institutional ownership. Similarly,
Schmeling(2009) suggests that there is a two-way causality such that investor sen-timent depends on previous returns and the returns depend on previous investor
sentiment. For trading strategies,Antoniou et al.(2013) find that CCIs affects the
profitability of momentum-based strategies but only in periods of high optimism. They argue that in periods of high sentiment, smaller investors are reluctant to sell losing stocks. Conversely, larger investors are usually ready to sell losing stocks promptly and profit from momentum strategies.
Most recently,Ferrer et al.(2016) argue for the inappropriateness of consumer
confidence indicator as a proxy for investor sentiment. Using data for the EU and the US, they investigated the relationship between stock returns and CCIs around the dotcom bubble period. Their finding suggests that CCIs failed to forecast stock returns, particularly for the EU countries after the dotcom bubble. Importantly, the majority of studies finding support for CCIs as a measure of sentiment have used US data. This may reflect the sentiment of individual investors who represent a larger proportion of US market participants compared to the EU market.
2.2.3 Sector effect
The majority of literature on the relationship between investor sentiment and stock returns concerns the aggregate market. Notably, studies on how equity man-agers allocate their investment pay considerably more attention to sectoral effects
on returns and diversification strategies (Baca et al., 2000; Cavaglia et al., 2000;
Griffin & Karolyi, 1998). For example, Chen et al. (2006) investigated the im-portance of sector effects in diversification strategies for developed and emerging markets. Their findings suggest that, for developing markets, sector-based strate-gies become more important than country-based stratestrate-gies. For emerging markets,
they advocate sector-based strategies despite finding that country-based strategies still dominate the allocation of investments in these markets.
Another stream of research provides evidence on the significance of
indus-try factors on periods with high volatility (see for example, Marcelo et al., 2013;
Soriano & Climent,2006). In a key study,Marcelo et al.(2013) find that industry-based diversification leads to more efficient portfolios. Additionally, they provide an evidence supporting diversification across industries provides better protec-tion in periods of high volatility compared to diversificaprotec-tion associated with coun-tries. In addition to the impact of industries on investment diversification, recent studies have investigated industry-level returns as predictors of economic activity.
Laopodis (2016) examines the relationship between industries returns, macroeco-nomic variables and aggregate market returns. The findings show that industry portfolios explain macroeconomic indicators such as inflation, unemployment rate and dividend yield. Further, Laopodis demonstrates that returns in some indus-tries such as Food, Mining, Consumer, Construction and Machinery contain valu-able information supporting decisions related to investments on the stock market. Overall, findings with respect to the importance of industry effect provide support for our investigation of the relationship between sentiment and return at a sectoral level.
As evidence against the reliability of consumer confidence indicator has ac-cumulated and the importance of investigating the sentiment-sector return rela-tionship have been documented, in our study, we argue that managerial sentiment is an appropriate predictor of stock market return since managers possess direct information of the past, current and the future of their businesses compared to consumer. In addition, the availability of data on sector-specific sentiment pro-vides the ability to asses how the sentiment-return relationship is shaped by the characteristics of each industry.
2.3. Data and descriptive statistics
2.3.1 Data on investor sentiment
This study uses confidence indicators published by the European Commis-sion (EC) as proxies for investor sentiment. The indicators are calculated using business and consumer surveys which are conducted on a monthly basis by na-tional institutions (such as ministries, statistical offices, central banks, research institutes, business associations or private companies) in 27 European countries. For every country, businesses and consumers are surveyed seeking their opinions regarding the economic conditions and short term forecasting. The surveys are then harmonized to generate comparable data for the countries that have been surveyed.
For business indicators, five surveys are conducted on a monthly basis with more questions added to every survey on a quarterly basis. The surveys cover Manufacturing, Construction, Retail Trade, Services, and Financial Services sec-tor groupings. A biannually investment survey of the Manufacturing secsec-tor is conducted to gather information on companies’ investment plans. Classification of business surveys into sectors follows the classification of economic activities in the European Community (NACE Rev. 2). The EC includes multiple industries in each of the five sector groupings. Therefore, each survey under the NACE Rev. 2 classification reflects one or more industries of the Industry Classification Benchmark (ICB). For example, the EC Manufacturing sector cover Industrials
and Basic Materials industries from the ICB.1
Survey data is collected for the period from January 1985 to December 2014 for all sectors except the services sector. For the Services sector, data is not
available until January 1997. Prior to May 2006, the Services sector surveys
included Financial Services firms. From May 2006 onwards, Financial Services sentiment was surveyed separately. This indicates a statistical break in the Services
sector sample. Therefore, we take the Services sector sentiment as our indicator for the sample period from May 2006 to December 2014. For Financial Services, confidence indicators is not available for individual countries but rather for the whole EU. Hence, they are excluded from our analysis as a sentiment index. The
number of companies covered by EC surveys by sector is displayed in Table 2.1.
Table 2.1
Sample size for business surveys in the UK and the EU.
This table presents the sample size for business surveys in the UK and the EU. In the UK, business surveys are collected by National Institutions (NI) such as the Confederation of British Industry (CBI) and Experian (EXP).
Sectors Manufacturing Services Retail trade Construction
UK 1500 1000 500 750
EU 38,270 43,720 30,730 22,140
NI CBI CBI CBI EXP.
Monthly surveys are performed in the first ten days of each month for all business and consumer indicators. Survey questions use a Likert-type scale with responses divided into three, five or six options in an ordinal scale. Example of replies are (“increase”, “remain unchanged”, “decrease”), (“more than sufficient”, “sufficient”, “not sufficient”), or (“too large”, “adequate”, “too small”). Sample questions for each sector and the method of constructing confidence indicators are
included in Appendices1 and 2.2
The aggregate sentiment indicator for the market, Economic Sentiment In-dicator (ESI), is the weighted average of all confidence inIn-dicators with 40% to Manufacturing, 30% to Services, 20% Consumers, 5% for each of Construction
and Retail Trade sectors.3 The descriptive statistics for ESI and sector confidence
indicators are shown in Table2.2.
Values for ESI are transformed to have a mean of 100 and standard deviation of 10. The whole market is identified as optimistic about the economy if the value of the ESI is above 100 and pessimistic if it is below 100. Each of the business and consumer confidence indicators has a mean equals zero. Values of confidence
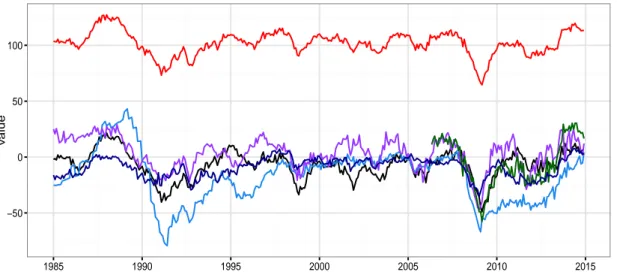
indicators along with Economic Sentiment Indicator are presented in Figure2.1.
2More information on the method is available on the EC web site at: http://ec.europa.eu,
accessed on 26 May 2016.
Table 2.2
Descriptive statistics and correlation for economic, consumer and managerial sentiment indicators.
Data covers the period from January 1985 to December 2014 for the economic sentiment, consumer confidence and sector sentiment indicators except Services sector. Services sector sample starts from May 2006 to December 2014. The fourth column represents the ”trimmed” values at 1%.
Panel A : Descriptive statistics
Economic and Consumer Confidence Indicators
mean sd trimmed min max
Economic 101.77 10.71 101.86 64.60 127.20 Consumer -9.29 8.64 -9.23 -35.20 7.60 Managerial sentiment Manufacturing -7.33 12.59 -7.23 -49.00 21.60 Construction -17.19 23.40 -17.17 -79.30 43.10 Retail Trade 3.38 13.78 3.58 -47.10 29.00 Services -4.96 20.8 -4.79 -57.40 30.40 Panel B: Correlations
Manufacturing Construction Retail Trade Services
Construction 0.60***
Retail Trade 0.66*** 0.55***
Services 0.81*** 0.86*** 0.75***
Consumer 0.43*** 0.63*** 0.52*** 0.84***
Levels of significance for correlation coefficients are ***:0.01, **:0.05, *:0.1.
−50 0 50 100 1985 1990 1995 2000 2005 2010 2015 v alue
Market Manufacturing Construction Retail trade Services Consumer
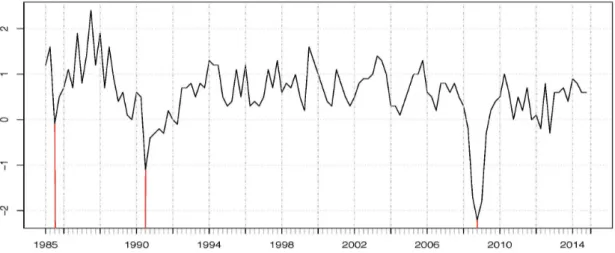
Figure 2.2: UK GDP growth rate
The red line corresponds to major events which affected the UK economy (recessions of the late-1980s, early-1990s and the Global
Financial Crisis (GFC), respectively)
All confidence indicators reflect major events in the economy. Figure2.2shows
the growth rate of UK GDP and indicates the major events affecting confidence indicators during the period. Confidence indicators are associated with the major events that have affected the UK economy including the recession of the late-1980s, recovery in the mid-1990s and the Global Financial Crisis (GFC) can clearly be
seen from the graph in Figure 2.1. On average, Retail Trade and Services sectors
encounter high average levels of confidence indicators. Notably, the Construction industry is associated with a lower level of sentiment. Importantly, sentiment in the Construction industry is highly sensitive to shocks in the market. Furthermore, the effect of these shocks on the Construction sector sentiment takes more time to return to mean levels compared to other sectors. Confidence indicators are more volatile for Construction, Retail Trade and Services compared to Manufacturing and Consumer confidence indicators.
Correlations between confidence indicators are relatively high and significant between sectors. However, plotting correlations with 12 month windows over the sample period shows a wave-like pattern indicating unstable correlation (see Figure
2.3). Confidence indicators have strong positive correlation following major events.
Jan 85 Jan 88 Jan 92 Jan 96 Jan 00 Jan 04 Jan 08 Jan 12 Dec 14 −1.0 −0.5 0.0 0.5 1.0
Manufacturing and Construction
−80 −60 −40 −20 0 20 40 Manufacturing Construction
Jan 85 Jan 88 Jan 92 Jan 96 Jan 00 Jan 04 Jan 08 Jan 12 Dec 14
−1.0
−0.5
0.0
0.5
1.0
Manufacturing and Retail trade
−80 −60 −40 −20 0 20 40 Manufacturing Retail trade
May 06 May 07 May 08 May 09 May 10 May 11 May 12 May 13 May 14
−1.0
−0.5
0.0
0.5
1.0
Manufacturing and Services
−80 −60 −40 −20 0 20 40 Manufacturing Services
Jan 85 Jan 88 Jan 92 Jan 96 Jan 00 Jan 04 Jan 08 Jan 12 Dec 14
−1.0
−0.5
0.0
0.5
1.0
Manufacturing and Consumer
−80 −60 −40 −20 0 20 40 Manufacturing Consumer
Jan 85 Jan 88 Jan 92 Jan 96 Jan 00 Jan 04 Jan 08 Jan 12 Dec 14
−1.0
−0.5
0.0
0.5
1.0
Construction and Retail trade
−80 −60 −40 −20 0 20 40 Construction Retail trade
May 06 May 07 May 08 May 09 May 10 May 11 May 12 May 13 May 14
−1.0
−0.5
0.0
0.5
1.0
Construction and Services
−80 −60 −40 −20 0 20 40 Construction Services
Jan 85 Jan 88 Jan 92 Jan 96 Jan 00 Jan 04 Jan 08 Jan 12 Dec 14
−1.0
−0.5
0.0
0.5
1.0
Construction and Consumer
−80 −60 −40 −20 0 20 40 Construction Consumer
May 06 May 07 May 08 May 09 May 10 May 11 May 12 May 13 May 14
−1.0
−0.5
0.0
0.5
1.0
Retail trade and Services
−80 −60 −40 −20 0 20 40 Retail trade Services
Jan 85 Jan 88 Jan 92 Jan 96 Jan 00 Jan 04 Jan 08 Jan 12 Dec 14
−1.0
−0.5
0.0
0.5
1.0
Retail trade and Consumer
−80 −60 −40 −20 0 20 40 Retail trade Consumer
May 06 May 07 May 08 May 09 May 10 May 11 May 12 May 13 May 14
−1.0
−0.5
0.0
0.5
1.0
Services and Consumer
−80 −60 −40 −20 0 20 40 Services Consumer
Figure 2.3: Rolling correlation between sentiment indicators Each graph plots the rolling correlation between two sentiment
2.3.2 Data on stock returns
Our analysis covers the relationship between consumer and managerial sen-timent and stock returns for the aggregate market and individual sectors. We used FTSE All Share Index monthly returns for the aggregate level of stock
re-turns. Following Jansen & Nahuis (2003), we calculated monthly returns as the
simple average of the first ten days returns to avoid any spurious causality due to non-synchronous observations.
Sector returns have been obtained by classifying FTSE All-Share Index con-stituents into sectors. For each firm, we used the Industry Classification Bench-mark (ICB) obtained from Datastream. Sector returns are matched to the ’Classi-fication’ of economic activities in the European Community (NACE Rev. 2). For example, using the ICB system, Associated British Foods plc is classified under the “Food Producer” sector name. Consequently, the company has been placed under the “Manufacture of food products” category in the NACE. This ended up with four sector return indices that match the corresponding sector sentiment
indicators and another index for Financial Services sector.4 The number of firms
in each sector is as follows: Manufacturing (212); Construction (13); Retail Trade (34); Services (78); and Financial Services (278).
Sector returns, as displayed in Figure2.4, are the summation of daily returns
weighted by the market value of its constituents. Returns are winsorized at 1% level to eliminate the effect of outliers. Both FTSE All-Share Index and sectors prices data are obtained from Datastream for the period from January 1985 to
December 2014. Table 2.3 shows descriptive statistics and correlation coefficients
for market and sector returns.
4The reason for the inclusion of Financial Services return index despite the unavailability of a
corresponding sentiment index is its importance in the stock market. The sector accounts for 24.07% and 20.34% of the FTSE All-Share and FTSE 100 indices constituents, respectively.
Jan 85 Jan 88 Jan 90 Jan 92 Jan 94 Jan 96 Jan 98 Jan 00 Jan 02 Jan 04 Jan 06 Jan 08 Jan 10 Jan 12 Jan 14 −0.20 −0.15 −0.10 −0.05 0.00 0.05 Value Market Jan 85 Jan 88 Jan 90 Jan 92 Jan 94 Jan 96 Jan 98 Jan 00 Jan 02 Jan 04 Jan 06 Jan 08 Jan 10 Jan 12 Jan 14 −0.20 −0.15 −0.10 −0.05 0.00 0.05 Value Man ufacturing Jan 85 Jan 88 Jan 90 Jan 92 Jan 94 Jan 96 Jan 98 Jan 00 Jan 02 Jan 04 Jan 06 Jan 08 Jan 10 Jan 12 Jan 14 −0.15 −0.05 0.00 0.05 0.10 0.15 0.20 Value Construction Jan 85 Jan 88 Jan 90 Jan 92 Jan 94 Jan 96 Jan 98 Jan 00 Jan 02 Jan 04 Jan 06 Jan 08 Jan 10 Jan 12 Jan 14 −0.15 −0.10 −0.05 0.00 0.05 0.10 Value Retail trade Dec 06 Dec 07 Dec 08 Dec 09 Dec 10 Dec 11 Dec 12 Dec 13 No v 14 −0.10 −0.05 0.00 0.05 Value Ser vices Jan 85 Jan 88 Jan 90 Jan 92 Jan 94 Jan 96 Jan 98 Jan 00 Jan 02 Jan 04 Jan 06 Jan 08 Jan 10 Jan 12 Jan 14 −0.20 −0.15 −0.10 −0.05 0.00 0.05 0.10 0.15 Value Financial Figure 2.4: Mark et and sectors returns
Table 2.3
Descriptive statistics and correlation for market and sector returns.
Data covers the period from January 1985 to December 2014 for the whole UK market and sectors returns except Services sector. Services sector sample starts from May 2006 to December 2014. To remove the impact of any outliers, we ”trimmed” our data at 1% level.
Panel A: Descriptive statistics
mean sd trimmed min max
Market 0.34% 2.76% 0.43% -20.17% 6.13% Manufacturing 0.58% 2.77% 0.67% -20.22% 6.44% Construction 0.56% 4.27% 0.55% -16.25% 19.32% Retail trade 0.36% 3.29% 0.40% -14.46% 10.39% Services 0.23% 3.19% 0.32% -14.02% 5.12% Financials 0.65% 3.54% 0.70% -19.99% 14.06% Panel B: Correlations
Market Manufacturing Construction Retail Services
Manufacturing 0.89***
Construction 0.54*** 0.51***
Retail Trade 0.73*** 0.62*** 0.50***
Services 0.89*** 0.80*** 0.58*** 0.77***
Financials 0.88*** 0.71*** 0.50*** 0.67*** 0.83***
Levels of significance for correlation coefficients are ***:0.01, **:0.05, *:0.1.
2.3.3 Preliminary tests
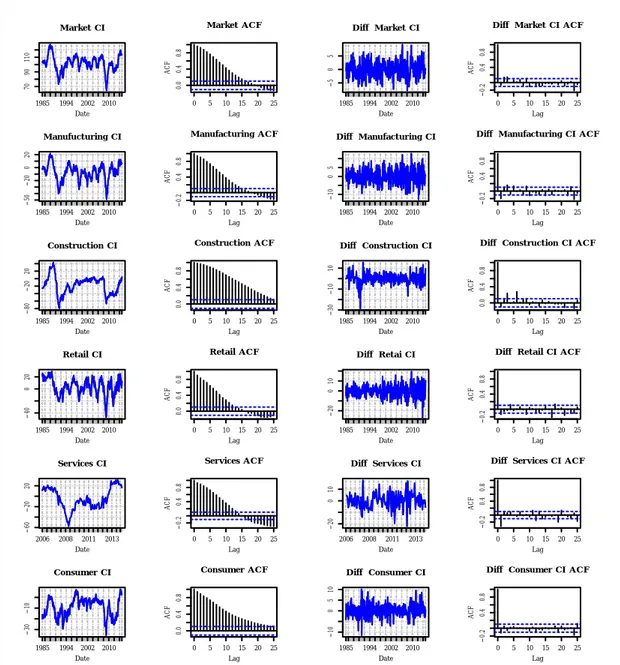
Plotting the autocorrelation function for all time series shows large
autocor-relations in confidence indicators.5 That in turn leads us to examine whether our
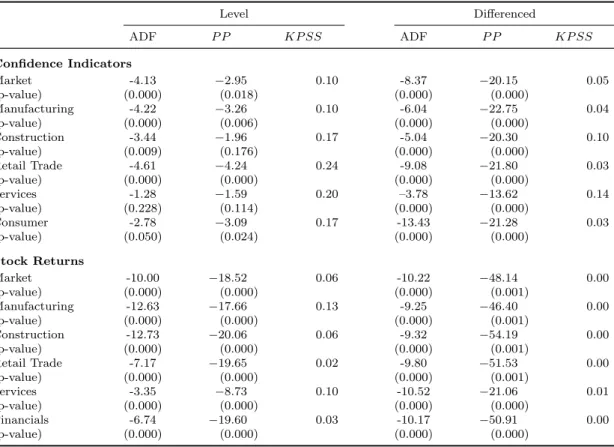
time series are unit-root non-stationary using Augmented Dickey-Fuller (ADF), Philips-Perron (PP) and Kwiatkowski-Phillips-Schmidt-Shin (KPSS) tests. Table
2.4 summarizes all tests for both level and differenced data. Based on the three
tests, all time series except Services sectors are stationary on their level values (i.e.
they have I(0)).
Notably, both ADF and PP tests confirms that Services series is nonstationary and has a unit root. On the other hand, KPSS test for stationarity shows that the series is stationary. Differencing the series removes the nonstationarity behaviour
and all tests produce the same results. Consequently, service sector has eitherI(1)
based on ADF and PP tests orI(0)based on KPSS test. The different behaviour of
the Services sector CI will lead us to change the model used to test its relationship with different returns series. This will be discussed in details in the next section.
Table 2.4
Unit root tests.
Tests are based on 360 observations for all variables except Services sector which has 104 observations. Models used for unit root test specified to include the intercept with lags of the variable. Lag length for Augmanted Dicky-Fuller (ADF) tests are determined by Akaike Information Criterion with maximum of twelve lags differences. Newey-West procedure is used to calculate bandwidths for both Philips-Perron (PP) and Kwiatkowski-Phillips-Schmidt-Shin (KPSS) tests. For spectral estimation, Bartlett’s kernel is used.
Level Differenced ADF P P KP SS ADF P P KP SS Confidence Indicators Market -4.13 −2.95 0.10 -8.37 −20.15 0.05 (p-value) (0.000) (0.018) (0.000) (0.000) Manufacturing -4.22 −3.26 0.10 -6.04 −22.75 0.04 (p-value) (0.000) (0.006) (0.000) (0.000) Construction -3.44 −1.96 0.17 -5.04 −20.30 0.10 (p-value) (0.009) (0.176) (0.000) (0.000) Retail Trade -4.61 −4.24 0.24 -9.08 −21.80 0.03 (p-value) (0.000) (0.000) (0.000) (0.000) Services -1.28 −1.59 0.20 –3.78 −13.62 0.14 (p-value) (0.228) (0.114) (0.000) (0.000) Consumer -2.78 −3.09 0.17 -13.43 −21.28 0.03 (p-value) (0.050) (0.024) (0.000) (0.000) Stock Returns Market -10.00 −18.52 0.06 -10.22 −48.14 0.00 (p-value) (0.000) (0.000) (0.000) (0.001) Manufacturing -12.63 −17.66 0.13 -9.25 −46.40 0.00 (p-value) (0.000) (0.000) (0.000) (0.001) Construction -12.73 −20.06 0.06 -9.32 −54.19 0.00 (p-value) (0.000) (0.000) (0.000) (0.001) Retail Trade -7.17 −19.65 0.02 -9.80 −51.53 0.00 (p-value) (0.000) (0.000) (0.000) (0.001) Services -3.35 −8.73 0.10 -10.52 −21.06 0.01 (p-value) (0.000) (0.000) (0.000) (0.000) Financials -6.74 −19.60 0.03 -10.17 −50.91 0.00 (p-value) (0.000) (0.000) (0.000) (0.000)
2.4. Methodology and findings
We use Granger-Causality test to examine the causality between managerial
sentiment and stock returns (Granger, 1988). For the causality from sentiment to
return, the test determines whether lagged values of sentiment contain information that is not already included in past values of stock returns, and vice versa. Our choice of the methodology is consistent with previous studies on consumer
con-fidence as a proxy for investor sentiment (Ferrer et al., 2016; Fisher & Statman,
2003; Jansen & Nahuis, 2003; Otoo, 1999; Schmeling, 2009). Some studies which use similar methods but different measures of sentiment to examine the
sentiment-returns relationship include Brown & Cliff (2004),Chung et al. (2012), Kumar &
of the following equations:6 Rt=αr+ k X i=1 βriRt−i + k X i=1 γriSt−i+υrt (2.1) St =αs+ k X i=1 βsiSt−i+ k X i=1 γsiRt−i+υst (2.2)
where St denotes sentiment indicator at time t; Rt is the monthly return of
sector groupings and the economy at timet;υ is a disturbance term; and k is the
maximal lag.
For Services sector sentiment, we employ equations 2.1 and 2.2 using level
values with maximal lag to k. In addition, when ADF and PP tests are correct
that the Services sentiment series is I(1), we use equation 2.3 and 2.4 and follow
the procedures suggested by Toda and Yamamoto (1995) to fix the asymptotics of the test. Rt=αr+ k+I X i=1 βriRt−i + k+I X i=1 γriSt−i+υrt (2.3) St =αs+ k+I X i=1 βsiSt−i+ k+I X i=1 γsiRt−i+υst (2.4)
where I is the maximal order of integration in the model which in our study
equals 1. The lag is only used to estimate the coefficients but not in use when
estimating Wald test to test whether βi and γi are jointly zero.
6Since unit root and stationarity tests result in a stationaryI(0)series for most of the sectors,
Equations 2.1 and 2.3 indicate that sentiment is believed to Granger-cause stock prices when lagged sentiment contain information that is not already in-cluded in past values of stock returns. The null hypothesis for estimated models
is H0: Sentiment does not Granger-cause returns. Equations 2.2 and 2.4 are used
to test the relationship from returns to sentiment. Table 2.5 reports
Granger-causality test results in both directions. The cross-correlation functions between
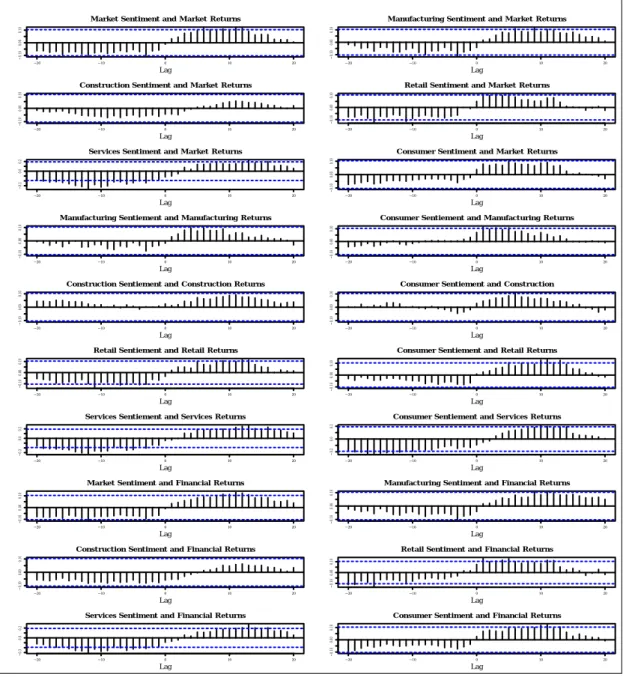
indices and returns are displayed in Appendix 4.
Where the right hand side of each cross correlation plot represents the
corre-lations between returns at time t and sentiment at time t+k (i.e. returns leads
sentiment), the other side reveals the correlations between returns at time t and
lags of sentiment. The pattern of the plots illustrates that sentiment is positively correlated to lags of returns. Furthermore, this correlation disappears with the long lags. In contrast, returns are negatively correlated to lags of sentiment sug-gesting that high returns are associated with low sentiment in previous periods
and vice versa, which is consistent with Brown & Cliff (2005), Baker & Wurgler
(2006),Lemmon & Portniaguina(2006),Schmeling(2009). However, the relation-ship between sentiment and returns in each pair is not necessary due to a causal relationship. Rather, a relationship might exist as a result of common macro
fac-tors that drive both sentiment and returns (Jansen & Nahuis,2003). The nature of
the relationship between each pair is captured by Granger causality tests reported
in Table 2.5.
Table 2.5 shows that market sentiment (Economy) Granger-causes both
ag-gregate market and Financial sector returns. The significance of this relationship relies mainly on the Manufacturing sector sentiment that constitutes 40% of ag-gregate market sentiment. This finding is supported by the lack of significance of the rest of sentiment indices in causing aggregate market returns to change. In contrast, returns of the majority of sectors Granger-cause market sentiment. At sector level, causality runs in both directions with the exception of Retail Trade and Services industries for which causality only runs from returns to sentiment.
T able 2.5 p -v alues for Granger causalit y te st s for sen timen t and aggregate mar k et and sector returns. This table presen ts the p -v alue for Granger ca usalit y tests for sen timen t indic ators and sto ck ret urn indices. The results co v er the p erio d from Jan uary 1985 to Decem b er 2014. r , g-c ause , and sent denote return, Granger-cause, and sen timen t, resp ectiv ely . Returns Mark et Man ufacturing Construction Retail T rade Services Financials Economic and Consumer Confidence Indicators Econom y 0.0173 0.0830 ( r g-c ause sent ) 0.1342 0.1030 Consumer 0.6673 0.5800 0.7611 0.1662 0.2176 0.2078 ( r g-c ause sent ) 0.0319 0.0225 0.2850 0.1544 0.3260 0.0117 Managerial sen timen t Man ufacturing 0.0003 0.0063 0.0479 ( r g-c ause sent ) 0.0062 0.0399 0.0384 Construction 0.547 9 0.07 05 0.2762 ( r g-c ause sent ) 0.3240 0.1018 0.5983 Retail T rade 0.8793 0.1622 0.7013 ( r g-c ause sent ) 0.0069 0.0146 0.0057 Services 0.0992 0.0892 0.1795 ( r g-c ause sent ) 0.0003 0.0135 0.0107 Services [w ald test] 0.505 5 0. 1320 0.8143 ( r g-c ause sent [w ald test]) 0.0004 0.0346 0.0199
These results can be interpreted in two ways. Firstly, Manufacturing and Con-struction sectors are more prone to sentiment than Retail Trade and Services sec-tors. Therefore, risks associated with their sentiment are translated into returns. However, this interpretation is inconsistent with the “hard to value” argument of
Baker & Wurgler (2007). The output of both Retail Trade and Services sectors
are hard to measure (Doms et al., 2004; Mclaughlin & Coffey, 1990). Therefore,
these sectors are more likely to be prone to fluctuations in sentiment than the Manufacturing and Construction sectors. Another way to interpret this result is that managerial sentiment indices are constructed by surveying firms rather than investors. Individual investors are subject to asymmetric information problems when valuing the companies in which they invest. Firms have more internal in-formation. Hence, firm survey data on managerial sentiment would be expected to inform stock returns. Consequently, our results point to lower levels of infor-mation asymmetry and less uncertainty in valuation of stocks in Manufacturing and Construction sectors. Our data provides evidence of resolution of information asymmetry in those sectors. Expectations are less accurately reflected in stock returns in Services and Retail Trade sectors.
For Financial Services sector, results shown in Table 2.5 are consistent with
the literature (such as Nejad & Huerta, 2014) in terms of the direction of
causal-ity. Nonetheless, the relationship is greatly affected by Manufacturing sector sen-timent. These results reveal that the relationship between sentiment and stock market returns is not consistent across sectors. Where the aggregate sentiment of the market causes adjustment to stock returns, it is the different characteristics of
the sector groupings that shapes the relationship.7
In Table 2.5, we also examine the association of consumer confidence with
stock returns at aggregate and sector levels. Notably, consumer confidence is not
7Responses on sentiment survey contains information from companies based on their previous
month performance. This may impact the relationship from returns to sentiment if returns are calculated using only the first 10 days. Therefore we repeated the analysis using the first 21 days and full month returns. The modifications had no impact on the results except for the