31
Infrastructural Development, Poverty
Reduction and Economic Growth in Nigeria
Oluwaseyi Adedayo Adelowokan
1, Felix Odunayo Ajayi
2, Olukayode Emmanuel Maku
3,
Kuburat Adesanya
4Abstract: In spite of massive revenue emanating from oil wealth, Nigeria has not been able to join the league of developed nations who have made infrastructural development and poverty reduction a frontline policy of their developmental process. This has led to critical thinking as to the exact growth implications of infrastructural development and poverty reduction approaches by the successive government of the federation. This study employed the vector auto-regressive approach to analyse the times series data on the relationship between infrastructural development, poverty reduction and output growth. We also used the impulse response function and variance decomposition to explain the responses of output to shocks within the model. The findings revealed that infrastructural development and poverty reduction positively influence economic growth in Nigeria. The impulse response functions showed that poverty reduction exhibited an inverse relationship with economic growth which means that at such periods, as economic growth is rising, poverty reduction was reducing. The study suggests that access and development of infrastructural facilities must be ensured to attain an accelerated economic growth regime, and subsequently put economic development underway. Also, poverty reduction mechanisms have to be expanded and sustained to achieve an egalitarian society that we desire.
Keywords: Infrastructural Development; Poverty; Poverty Reduction; Economic Growth; Nigeria
JEL Classifications: O11; O47
1. Introduction
In spite of massive resources emanating from oil wealth, Nigeria has failed to bail its citizenry out of intergenerational poverty through improving provisions of infrastructural facilities and poverty reduction programmes. Her richness in oil resource was labelled “resource curse” because the country
is characterised with slow growth, low savings and investment, declining human capital and stagnant productivity (Alimi & Alese, 2017). The growth experienced in the country over the period has been termed jobless growth since it fails to create employment (Maku & Alimi, 2018) and also translate to meaningful development. The growth of every economy is paramount and cannot be ignored as it serves as the foundation for its development. The recent fall in oil prices has increased the pressure on the government of the federation to find an alternate source of creating a society devoid of hardship and uneasiness. The Nigerian economy has witness economic recession recently as a result of a decline in
1Lecturer 1, Department of Economics, Nigeria, E-mail: seyiadelowokan@gmail.com. 2 Lecturer 1, Department of Economics,Nigeria, E-mail: foajayifo@yahoo.com. 3 Senior Lecturer, Department of Economics, Nigeria, E-mail:kaymarks73@yhoo.co.uk. 4 Postgraduate Student, Department of Economics,Nigeria, E-mail: mamaa10@yahoo.com.
32
its GDP for two consecutive quarters (Central Bank of Nigeria, 2017). This has led to critical thinking as to how the economy can be transformed so as to ensure its citizen can stick to the Nigerian identity. Jones (2004), Fan and Chang-Kang (2005), and Sahoo and Dash (2014) argued that increase government expenditure on infrastructure will result in economic growth. It then becomes necessary to investigate the growth effect of increased government expenditure on infrastructure in Nigeria.
In the last decades, scholars have presented divergent evidences theoretically and empirically on how infrastructural development enhanced output growth. For instance, studies like Ariyo and Jerome (2004), Calderon and Chong (2008), Ogun (2010), Estache, Wodon and Lomas (2014), and Adesoye, Adelowokan and Maku(2016) etc. have looked at the impact of infrastructure development on poverty eradication and reduction in unequal distribution of income. Majority of these studies came into consensus that the development of infrastructure facilities plays a vital role in ensuring growth and equality which are germane to help in reducing poverty.
The Nigerian government is saddled with the responsibility of providing both social infrastructures as well as economic infrastructure and also to reduce the level of poverty as well as the degree of income inequality to acceptable ranges. However, data over the years have shown that despite the high rate of GDP, Nigerians do not get the maximum utility from the available infrastructural facilities (Akinwale, 2010). The percentage of the Nigerian population that live on the prescribed US$1 per day benchmark is remarkably high (Tella & Alimi, 2016). The poor are faced with the lack of infrastructural facilities and more often not self-sufficient. Also, a new government was sworn into power often times only accept the past dispensation’s assets and reject liabilities or cost incurred by the latter, thereby leading to a discontinuity in the on-going infrastructural progress and poverty alleviation exercise.
This paper thus proposes a framework that examines the pattern and relationship among infrastructural development, poverty reduction and economic growth in Nigeria between 1986 and 2014. It seeks to provide answers to how infrastructural development and poverty reduction influence output growth in Nigeria? How does output growth respond to shock from infrastructure spending and poverty reduction programmes in Nigeria? The remaining parts of the study are divided into four sections. The review of literature is presented in the section part while section three provides the methodology and analytical approaches. The fourth part discusses empirical analysis and the last part concludes and proffers policy options.
2. Literature Review
2.1. Theory of Long-Run Development
The theory was put forward by Pierre-Richard Agénor who stated that one of the main engines of growth is the development state of infrastructural facilities of every economy (Agenor, 2010). The improvement on infrastructure has impact on productivity level and human welfare by enhancing health service delivery. This is done by government and sometimes public-private partnership by investing in infrastructure and healthcare services in order to raise labour productivity and also alleviate poverty. The public capital investment has a non-linear relationship with the degree of efficiency of infrastructure stock due to network effects. As a result, it may produce multiple equilibriums on the condition that the
33
institutional settings of an economy are productive enough to facilitate the efficiency rate of public investment outlays. Thus, growth is ensured by increasing the share of infrastructure spending as well as a reduction in unproductive expenditure or foreign grant (Agenor, 2010). The theory assumes the economy to be a closed one which is also populated by an infinite lived household-producer. The country is a mono-commodity economy producing traded commodity that can serve as consumption or investment. Government investment in infrastructure and some public goods like healthcare are made possible through revenue generated from tax. The essential commodities are provided to ensure improvement in human lives. I is worthy to note that the funds are also spent on unproductive activities that has no direct effect on the supply of infrastructure and health services.
2.2. Empirical Review
The literature on infrastructural development, poverty reduction and economic growth has been often confusing. This study traces the emergence and findings of the subject matter in a chronological order. Calderon and Serven (2004) studied the relationship between infrastructure and growth in developed and developing countries. They develop and index for infrastructure using three independent indicators, that is number of main telephone lines per 1,000 workers; electricity generation capacity of the economy in MW per 1,000 workers and the length of the road network (kilometers of roads to the total land area). Using the panel generalized methods of moment (GMM) techniques for a data set ranging from 1960 to 2000, they established that growth is robust and positively influenced by the quantity of infrastructure which was also positive but less robust for the quality of infrastructure. However, the coefficient of both the quantity and quality of infrastructure has robust and negative estimates.
Raihan (2011) examines the interrelationship between infrastructure, growth and poverty in Bangladesh. The author first constructs an index for infrastructure development using the Principal Component Analysis (PCA) and the outcome suggest that the districts having high indexes are close to the capital city. The second method (SAM Multiplier Model) was used to discover economic gains of Bangladesh from infrastructural investment. It suggests an improvement in overall output, consumer consumption and value accumulation. In magnitude terms, gross output, value-added in production and consumption rise by 8.17%, 8.07% and 7.12% respectively to an increase of 20% in infrastructural investment demand. The third involved the use of a CGE model to investigate the impact of a reduction in transport boundaries on macro and sectoral growth as well as welfare and poverty. Its findings showed that output, exports, imports, and national welfare rises by 0.57%, 0.83%, and 0.95% correspondingly as a result of 25% fall in transport margin in the sectors. Likewise, a fall in general price index and poverty rate (national headcount) by 1.43% and 1.24% respectively were also recorded. They concluded that infrastructure financing played an important role in growth promotion and poverty alleviation in the country.
Runsinarith (2011) used a household data survey from two border provinces in Cambodia in 2006 to investigate the impact of infrastructure on per capita consumption. The four indices of infrastructure (cellular, irrigation, electricity and road) also reflect the ones mentioned in Rectangular Strategy of the Royal Government of Cambodia. Using the ordinary least square and quantile regression, the results showed that the indicators of infrastructure significantly influence poverty rate negatively. While examining the role played by infrastructure development to growth and poverty reduction, Jerome
34
(2011) found that finances in infrastructure contribute to human welfare in terms of health, education and social structure as well as poverty alleviation in Africa.
Ijaiya et al. (2011) employed a multiple regression analysis to analyse the links between output growth and poverty in Nigeria. The authors take into cognisance time and difference-in-difference estimator which shows poverty as a linear function of output changes. The findings revealed that there exists a positive relationship between changes in output and poverty reduction whereas the initial level of output does not. Similarly, Ebong and Ogwumike (2013) examine the effects of output growth on poverty in Nigeria using an annual time series data ranging from 1970-2009. Their findings using the Vector Autoregressive technique and the Engel-Granger cointegration tests showed that agriculture do not reduce human capital poverty whereas other sectors were able to reduce it. Likewise, the government spending of welfare through provision of social amenities and services reduce human poverty rate. Okoroafor and Chinweoke (2013) investigated and determined the impact of poverty on the level of economic growth in Nigeria for the period 1990-2011. The Ordinary Least Square technique was adopted using multiple regression models. Their findings showed that there was a zero correlation between poverty, discomfort index and economic growth in Nigeria. The study further noted that none of the parameter estimates of Human Development Index (HDI) and Discomfort Index is statistically significant in explaining economic growth in Nigeria. The researchers recommended that the government should invest more in quality education, entrepreneurship development security of lives and properties and minimal corruption level. A study carried out by Oloyede (2014) on the effect of poverty reduction programs on economic development evidence from Nigeria for years spanning 1980-2010 using the ordinary least square technique found that the government programmes on poverty alleviation tends to play a significant role in reducing human-capital poverty.
3. Methodology
3.1. Model Specification
In accounting for the nexus between infrastructural development, poverty reduction and economic growth in Nigeria, this study adopts the Solow growth model as specified in the work of Sahoo, Dash & Nadaraj (2010). The Solow model is
𝑄 = 𝑓(𝐾, 𝐿) (1)
Where 𝑄 is the national output, 𝐾 represents capital resources employed and 𝐿 for unit of labour employed in the production process. However, since our focus is on the public sector influence, the model includes gross fixed capital formation (GFCF) and government expenditure on road/construction (GERC) as proxies for infrastructural development, relative poverty rate (RPVR) as a proxy for poverty reduction and Gross Domestic Product per Capital Growth (GDPPCG) as a proxy for economic growth. The functional form is given as
35
Where: 𝐺𝐷𝑃𝑃𝐶𝐺 = Gross Domestic Product per Capital Growth, 𝐺𝐹𝐶𝐹= Rate of Investment (proxy by Gross Fixed Capital formation), 𝐺𝐸𝑅𝐶= Government Expenditure on Road/Construction, and 𝑅𝑃𝑉𝑅 = relative poverty rate
Restating the model in an econometric form:
𝐺𝐷𝑃𝑃𝐶𝐺𝑡= 𝛽0+ 𝛽1𝐺𝐹𝐶𝐹𝑡 + 𝛽2𝐺𝐸𝑅𝐶𝑡+ 𝛽3𝑅𝑃𝑉𝑅𝑡+ 𝜀𝑡 (3)
Where 𝜀𝑡 represents error term and 𝛽0, 𝛽1, 𝛽2, 𝑎𝑛𝑑 𝛽3 𝑎𝑟𝑒 𝑝𝑎𝑟𝑎𝑚𝑒𝑡𝑒𝑟 𝑒𝑠𝑡𝑖𝑚𝑎𝑡𝑒𝑠
These variables are log-linearized to adjust for heteroskedasticity and variance in dimension in units and measurements
𝑙𝑛𝐺𝐷𝑃𝑃𝐶𝐺𝑡 = 𝛽0+ 𝛽1𝑙𝑛𝐺𝐹𝐶𝐹𝑡 + 𝛽2𝑙𝑛𝐺𝐸𝑅𝐶𝑡+ 𝛽3𝑙𝑛𝑅𝑃𝑉𝑅𝑡+ 𝜀𝑡 (4)
3.2. Data Sources and Measurements
Our study used time series data for economic growth (measured with real GD per Capital) and indicators for infrastructural development (government expenditure on road/construction, gross capital formation) and poverty reduction (relative poverty rate) in Nigeria from 1986 through 2014. The data are mainly obtained from the National Bureau of Statistics (NBS, 2014), CBN statistical bulletin various issues up until 2014 and World Bank Database (World Development Indicator, 2015).
3.3. Estimation Technique
To examine the dynamic relationship among infrastructural development, poverty reduction and economic growth in Nigeria, the Vector Autoregressive (VAR) model technique is utilised. The VAR model is used to analyse multivariate time series data. The equation is stated as:
𝐴𝑂𝑌
𝑡 = 𝐴𝑂𝑌𝑡−1 + … . . … . . + 𝐴𝑘 𝑌𝑡−𝑘 + 𝐶𝐷𝑡 + 𝐵𝐸𝑡 (5)
Where 𝑦𝑡= (𝑦1𝑡, 𝑦2𝑡, … 𝑦𝑛𝑡) is a 4 by 1 vector of our variables and𝐴𝑖and 𝐶are parameter estimates in a matrix order. The 𝐷𝑡 are deterministic indicators that also have a constant and linear trend. Moreover, 𝐸𝑡, is a vector of structural shock or innovations which is assumed to be a stochastic term. The VAR model is expressed in a system as:
p i p i p i t i t t i t t i t t p i i t t t c GDPPCG RPVR GERC GFCF GDPPCG 1 1 1 , 1 , 14 , 13 , 12 1 , 11 1
(6) t p i i t i p i i t i p i i t i p i i t i t c GDPPCG RPVR GERC GFCF RPVR 2, 2 , 24 2 , 23 2 22 2 , 21 2
(7) t i t p i t i t p i t i t p i t i t p i i t c GDPPCG RPVR GERC GFCF GERC 3, 3 34 3 , 33 3 , 32 3 , 31 3
(8)
p i p i t p i i t t i t t i t t p i i t t t c GDPPCG RPVR GERC GFCF GFCF 4 4 , 4 4 , 44 , 43 , 42 4 , 41 4
(9)The VAR (p) system equation (6) to equation (9) can be represented in a reduced form within a matrix framework as:
36
t t t t i t i t i t i t p i t t t t GFCF GERC RPVR GDPPCG c c c c GFCF GERC RPVR GDPPCG , 4 , 3 , 2 , 1 1 44 43 42 41 34 33 32 31 24 23 22 21 14 13 12 11 4 3 2 1
(10)The study further use an impulse response function (IRF) to trace the response of the current and future values of each variable, assuming that the errors are equal to zero, to a unit increase in the current value of one of the A=VAR errors.
4. Empirical Result and Discussion
4.1. Preliminary Analysis
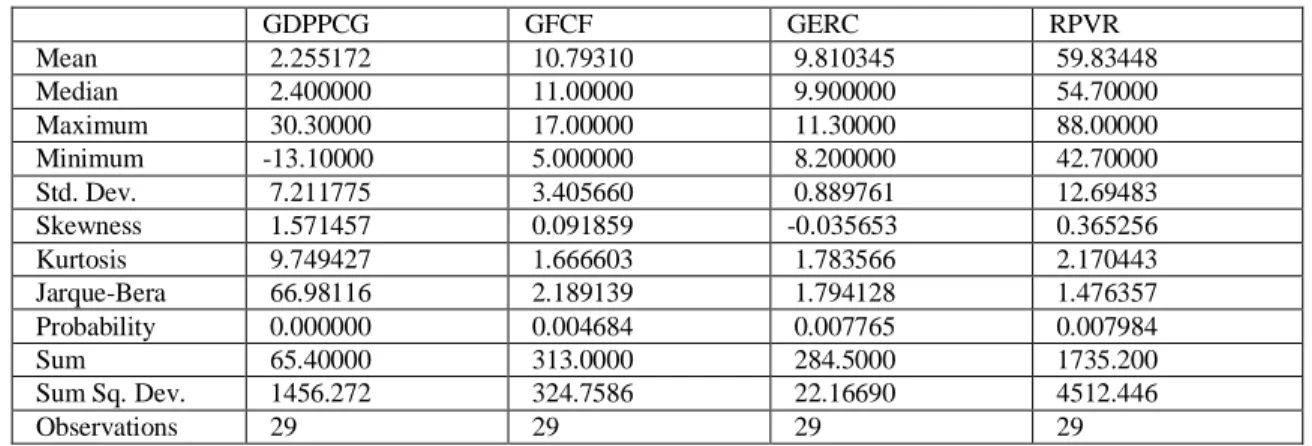
Table 1 shows the mean and median of all the observations in the data set lie within the maximum and minimum values indicating the high tendency of the normal distribution. GDP per Capital, Gross Fixed Capital Formation and Relative Poverty are positively skewed while Government expenditure on road/construction is negatively skewed. The kurtosis statistics showed that GFCF, GERC and RPVR were platykurtic, suggesting that their distributions were flat relative to a normal distribution while GDPPCG is not. The Jarque-Bera statistics shows that the series is normally distributed since the p-values of all the series are not statistically significant at 5% level. Thus informing the acceptance of null hypothesis that says each variable is normally distributed.
Table 1. Descriptive Statistics
GDPPCG GFCF GERC RPVR Mean 2.255172 10.79310 9.810345 59.83448 Median 2.400000 11.00000 9.900000 54.70000 Maximum 30.30000 17.00000 11.30000 88.00000 Minimum -13.10000 5.000000 8.200000 42.70000 Std. Dev. 7.211775 3.405660 0.889761 12.69483 Skewness 1.571457 0.091859 -0.035653 0.365256 Kurtosis 9.749427 1.666603 1.783566 2.170443 Jarque-Bera 66.98116 2.189139 1.794128 1.476357 Probability 0.000000 0.004684 0.007765 0.007984 Sum 65.40000 313.0000 284.5000 1735.200 Sum Sq. Dev. 1456.272 324.7586 22.16690 4512.446 Observations 29 29 29 29
Source: Authors’ computation, 2018
Table 2 reveals the partial correlation of the economic growth indicator and its determining variable factors. From the above, the magnitudes of some of their various relationships are low with both varying positive and negative signs. It was only the relationship between gross fixed capital formation and the other variables that were negative, the rest of the variables have a positive relationship. There is a positive relationship between government expenditure on road construction and gross domestic product
37
per capital growth. The implications of the low correlation coefficient among the variables show that there is no perfect multicollinearity among the variables.
Table 2. Correlation Matrix
GDPPCG GFCF GERC RPVR
GDPPCG 1
GFCF -0.21579 1
GERC 0.390332 -0.04819 1
RPVR 0.105179 -0.30473 0.494968 1
Source: Authors’ computation, 2018
The pre-estimation analysis was also conducted by using the Augmented Dickey Fuller test to verify the stationarity level of the indicators. The result suggests that the variables are stationary at level i.e. I(0).
Table 3. Unit Root Test Results
Variables ADF Statistics Critical Values (5%) ADF Statistics Critical Values (5 %) Decision
LEVEL FIRST DIFFERENCE
GDPPCG -4.323719 -3.689194 -7.875118 -3.699871 I(0)
GFCF -5.857852 -3.689194 -4.527708 -3.699871 I(0)
GERC -4.765471 -3.689194 -5.959064 -3.699871 I(0)
RPVR -4.317181 -3.699871 -3.327146 -2.976263 I(0)
Source: Authors’ computation, 2018
4.2. Estimation Tests
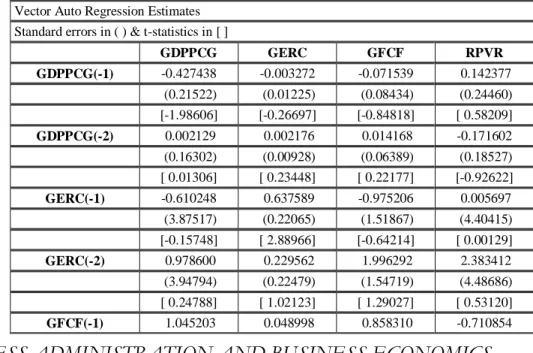
The Vector Autoregressive (VAR) model is employed to examine the dynamic effects of infrastructural development and poverty reduction on economic growth in Nigeria from 1986 to 2014. The VAR lag order selection criteria test was chosen automatically. The estimated unrestricted VAR for the dynamic analysis of the interaction mechanisms among infrastructural development, poverty reduction and economic growth in Nigeria are summarized in Table 4.
Table 4. VAR results
Vector Auto Regression Estimates Standard errors in ( ) & t-statistics in [ ]
GDPPCG GERC GFCF RPVR GDPPCG(-1) -0.427438 -0.003272 -0.071539 0.142377 (0.21522) (0.01225) (0.08434) (0.24460) [-1.98606] [-0.26697] [-0.84818] [ 0.58209] GDPPCG(-2) 0.002129 0.002176 0.014168 -0.171602 (0.16302) (0.00928) (0.06389) (0.18527) [ 0.01306] [ 0.23448] [ 0.22177] [-0.92622] GERC(-1) -0.610248 0.637589 -0.975206 0.005697 (3.87517) (0.22065) (1.51867) (4.40415) [-0.15748] [ 2.88966] [-0.64214] [ 0.00129] GERC(-2) 0.978600 0.229562 1.996292 2.383412 (3.94794) (0.22479) (1.54719) (4.48686) [ 0.24788] [ 1.02123] [ 1.29027] [ 0.53120] GFCF(-1) 1.045203 0.048998 0.858310 -0.710854
38 (0.56206) (0.03200) (0.22027) (0.63879) [ 1.85958] [ 1.53106] [ 3.89659] [-1.11282] GFCF(-2) -1.061020 -0.072489 -0.210305 0.155832 (0.53812) (0.03064) (0.21089) (0.61158) [-1.97171] [-2.36584] [-0.99723] [ 0.25480] RPVR(-1) -0.624843 -0.000663 -0.040146 1.320286 (0.22543) (0.01284) (0.08834) (0.25620) [-2.77181] [-0.05164] [-0.45442] [ 5.15334] RPVR(-2) 0.827071 0.000578 -0.032441 -0.665843 (0.22749) (0.01295) (0.08915) (0.25854) [ 3.63568] [ 0.04460] [-0.36389] [-2.57539] C -10.38578 1.659204 -1.654606 3.488269 (13.7837) (0.78482) (5.40183) (15.6653) [-0.75348] [ 2.11412] [-0.30630] [ 0.22268] R-squared 0.503608 0.908614 0.738337 0.841150 Adj. R-squared 0.282990 0.867998 0.622042 0.770550 F-statistic 2.282709 22.37089 6.348844 11.91428 Log likelihood -77.77269 -0.396413 -52.48042 -81.22759 Akaike AIC 6.427606 0.696031 4.554105 6.683525 Schwarz SC 6.859552 1.127976 4.986051 7.115471 Mean dependent 3.318519 9.914815 10.51852 60.88148 S.D. dependent 6.237605 0.827742 3.366925 12.53165
Source: Authors’ computation, 2018
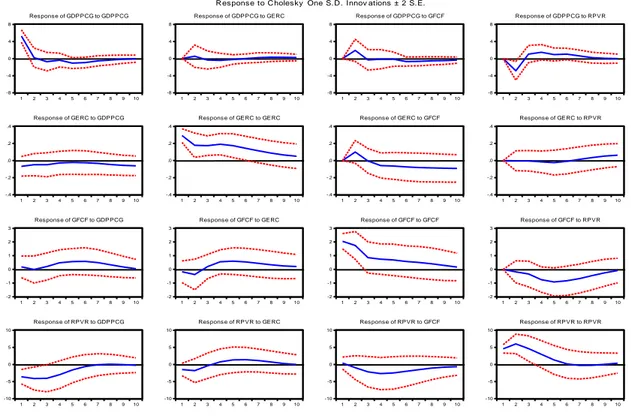
4.3.1. Impulse Response Analysis
Figure 1 presents the response of the variables for the measurement of infrastructural development, poverty reduction to Cholesky one squares variances shocks on the growth of the economy. We used the IRFs from our unrestricted VAR model to examine the response of poverty from shocks in infrastructural development and poverty reduction. In period 1, GFCF, GERC and RPVR had no response to GDPPCG. In periods three, four and five, the coefficient of government expenditure on road/construction (GERC) responded with various levels of magnitude negatively with GDPPCG while that of gross fixed capital formation (GFCF) responded positively to GDPPCG only in period two. Of all the ten periods chosen for the analysis of the IRF, the coefficient of RPVR responded positively to a one standard deviation shock to GDPPCG in period three to nine. In period one, a one standard deviation shock in GFCF was brought about by0.181962 change in GDPPCG; the coefficient was negative only in period two and positive throughout the remaining periods. RPVR responded negatively to GFCF from period two to ten. The response of RPVR to GDPPCG was positive in period eight (0.078018) and negative for the remaining periods. The response of RPVR to GDPPCG reached its lowest in period two with a value of -4.123615. The response of GFCF to RPVR although negative from period two to ten, reached its peak in period four (0.752333). It is worthwhile to note that shocks in total infrastructural development dictate the direction of the shocks for the gross domestic product per capita growth. Whereas, a shock in poverty rate indicator generated a negative shock from the infrastructural development indicators and economic growth indicator. It implies that government expenditure on
39
improving infrastructures played a major role in the performance of the economy and the rate of poverty in Nigeria.
Figure 1. Impulse Response Functions
4.3.2. Serial Autocorrelation
There are different ways to check for serial correlation and they include the Durbin Watson (DW) statistics, Q statistics or LM test. For this study, we will make use of Q statistics and LM test because the model is an auto-regressive one. Using the Q statistics, whose null hypothesis is there is no serial autocorrelation and the alternative hypothesis is there is serial autocorrelation. From the results, as shown in Table 5, all P-values are more than 5%, therefore we accept null hypothesis i.e. this model is free from serial correlation.
Table 5. Correlogram Q-Statistics
Autocorrelation Partial Correlation AC PAC Q-Stat Prob
.**| . | .**| . | 1 -0.243 -0.243 1.8413 0.175 . | . | . *| . | 2 -0.022 -0.086 1.8566 0.395 . | . | . | . | 3 0.053 0.028 1.9507 0.583 . | . | . | . | 4 0.033 0.055 1.9882 0.738 . | . | . | . | 5 -0.002 0.027 1.9883 0.851 . |**. | . |**. | 6 0.249 0.276 4.3588 0.628 . *| . | . | . | 7 -0.111 0.024 4.8538 0.678 . | . | . | . | 8 0.036 0.038 4.9075 0.767 . | . | . | . | 9 0.009 -0.009 4.9110 0.842 . *| . | . *| . | 10 -0.120 -0.167 5.5840 0.849 . | . | . | . | 11 0.054 -0.046 5.7291 0.891 . | . | . *| . | 12 0.012 -0.077 5.7365 0.929
Source: Authors’ computation (2018).
-8 -4 0 4 8 1 2 3 4 5 6 7 8 9 10 Response of GDPPCG to GDPPCG -8 -4 0 4 8 1 2 3 4 5 6 7 8 9 10 Response of GDPPCG to GERC -8 -4 0 4 8 1 2 3 4 5 6 7 8 9 10 Response of GDPPCG to GFCF -8 -4 0 4 8 1 2 3 4 5 6 7 8 9 10 Response of GDPPCG to RPVR -.4 -.2 .0 .2 .4 1 2 3 4 5 6 7 8 9 10 Response of GERC to GDPPCG -.4 -.2 .0 .2 .4 1 2 3 4 5 6 7 8 9 10
Response of GERC to GERC
-.4 -.2 .0 .2 .4 1 2 3 4 5 6 7 8 9 10 Response of GERC to GFCF -.4 -.2 .0 .2 .4 1 2 3 4 5 6 7 8 9 10 Response of GERC to RPVR -2 -1 0 1 2 3 1 2 3 4 5 6 7 8 9 10 Response of GFCF to GDPPCG -2 -1 0 1 2 3 1 2 3 4 5 6 7 8 9 10 Response of GFCF to GERC -2 -1 0 1 2 3 1 2 3 4 5 6 7 8 9 10 Response of GFCF to GFCF -2 -1 0 1 2 3 1 2 3 4 5 6 7 8 9 10 Response of GFCF to RPVR -10 -5 0 5 10 1 2 3 4 5 6 7 8 9 10 Response of RPVR to GDPPCG -10 -5 0 5 10 1 2 3 4 5 6 7 8 9 10 Response of RPVR to GERC -10 -5 0 5 10 1 2 3 4 5 6 7 8 9 10 Response of RPVR to GFCF -10 -5 0 5 10 1 2 3 4 5 6 7 8 9 10 Response of RPVR to RPVR
40
Also, using the Breusch-Godfrey LM statistics, from the result in Table 6, the P-value of the observed R-Squared (37.31%) is greater than 5%, so we accept the null hypothesis that the model has no serial correlation.
Table 6. Serial Correlation LM Test
Breusch-Godfrey Serial Correlation LM Test
F-statistic 0.833235 Prob. F(2,22) 0.4479
Obs*R-squared 1.971615 Prob. Chi-Square(2) 0.3731 Source: Authors’ computation (2018)
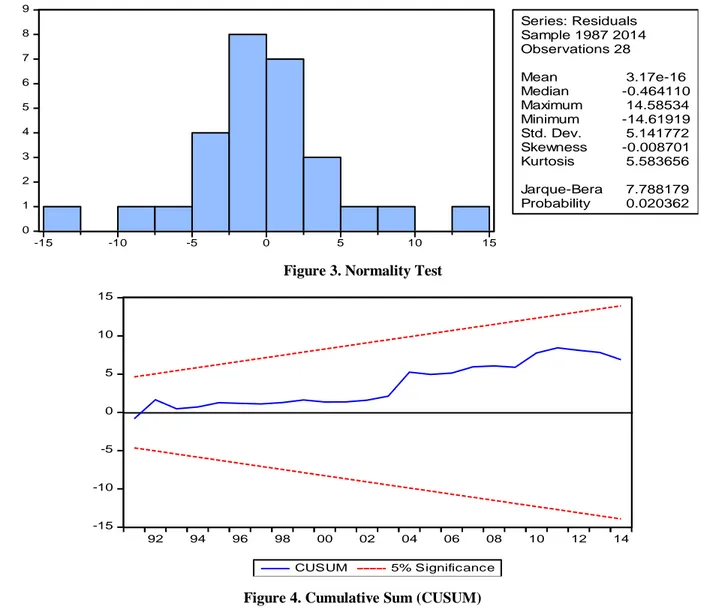
The Jarque-Bera test results for normality test indicate that the study do not reject the null hypothesis that the error terms are not normally distributed.
Figure 3. Normality Test
Figure 4. Cumulative Sum (CUSUM) 0 1 2 3 4 5 6 7 8 9 -15 -10 -5 0 5 10 15 Series: Residuals Sample 1987 2014 Observations 28 Mean 3.17e-16 Median -0.464110 Maximum 14.58534 Minimum -14.61919 Std. Dev. 5.141772 Skewness -0.008701 Kurtosis 5.583656 Jarque-Bera 7.788179 Probability 0.020362 -15 -10 -5 0 5 10 15 92 94 96 98 00 02 04 06 08 10 12 14 CUSUM 5% Significance
41
From Figure 4, the plot of parameter stability test by Cumulative Sum (CUSUM) shows that the estimated parameters are constant and stable within the period of the study at 5% level of significance.
5. Conclusion and Recommendations
Findings from the study showed that the infrastructural development and poverty reduction indicators influence economic growth in Nigeria. Results from the impulse response functions showed that poverty reduction exhibited more of an inverse relationship with economic growth which means that at such periods, as economic growth is rising, poverty reduction was reducing. For the periods where there were positive responses, it means that the growth experienced by the economy at this said period did not translate to the improvement in the standards of living of the populace. Also, in line with a priori expectation, the responses of the infrastructural development indicators with economic growth was majorly positive; an affirmation of the existence of a positive relationship.
Although the model formulated in this study was stable and there was the absence of serial auto-correlation, it was not normally distributed. This implies that the model formulated in this study was suitable and desirable. The variable- gross fixed capital formation confirmed with apriori expectation. It exhibited a positive relationship with economic growth whereas the second proxy for infrastructural development had a negative relationship with GDP per capita growth. The poverty rate showed an inverse relationship with economic growth and this conforms with a priori expectation, but it is alarming to know that despite the fluctuations experienced as regards gross domestic product per capita growth, the poverty rate in Nigeria has not reduced. This could be as a result of the inequality in the distribution of income in Nigeria.
This study concludes that to attain an accelerated economic growth regime, and subsequently put economic development underway, infrastructural facilities have to be developed and access to it must be ensured. In all, provision of infrastructural facilities and reduction of the rate of poverty if experienced by the residents in Nigeria will ensure greater output productivity and positive impact on the economy both in the short run and the long run.
References
Adesoye, A.B.; Adelowokan, O.A. & Maku, O.E. (2016). Infrastructural Financing and Economic Growth in Nigeria: Implication on Sustainable Development in the 21st Century’. Ife Social Sciences Review, A Journal of the Faculty of Social Sciences, O.A.U, Ile-Ife. Osun State. Special issue, pp. 421-432.
Agenor, P.R. (2010). A theory of infrastructure-led development. Journal of Economic Dynamics and Control, 34(5), pp. 932-950.
Akinwale, A.A. (2010). The menace of inadequate infrastructure in Nigeria. African Journal of Science, Technology, Innovation and Development, 2(3), pp. 207-228.
Alimi, O.Y. & Alese, J.O. (2017). Comparative analysis of investment funding in the Nigerian oil and agricultural sector. International Journal of Economics and Accounting, 8(1), pp. 67-82.
42
Calderon, C. & Chong, A. (2004). Volume and Quality of Infrastructure and the Distribution of Income: An Empirical Investigation. Review of Income and Wealth, International Association for Research in Income and Wealth, Vol. 50(1), pp. 87-106, 03.
Calderon, C. & Serven, L. (2004). The Effects of Infrastructure Development on Growth and Income Distribution. Working Papers Central Bank of Chile. 270, Central Bank of Chile.
Central Bank of Nigeria (2016). Statistical Bulletin, volume 27.
Ebong, F. & Ogwumike, F. (2013). Economic growth and Poverty Reduction in Nigeria: An Empirical Investigation. Journal of Economics and Sustainable Development, Vol. 4, no. 7.
Estache, A.; Wodon, Q. & Lomas, K. (2014). Infrastructure and Poverty in Sub-Saharan Africa. Springer.
Fan, S. & Chan -Kang, C. (2005). Road Development, Economic Growth, and Poverty Reduction in China. International Food Policy Research Institute (IFPRI), series DSSG discussion papers, number 12.
Ijaiya, G.; Ijaiya, M.; Bello, R. & Ajayi, M. (2011). Economic Growth and Poverty Reduction in Nigeria. International Journal of Business and Social Science Vol. 2, no. 15.
Jerome, A. (2011). Infrastructure, economic growth and poverty reduction in Africa. Journal of infrastructure development, 3(2), pp. 127-151.
Jones, S. (2004). Background Paper: Contribution of Infrastructure to Growth and Poverty Reduction in East Asia and the Pacific”ADB Final Report, Oxford Policy management.
Maku, O. E. and Alimi, O. Y. (2018). Fiscal policy tools, employment generation and sustainable development in Nigeria. Acta Universitatis Danibius Economica, 14(3), pp. 186-199.
Ogun, T.P. (2010, August). Infrastructure and poverty reduction: Implications for urban development in Nigeria. In Urban Forum, Vol. 21, no. 3, pp. 249-266. Springer Netherlands.
Okoroafor, M.O. & Nwaeze, C. (2013). Poverty and economic growth in Nigeria 1990-2011. The Macrotheme Review, 2(6), pp. 105-115.
Oloyede, B. (2014). Effect of Poverty Reduction Programmes on Economic Development: Evidence from Nigeria. Arabian Journal of Business and Management Review (OMAN Chapter), Vol. no. 1.
Raihan, S. (2011). Infrastructure and Growth and Poverty in Bangladesh. Munich Personal RePEc Archive (MPRA) Paper No. 37882, posted 7. 12:12 UTC.
Runsinarith, P. (2011). Infrastructure Development and Poverty Reduction: Evidence from Cambodia’s Border Provinces. Graduate School of International Studies, Nagoya University.
Sahoo, P. & Dash, R.K. (2014). India's surge in modern services exports: Empirics for policy. Journal of Policy Modeling, 36(6), pp. 1082-1100.
Sahoo, P.; Dash, R. & Nadaraj, G. (2010). Infrastructure Development and Economic Growth in China. Institute for Developing Economies Discussion Paper, no 261.
Tella, S.A. & Alimi, O.Y. (2016). Grassroots banking, microcredit and poverty in developing countries: The case of Nigeria. In “Confronting the Scourge of Poverty through Microfinance: Issues and Challenges. Scheduled for the 17th–18th of August 2016 at LAPO Institute, Benin City, Nigeria.