1
Article history:
Received: 15 January 2020; Revised: 31 January 2020; Accepted: 15 February 2020; Available online: 24 February 2020
The Effect of Capital Adequacy Ratio, Loan to Deposit Ratio, Operating-Income Ratio, Non Performing Loans, Net Interest Margin on Banking Financial
Performance
Refni Sukmadewi1
Sekolah Tinggi Ilmu Ekonomi Persada Bunda refni.dhewi@gmail.com
Abstract
The weak condition of the banking sector encourages those involved in conducting a bank health assessment. One of the parties is the investor because the better the bank's performance, the greater the security guarantee of the invested funds. By using financial ratios, investors can find out the performance of a bank that can be seen through various variables. The variable used as the basis for valuation is the financial statements of the companies concerned. Company performance can be measured by analyzing and evaluating financial statements. Information on financial position and performance in the past is often used as a basis for predicting financial position and performance in the future. Banking performance can be measured using average loan interest rates, average deposit interest rates, and bank profitability. The profitability measure used is return on assets (ROA) in the banking industry. Return on Assets (ROA) focuses the company's ability to obtain earnings in the company's operations. The reason for choosing Return on Assets (ROA) as a measure of performance is because Return on Assets (ROA) is used to measure the effectiveness of the company in generating profits by utilizing its assets. The greater ROA shows the better financial performance, because the greater the rate of return. This study aims to examine the effect of Capital Adequacy Ratio (CAR), Loan to Deposit Ratio (LDR), Operating-Income Expense Ratio (BOPO), Non Performing Loans (NPL), Net Interest Margin (NIM), and on Return on Assets (NIM) ROA) as the Financial Performance of Banking Companies Listed on the Indonesia Stock Exchange in 2016-2018. The data used in this study were obtained from the Annual Financial Statements of Banking Companies Listed on the Stock Exchange in 2016-2018. the samples used were 23 Banking Companies Listed on the IDX. The analytical method used is multiple linear regression. The results showed that the CAR, BOPO, NPL, NIM, and LDR variables had a positive and significant effect on Return on Assets (ROA). Thus the bank is expected to pay attention to the level of efficiency of its operations to increase profitability on its financial performance.
Keywords: CAR, LDR, BOPO, NPL, NIM, Financial Performance
1Korespondensi: Refni Sukmadewi, Sekolah Tinggi Ilmu Ekonomi Persada Bunda, Jl.
Diponegoro No.42, Simpang Empat, Kec. Pekanbaru Kota, Kota Pekanbaru, Riau.
2 Introduction
Banking business plays an important role for economic development as an intermediary between parties who are overfunded with those who need funds. Bank is defined as a financial institution that has a business license to accept the placement of funds entrusted by the community to the bank, lending to the public and the business world in general, giving acceptance of various forms of debt securities submitted to the bank and issuing checks.
The monetary crisis that has occurred in Indonesia has resulted in many banks experiencing bad loans. This affects the capital market investment climate in the banking sector. The monetary crisis in Indonesia in general can be said to be the impact of the weak quality of the banking system, among others, reflected in the weak internal conditions in the banking sector, weak bank management. Short-term private foreign debt since the early 1990s has accumulated so much that most of it is not hedged. This is what then adds pressure to the rupiah exchange rate, because
there is not enough foreign exchange to pay the maturing debt along with the interest. This
banking condition encourages the parties involved in it to conduct an assessment of the health of the bank. One of the parties who need to know the performance of a bank is an investor because the better the bank's performance, the greater the security guarantee of the invested funds. By using financial ratios, investors can find out the performance of a bank.
Company performance can be seen through various variables or indicators. The variable or indicator used as the basis for valuation is the financial statements of the company concerned. Company performance can be measured by analyzing and evaluating financial statements. Information on financial position and performance in the past is often used as a basis for predicting financial position and performance in the future.
Banking performance can be measured using average loan interest rates, average deposit interest rates, and bank profitability. The profitability measure used is return on assets (ROA) in the banking industry. Return on Assets (ROA) focuses the company's ability to obtain earnings in the company's operations.
The reason for choosing Return on Assets (ROA) as a measure of performance is because ROA is used to measure the effectiveness of the company in generating profits by utilizing its assets. The greater ROA shows the better financial performance, because the greater the rate of return.
Several factors that influence bank performance are CAR, BOPO, NPL, NIM, and LDR. Capital Adequacy Ratio (CAR) is a financial ratio related to bank capital where the amount of capital of a bank will affect whether or not a bank can efficiently carry out its activities. If the capital owned by the bank is able to absorb losses that cannot be avoided, then the bank can manage all its activities efficiently, so that the bank's wealth is expected to increase. According to Bank Indonesia regulations, BOPO is a comparison between total operating costs and total operating income. Efficiency of operations carried out by banks in order to find out whether banks in their operations related to the main business of the bank, carried out correctly and is used to indicate whether the bank has used all of its production factors appropriately and effectively.
Banks in carrying out their operations are certainly not free from various risks. Bank business risk is the level of uncertainty about a result that is expected or expected to be. Non Performing Loans (NPLs) are financial ratios related to credit risk. Credit risk is the risk of the possibility of bank losses as a result of not repaying loans given by banks to debtors. Banks are said to have high NPLs if the number of problem loans is greater than the amount of credit given to debtors. If a bank has a high NPL, it will increase costs, both the cost of providing productive assets and other costs, in other words the higher the NPL of a bank, then it will interfere with the
3
performance of the bank. Then Net Interest Margin (NIM) reflects the market risk arising from the movement of market variables, which can be detrimental to the bank. Based on Bank Indonesia regulations, one of the proxy of market risk is the interest rate, measured from the difference between funding interest rates (funding) and lending rates or in absolute form is the difference between the total cost of funding interest with the total cost of loan interest where in banking terms it is called Net Interest Margin (NIM) (Mawardi, 2005). While the Loan to Deposit Ratio (LDR) is a ratio that measures the ability of banks to meet obligations that must be met. So that the higher the LDR, the more bank profit, with the increase in bank profit, the bank's performance also increases.
Literature review
In this study, the bank's health ratio researchers as part of the object to be studied, to measure the financial performance of the banking sector. According to Zimmerman (2000); capital is one of the variables that can be used as a basis for measuring bank performance, which is reflected in the CAMEL rating component (Capital, Asset, Management, Earning, Liquidity). Therefore, the amount of capital of a bank will affect the amount of productive assets, so that the higher the asset utilization (Koch, 2000), the capital must increase. So it can be concluded that the greater the Capital Adequacy Ratio, the Return on Assets will also be even greater, in this case the bank's financial performance is increasing or improving.
The availability of funds and sources of bank funds now and in the future is an understanding of the concept of liquidity in this indicator. According to Ali, (2006), liquidity arrangements are primarily intended so that banks can at all times fulfill their obligations that must be paid immediately. Liquidity is assessed keeping in mind that most bank assets are not liquid with shorter-term funding sources. Bank Indonesia regulations state that a bank's liquidity capability can be proxied by a Loan to Deposit Ratio, which is a comparison between loans and Third Party Funds. This ratio is used to assess the liquidity of a bank by dividing the amount of credit provided by banks against third party funds.
Operating efficiency also affects bank performance, which is to show whether the bank has used all production factors appropriately (Mawardi, 2005). Operating efficiency is measured by comparing the total operating costs with the total operating income or often called BOPO. This BOPO ratio aims to measure the ability of operating income to cover operating costs. The increasing ratio reflects the lack of ability of banks to reduce operational costs and increase operating income which can cause losses because banks are less efficient in managing their business.
Non Performing Loans reflect the amount of credit risk faced by banks, the smaller the NPL, the smaller the credit risk borne by the bank. Banks in providing credit must analyze the ability of debtors to repay their obligations. After credit is granted, banks are required to monitor the use of credit and the ability and compliance of debtors in meeting obligations. The bank conducts a review, assessment, and binding of collateral to minimize credit risk (Ali, 2004).
Market risk according to Bank Indonesia Regulation No.5 of 2003 is a risk arising from the movement of market variables from portfolios owned by banks, which can cause losses, in this case the movement of interest rates and exchange rates. In general, bank performance is measured using the variable market share growth, profitability variable and variable rate on return (Tainio, 2000). Bank performance decreases or increases is determined by a combination of environmental factors, strategies and structures.
Based on the provisions in BI Regulation No. 5/2003, one proxy of market risk is interest rates, thus the market ratio can be measured by the difference between the funding interest rate and the loan interest rate given or in absolute form, which is the difference between the total
4
interest costs funding with the total cost of loan interest. In the banking world it is called Net Interest Margin. This ratio is used to measure the ability of bank management to manage productive assets to generate net interest income. Net interest income is derived from interest income less interest expense. This ratio shows the ability of banks to obtain operating income from funds placed in loans. The higher the NIM shows the more effective the bank is in placing productive assets in the form of credit.
Return On Assetbank is also used to determine the relationship between the organization and the financial performance of retail banks, so that organizational strategies in the context of facing increasingly fierce competition can be formulated (Adeyemi-Belo, 2000). According to Bank Indonesia Return On Assets (ROA) is a comparison between profit before tax with the average total assets in one period (SE. Internal BI, 2004).
Research methods
The method used in this study is a descriptive method that aims to provide a systematic and accurate picture of the facts found in banking sector companies using secondary data from annual reports on the Indonesia Stock Exchange. Descriptive analysis is performed to obtain clarity regarding the variables to be studied.
The sampling technique in this study uses a purposive sampling technique which is the selection of sampling based on certain criteria. Based on the sampling criteria as mentioned above, the number of samples used in this study was 23 banks.
Data collection technique
The data source used in this study is secondary data. Secondary data is a data source that does not directly provide data to data collectors, for example through other people or through documents. Secondary data in this study in the form of financial statements published by the company. The technique of data collection is done by the documentation method where the data is collected from companies listed on the Indonesia Stock Exchange with data for the period of 2016 - 2018 which can be viewed through the official website of the Indonesia Stock Exchange
Results
Normality test
Normality test results are shown by the results of the calculation of the level of significance. The results are seen in the following table:
5
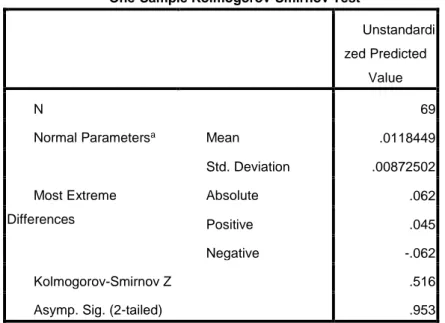
Table 1. One-Sample Kolmogorov-Smirnov Test
One-Sample Kolmogorov-Smirnov Test
Unstandardi zed Predicted
Value
N 69
Normal Parametersa Mean .0118449
Std. Deviation .00872502 Most Extreme Differences Absolute .062 Positive .045 Negative -.062 Kolmogorov-Smirnov Z .516
Asymp. Sig. (2-tailed) .953
From the table above shows the Asim value. Sig (2-tailed) 0.953> 0.05 significant level. Means the capital adequacy ratio, Loan to Deposits Ratio, Operational Expenditure Ratio - Operating Income, Non Performing Loans, Net Interest Margins are normally distributed.
Table 2. Multicollinearity Coefficientsa Model Collinearity Statistics Toleran ce VIF 1 CAR .895 1.118 BOPO .776 1.288 NPL .733 1.364 NIM .956 1.046 LDR .950 1.052
a. Dependent Variable: ROA
A regression model declared free from multicollinearity is if it has a Tolerance value below 1 and a VIF value below 10. From the table it is obtained that all independent variables have a Tolerance value below 1 and the VIF value is far below the number 10. Thus in this model there is no multicollinearity problems.
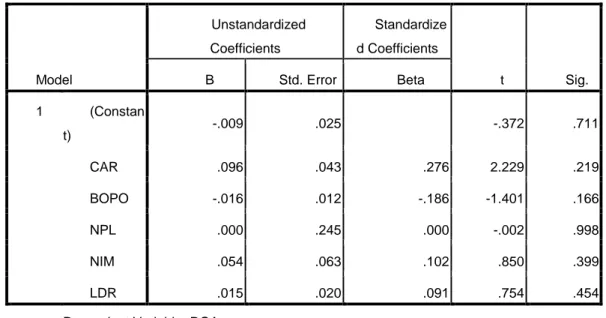
6 Table 3. Heteroscedasticity Coefficientsa Model Unstandardized Coefficients Standardize d Coefficients t Sig. B Std. Error Beta 1 (Constan t) -.009 .025 -.372 .711 CAR .096 .043 .276 2.229 .219 BOPO -.016 .012 -.186 -1.401 .166 NPL .000 .245 .000 -.002 .998 NIM .054 .063 .102 .850 .399 LDR .015 .020 .091 .754 .454
a. Dependent Variable: ROA
Based on the results shown in the table below, it appears that all independent variables show significant results, so it can be concluded that all the independent variables do not occur heteroscedasticity in the error variant.
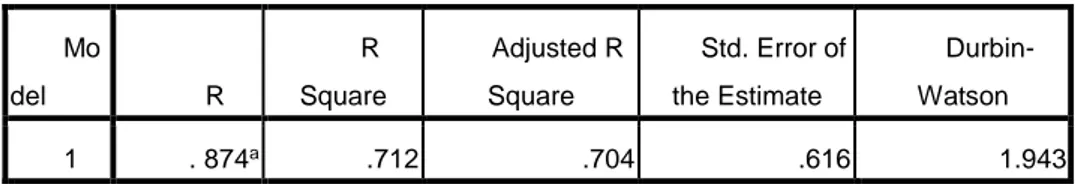
Table 4. Autocorrelation Model Summaryb Mo del R R Square Adjusted R Square Std. Error of the Estimate Durbin-Watson 1 .874a .712 .704 . 616 1.943
a. Predictors: (Constant), LDR, NIM, CAR, BOPO, NPL b. Dependent Variable: ROA
In the regression test above, the resulting Durbin-Watson is 1,943 so concluded no autocorrelation.
7
Table 5. Multiple Linear Regression
By looking at the table above, we can arrange the multiple linear regression equation as follows:
ROA= 3,245+ 0,096 CAR-0,016 BOPO-0,028 NPL+0,054 NIM+0,015 LDR
From the multiple linear regression equation above, a constant of 3.245. This shows that if the independent variables are assumed to be in a fixed state, then the dependent variable (ROA) will increase by 3.245%. Then for the direction of the sign and its significance, the CAR, NIM, and LDR variables have a positive and significant direction towards ROA, while the BOPO variable has a negative direction towards ROA. Specifically for the NPL variable, the direction of the sign shows negative, and is significant towards the ROA variable. Thus the results of the analysis of the influence of the independent variables on the dependent variable that have been done are in accordance with the proposed framework, both the direction of the sign and its significance.
Hypothesis Testing T Test
From the results of the regression analysis in the table above it appears that most of the independent variables significantly influence the dependent variable, namely ROA.
Hypothesis testing 1
The first hypothesis states that the Capital Adequacy Ratio (CAR) has a positive effect on Return on Assets (ROA). From the research results obtained a significance value of 0.029, while the regression coefficient of 0.096. This shows that the CAR has a positive influence on ROA as well as significant, because the significance value is smaller than 0.05, which is 0.029. For a regression coefficient of 0.096, it means that every 1% increase in CAR will increase ROA by 0.096%. Thus the first hypothesis which states that the Capital Adequacy Ratio has a positive effect on Return on Assets is accepted.
Hypothesis testing 2
The second hypothesis states that operating efficiency (BOPO) has a negative effect on Return on Assets (ROA). From the research results obtained a significance value of 0.006 while the regression coefficient of -0.016. This shows that BOPO has a negative influence on ROA and
Coefficientsa Model Unstandardized Coefficients Standardize d Coefficients t Sig. B Std. Error Beta 1 (Constan t) 3.245 .025 .372 .041 CAR .096 .043 .276 2.229 .029 BOPO -.016 .012 -.186 -1.401 .006 NPL -.028 .245 .000 -.002 .018 NIM .054 .063 .102 .850 .039 LDR .085 .020 .091 .754 .025
8
is significant, because the significance value is smaller than 0.05 which is 0.006. For a regression coefficient of -0.016 means that each increase in BOPO of 1% will reduce ROA by 0.16%. Thus the second hypothesis which states that operating efficiency has a negative effect on Return on Assets is accepted.
Hypothesis testing 3
The third hypothesis states that non-performing loans (NPLs) have a negative effect on Return on Assets (ROA). From the research results obtained a significance value of 0.018, while the regression coefficient of -0.028. Judging from the level of significance, shows that the results are significant. So it can be concluded that non-performing loans (NPLs) have no effect on Return on Assets (ROA). Thus the third hypothesis which states that non-performing loans (NPLs) have a negative effect on Return on Assets (ROA) can be accepted.
Hypothesis testing 4
The fourth hypothesis states that net interest margin (NIM) has a positive effect on return on assets (ROA). From the research results obtained a significance value of 0.039, while the regression coefficient of 0.054. This shows that NIM has a positive influence on ROA and is significant, because the significance value is smaller than 0.05 which is equal to 0.039. For a regression coefficient of 0.054 it means that every 1% NIM will increase ROA by 0.054%. Thus the fourth hypothesis which states that net interest margin has a positive effect on Return on Assets is accepted.
Hypothesis testing 5
The fifth hypothesis states that the loan to deposit ratio (LDR) has a positive effect on return on assets (ROA). From the research results obtained a significance value of 0.025, while the regression coefficient of 0.085. This shows that the LDR has a positive influence on ROA and is significant, because the significance value is smaller than 0.05 which is equal to 0.025. For a regression coefficient of 0.085 means that every 1% increase in LDR will increase ROA by 0.085%. Thus the fifth hypothesis which states that the loan to deposit ratio has a positive effect on return on assets is accepted.
Coefficient of Determination
The calculation results of the determination coefficient of this study can be seen in the following table:
Table 6. Summary Model
Model Summaryb Mo del R R Square Adjusted R Square Std. Error of the Estimate Durbin-Watson 1 . 874a .712 .704 .616 1.943
a. Predictors: (Constant), LDR, NIM, CAR, BOPO, NPL b. Dependent Variable: ROA
Based on the SPSS output it appears that from the calculation results obtained a coefficient of determination (R) of 0.712. In other words this shows that the percentage of ROA variation that can be explained by variations of the five independent variables, namely CAR, BOPO, NPL, NIM, and LDR, is only 71.2%, while the remaining 28.8% is explained by causes other causes outside the model.
9 F test
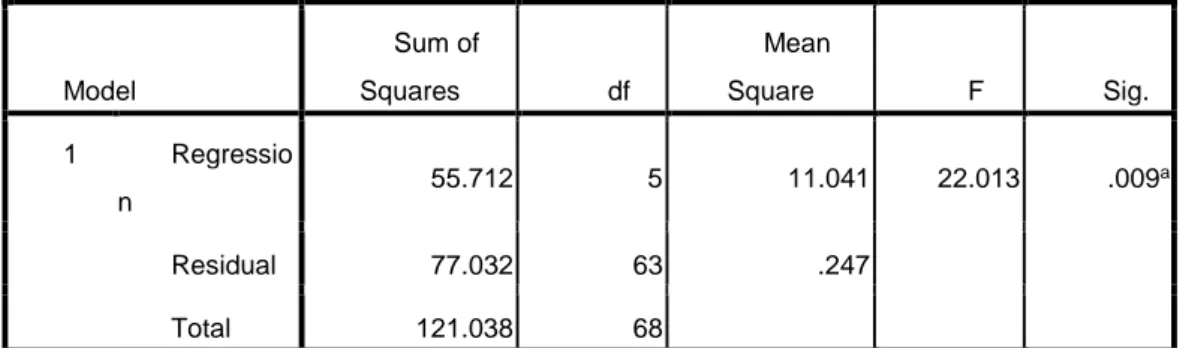
The results of the F Test calculation can be seen in the following table: Table 7. Anova ANOVAb Model Sum of Squares df Mean Square F Sig. 1 Regressio n 55.712 5 11.041 22.013 .009 a Residual 77.032 63 .247 Total 121.038 68
a. Predictors: (Constant), LDR, NIM, CAR, BOPO, NPL b. Dependent Variable: ROA
From the results of the regression analysis it can also be seen that together the independent variables have a significant effect on the dependent variable. This can be proven from the calculated F value of 22.013 with a probability of 0.009. Because the probability is much smaller than 0.05 or 5%, the regression model can be used to predict ROA or it can be said that CAR, BOPO, NPL, NIM, and LDR together influence ROA.
Discussion
Based on the results of the study it can be seen that simultaneously there is a significant influence of the Capital Adequacy Ratio, Loan to Deposit Ratio, Operating Costs / Operating Income, Non Performing Loans, Net Interest Margin on changes in banking financial performance, this can be seen the value of F-calculated has a significance value of less than 0.05. From this study it is also known that partially there is a significant influence of the Capital Adequacy Ratio, Loan to Deposit Ratio, Operating Costs / Operating Income, Non Performing Loans, Net Interest Margin on changes in changes in banking financial performance, this can be known T-value which has a significance value less than 0.05.
Capital Adequacy Ratio has a significant effect on Return on Assets. This shows that the role of bank capital adequacy in running its main business is an absolute thing that must be fulfilled. With the fulfillment of CAR by the bank, the bank can absorb the losses experienced, so that the activities carried out will run efficiently.
Operating Costs / Operating Revenues have a significant effect on Return on Assets. The higher the ratio of Operating Costs / Operating Revenues it can be said that the operational activities carried out by the bank are inefficient. And conversely the lower the ratio of Operating Costs / Operating Revenues the bank's operational activities will be more efficient.
Non Performing Loans in this study affect the Return on Assets. So whatever the value of the
Non Performing Loan ratio does not affect the size of the ratio of Return on Assets. So it can be concluded that the role of banks in carrying out their functions as intermediaries is not going well.
Net Interest Margin has a significant positive effect on Return on Assets. This means that the ability of banks to earn profits from interest affects the good or bad bank financial performance. If the acquisition of the bank's Net Interest Margin ratio increases, the bank's financial performance will also increase.
10
Loan to Deposit Ratio has a significant positive effect on Return on Assets. Thus the level of liquidity of a bank affects the financial performance of banks. The more optimal the level of bank liquidity, the more third party funds channeled in the form of credit.
Conclusion
1. Capital Adequacy Ratio, Loan to Deposits Ratio, Operational Expenditure Ratio, Operating Income, Non Performing Loans, Net Interest Margin partially and simultaneously affect the financial performance of banks.
2. From the multiple linear regression equation, it is known to have a constant of 3.245. This shows that if the independent variables are assumed to be in a fixed state, then the dependent variable (ROA) will increase by 3.245%. Then for the direction of the sign and its significance, the CAR, NIM, and LDR variables have a positive and significant direction towards ROA, while the BOPO and NPL variables have a negative direction towards ROA.
Reference list
Ali, Masyhud, 2004, Asset Liability Management : Menyiasati Risiko Pasar dan Risiko Operasional, PT.Gramedia Jakarta.
Adeyemi-Bello, Tope, ”The Performance Implications for retail banks of matching Organization Strategies with Structure and Competition”, International Journal of Management, 2000, vol.17, pp.443.
Koch, Timothy W. & S. Scott MacDonald, 2000, Bank Management, 4th Edition. New York: Harcout College Publishers.
Mawardi, Wisnu, 2005, ”Analisis Faktor Faktor yang Mempengaruhi Kinerja Keuangan Bank Umum di Indonesia (Studi Kasus pada Bank Umum dengan Total Asset Kurang dari 1 Triliun)”, Jurnal Bisnis Strategi, Vol.14, No.1, Juli, pp.83-94.
Selamet Riyadi. 2013. Banking Asset dan Liability Management. Edisi Ketiga. Lembaga
Penerbit FEUI. Jakarta
Sugiyono. 2016. Metode Penelitian Manajemen. Alfabeta. Bandung
Surat Edaran Bank Indonesia No 3/30 DPNP tgl 14 Desember 2001, Perihal Laporan Keuangan Publikasi Bank Umum kepada Bank Indonesia, Bank Indonesia,Jakarta.
Surat Edaran Bank Indonesia No 6/73/Intern DPNP tgl 24 Desember 2004, Perihal Pedoman Sistem Penilaian Tingkat Kesehatan Bank Umum (CAMELS Rating), Bank Indonesia, Jakarta
Tainio, Risto, Pekka J. Korhonen, Timo J. Santalainen, 2000, In Search of Explanation for Bank Performance – Some Finnish Data, Organization Studies, 12/3. p : 425-450.
Zimmerman, Gary C. 2000. Factor Influencing Community Bank Performance in California, FBRSF Economic Review, Number 1, pp.26- 42.