How can we reduce carbon
emissions from transport?
Abigail Bristow, Alison Pridmore, Miles Tight, Tony May,
Frans Berkhout and Michelle Harris
June 2004
How Can We Reduce Carbon
Emissions From Transport?
Tyndall Centre Technical Report No. 15
June 2004
This is the final report from Tyndall research project IT1.7 (How can we reduce carbon emissions from transport?). The following researchers worked on this project:
Abigail Bristow, Alison Pridmore, Miles Tight and Tony May, ITS, University of Leeds Frans Berkhout and Michelle Harris, SPRU, University of Sussex
1. INTRODUCTION... 3
2. DERIVATION OF TARGETS ... 5
3. DEVELOPING STRATEGIES TO MEET THE TARGETS FOR LAND BASED
PASSENGER TRANSPORT ... 14
4. EXPERT CONSULTATION ... 25
5. HOUSEHOLD RESPONSE ... 35
6. CONCLUSIONS... 43
1. INTRODUCTION 1.1 Context
Climate change is an internationally recognised problem. Carbon dioxide is the most important greenhouse gas and is projected to account for around 70% of radiative forcing of climate by the end of the century (IPCC, 2001a). The United Nations Framework Convention on Climate Change (UN FCCC) was agreed in 1992 and at Kyoto in 1997 developed countries agreed to targets which will reduce their overall emissions of six greenhouse gasesa to 5.2% below 1990 levels over the period 2008-2012. The UK Kyoto commitment is a 12.5% reduction. The UK also has a domestic target of a 20% reduction in carbon dioxide emissions below 1990 levels by 2010 (DETR, 2000a). The 2003 Energy White Paper (DTI, 2003a) accepts the need for deeper cuts of 60% by 2050.
Transport has potentially an important role to play in achieving reduction targets. In the transport sector CO2 accounts for 96% of greenhouse gas (GHG) emissions. The transport sector is the third
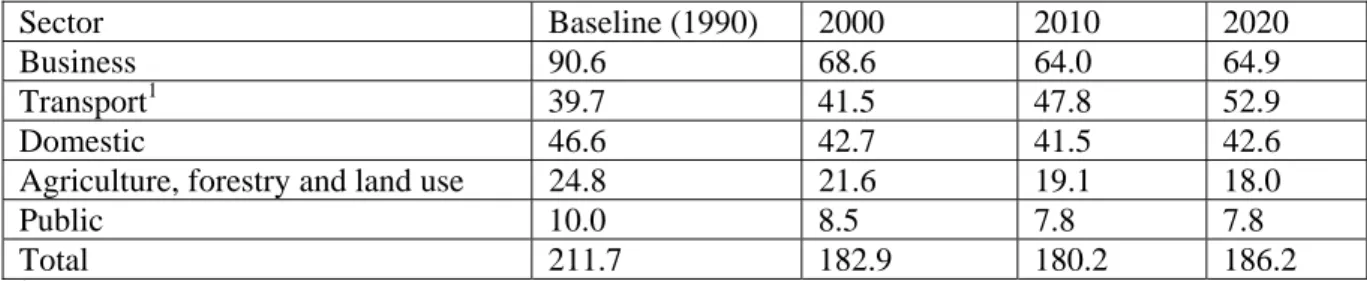
largest source of carbon dioxide emissions in the UK and as Table 1 shows the only sector where emissions are expected to be higher in 2020 than in 1990.
Table 1.1: Greenhouse Gas Emissions by End User (MtC)
Sector Baseline (1990) 2000 2010 2020 Business 90.6 68.6 64.0 64.9
Transport1 39.7 41.5 47.8 52.9
Domestic 46.6 42.7 41.5 42.6
Agriculture, forestry and land use 24.8 21.6 19.1 18.0 Public 10.0 8.5 7.8 7.8
Total 211.7 182.9 180.2 186.2
1
Including emissions from domestic air travel
The impacts of international aviation emissions are not considered here for two main reasons: (i) the studies reviewed which explore scenarios for future emissions do not consider international aircraft emissions as they are beyond the scope of current climate change agreements; and (ii) many aspects of air transport are subject to international treaties and agreements, and for this sector it is likely that the path to a solution will be through international negotiation rather than action at national, regional and local levels as may be the case for other transport modes. Current emissions attributed to UK international flights are around 8MtC, as opposed to 1MtC for domestic flights (DTI, 2003a), while CO2 emissions attributed to international aviation have increased by 87% between 1990 and 2001
(Baggott et al 2003). Further rapid increases are forecast, to between 18 and 20MtC by 2030 (DfT 2002), posing a serious challenge for a low carbon transport strategy.
Work for the European Commission (Blok et al, 2001) suggests that the role of the transport sector in meeting the Kyoto targets for the European Union will be limited as reductions in other sectors are more cost effective. Thus if a least cost reduction strategy were pursued, emissions from the transport sector would rise in absolute terms, achieving only a 4% reduction from the 2010 baseline forecast through efficiency improvements. Transport would then be the second largest sectoral emitter in the EU after energy. In considering deeper cuts to 2050, transport would have to play a role.
Current UK transport policy aims to reduce emissions of GHG’s from transport by 5.6 MtC below trend by 2010. This would leave emissions from the sector slightly above 2000 levels. This reduction is dependent on two key policies: the voluntary agreement between the European Commission and European car manufacturers to reduce average carbon dioxide emissions from new cars to 25% below
a
The six greenhouse gases are carbon dioxide, methane, nitrous oxide, hydroflurocarbons, perflurocarbons, and sulphur hexafluoride
1995 levels by 2005 (ACEA/EC, 1998), and the Government’s 10 Year Plan for transport (DETR, 2000b). In the longer run demand for motorised modes of transport is expected to increase and in the absence of further efficiency gains or developments in low carbon technologies for transport, emissions would then be expected to rise. The key questions for this paper, are by how much are emissions likely to rise by 2050 and how will transport perform relative to other sectors in a carbon constrained (or unconstrained) world. Transport’s share of CO2 emissions has been increasing to its
current level of 26%, how much further will this figure rise?
1.2 Project Objectives and Overview
This is the final technical report of the project “Behavioural Response and Life Style Change in Moving to Low Carbon Transport Futures” funded by the Tyndall Centre for Climate Change Research. The project objectives are stated below:
1. To determine targets for CO2 reduction in the UK transport sector and within this specifically
for personal land based transport
2. To develop transport/land use strategies designed to deliver a range of carbon reduction targets.
3. To develop a survey instrument to explore the adaptation strategies of households in response to the measures identified in (1) in order to meet short run and long run targets for carbon reduction.
4. To implement the survey methodology on an experimental basis
5. To analyse household preferences for adaptive strategies and how this response is influenced by specific policies, in order to identify those policies that would be most likely to move society towards a low carbon transport future, at the least perceived cost to households and that are most acceptable.
The first objective was not specified in the proposal but is implied. The project focuses on personal land based transport as this area is the largest contributor to CO2 emissions within the UK transport
sector and trends towards increased use of personal motorised transport show little signs of abatement. Moreover this is an area where the issue of behavioural change is perceived to be particularly intractable.
This report is structured to address the objectives consecutively, as was the project. Chapter 2 reviews the literature on appropriate target reductions in CO2 emissions to secure stabilisation at sustainable
levels and then examines various scenario building exercises in the UK in order to determine a likely role for transport in contributing to a reduction target. Chapter 2 addresses objective 1 and provides the targets that form the basis for the rest of the project. In Chapter 3 we develop strategies that could enable the personal land based transport sector to meet these targets. The strategies and the behavioural response to them are based on our best knowledge from the literature on response to policy measures and on consultation with experts. Chapter 3 addresses objective 2 above and enables us to move on to explore the feasibility and acceptability of such strategies with households, as reported in Chapter 5. Chapter 4 explores the same strategies and targets but with an expert audience through a Delphi survey. Chapter 5 reports the development of a computer based survey method designed to explore households ability to reduce carbon emissions through changes in travel behaviour. The results of the experimental implementation of this survey are reported. Chapter 5 addresses objectives 3, 4 and 5. Chapter 6 brings together the results from the various phases of the projects in order to draw policy conclusions and identify areas for further research.
2. DERIVATION OF TARGETSb
The aim of this first phase of the project was to establish appropriate CO2 emissions targets for the UK
transport sector by 2050. This was determined by looking firstly at the degree of consensus on appropriate stabilisation levels for atmospheric GHGs by 2050 and secondly by examining studies that have put forward scenarios for CO2 emissions in the UK for 2050 for carbon constrained and
non-carbon constrained futures. The level of transport emissions within these scenarios and the ways in which reductions in transport emissions are achieved are used to guide the construction of future targets for the transport sector.
2.1 Targets
The UN FCCC has stabilisation of atmospheric GHG levels as its ultimate objective, but does not define a stabilisation concentration, and neither does the Intergovernmental Panel on Climate Change (IPCC). The political, economic, ethical, social and scientific issues that need consideration make defining a stabilisation target difficult. However, examination of the literature shows key themes and preferences for certain target levels and these are outlined below. The emphasis is on the targets of 350, 450 and 550 ppm.
An upper limit of 550 ppm carbon dioxide has been advocated by both the European Commission (EC, 1996) and the Royal Commission on Environmental Pollution (RCEP, 2000). This recommendation refers solely to carbon dioxide though it is acknowledged that other greenhouse gases are also important contributors. Since industrialisation the increase in the concentration of other greenhouse gases has contributed the equivalent of 50 ppm carbon dioxide (RCEP, 2000).
The IPCC (2001a) state that stabilisation of carbon dioxide equivalence (including other GHGs) at 550 ppm would result in a temperature change greater than 2.00C. The WMO/ICSU/UNEP Advisory Group on Greenhouse Gases (Rijsberman and Swart, 1990) state that a 2.00C increase in temperature is a high risk situation and that “temperature increases beyond 1.00C may elicit rapid, unpredictable, and non-linear responses that could lead to extensive ecosystem damage”. Arnell et al (2002) compare the impacts of stabilisation at 750 ppm and 550 ppm with unmitigated increases in CO2 and conclude
that stabilisation at even the lower level, while reducing future water stress, is still likely to lead to increases in populations at risk from hunger and malaria.
The Global Commons Institute (GCI) (2002) view is that given the state of uncertainty as to the appropriate target level it would be unwise to set the level too high as this would ‘lockout’ lower target levels. They suggest that if a target of 550 ppm were set, but later evidence pointed to a much lower target of 350 ppm, this would not be achievable after 2005. However, if the initial target was 450 ppm, then this could if necessary be switched to 350 ppm up to 2015. The GCI (2002) believe that 350 ppm is a desirable target and if this were implemented then there is a good chance that “large-scale damage to the world economy, human lives and natural ecosystems can be averted”. It regards 450 ppm “as an upper limit for consideration, under which there is a chance that damage, though serious, will be containable”.
Others arguing in favour of lower limits include Azar and Rodhe (1997) who suggest that stabilisation of carbon dioxide should be achieved in the 350 ppm to 450 ppm range. They recognise that policies are also needed to constrain emissions of other greenhouse gases. Alcamo and Kreileman (1996) state that “stabilising carbon dioxide alone in the atmosphere below 450 ppm substantially reduces climate impacts”, and that controlling non-CO2 emissions (i.e. other GHGs) in addition to CO2 emissions is an
effective policy to slow temperature increase.
b
Houghton (1997) initially examines carbon dioxide stabilisation alone and highlights the economic considerations, recognising that stabilisation below 400 ppm would require an immediate drastic reduction in emissions, and this would come at a high economic cost, which is considered to breach the UN FCCC (United Nations, 1992) requirement for “economic development to proceed in a sustainable manner”. Stabilisation in the range from 400 ppm to 550 ppm is recommended.
To summarise, the most common stabilisation target is 550 ppm carbon dioxide. It is generally recognised that additional measures will be needed to reduce other non-CO2 greenhouse gases. If
non-CO2 greenhouse gases are also included then the ‘safe’ target for carbon dioxide alone would have to
be lower than 550 ppm. It was therefore decided to use both the 550 ppm and the 450 ppm stabilisation levels in developing the targets used here for the transport sector.
However it is not just the stabilisation target that is the subject of much debate. Other important connected issues include the expected role of different countries and the timescales the reductions should operate on.
2.2 The Contraction and Convergence Approach
The Contraction and Convergence approach aims to reduce greenhouse gas emissions to an acceptable level. It is a two stage process: firstly convergence would occur, that is the emissions levels of the developing nations would rise, and emissions levels of developed countries would fall until an agreed point for convergence was reached. At this point all countries would have the same per capita emissions. Secondly all countries would reduce their emissions levels (contraction) to an appropriate sustainable level. International negotiations would determine the upper limit of the concentration of greenhouse gases, and the date when convergence would occur. A significant party in the promotion of this approach is the GCI (2002).
The RCEP used the contraction and convergence approach to estimate the level of reductions that would be required in the UK by 2050 and 2100 for different upper limits of carbon dioxide concentration. The reductions required for stabilisation at different levels are shown in Table 2.1.
Table 2.1: Contraction and Convergence: implications for UK carbon dioxide emissions
Maximum atmospheric concentration ppm Permissible UK emissions in 2050 (% of 1997 level) Permissible UK emissions in 2100 (% of 1997 level) 450 21 11 550 42 23 750 56 47 1000 58 61 Source: RCEP, 2000
This shows that in order to stabilise CO2 at 550 ppm, emissions would have to be reduced by almost
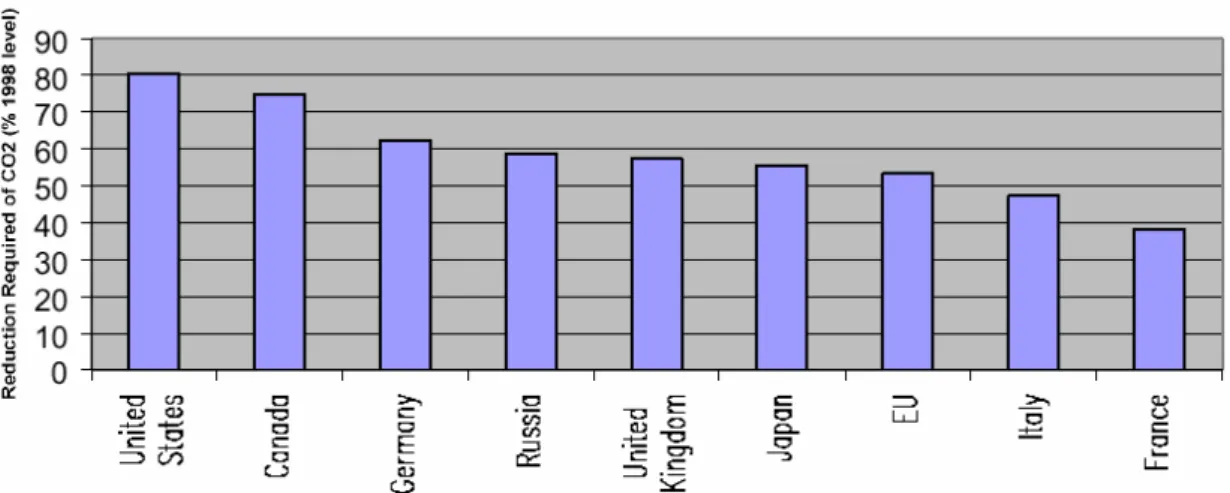
60% from 1997 levels by 2050 and by almost 80% from 1997 levels by 2100. The RCEP therefore recommended that “the Government should now adopt a strategy which puts the UK on a path to reducing carbon dioxide emissions by some 60% from current levels by about 2050” (RCEP, 2000). The Inter-departmental Analysts Group (IAG) (2002) has used the contraction and convergence approach to explore the role of other countries. This is shown in Figure 2.1. A key point is the 80% reduction that would be expected from the USA given the high current levels of emissions from that country.
Figure 2.1: CO2 reductions required by 2050 to achieve stabilisation at 550 ppm (Source: IAG,
2002)
The RCEP (2000) recognises that some developed nations may be wary of this approach because it involves very large reductions in their emissions, and suggests the introduction of greater flexibility to allow countries to trade their emissions quotas. However any form of trading needs to be ‘transparent, monitored and regulated’ and backed by enforceable penalties if nations emit more than their entitlement.
The likelihood of other countries adhering to the contraction and convergence approach will be an important consideration for the UK Government in deciding whether or not to follow such an approach. The Energy White Paper (DTI, 2003a) indicates that the UK government has now adopted the 60% target as an aim. However, the PIU (2002) states that greenhouse gases are global pollutants and that the UK should not incur abatement costs, and risk harming competitiveness, unless other countries are also willing to do so.
In this paper the RCEP targets of roughly 60% and 80% reductions for the targets of 450 and 550 ppm in 2050 shown in Table 2.1 have been used. There are several reasons for this. Firstly the stabilisation targets of 450 ppm and 550 ppm are those with greatest support in the literature. Secondly contraction and convergence has substantial political and scientific backing. Thirdly, since this work focuses on the UK, there is a need for UK based targets. Fourthly the RCEP is a long established, influential body, and these target figures are already being used in policy work for the UK. Hence the use of these figures will ensure consistency and enable comparison. In addition, even if the contraction and convergence approach is not followed, the emissions reductions required for the UK are likely to be substantial.
2.3 Scenarios
Five recent studies are reviewed here, each of which has utilised the RCEP recommendation of a 60% reduction target. Each provides some indication of the role that transport is expected to play. The studies acknowledge the difficulty both in predicting future change in the transport sector and in developing effective measures which will help sufficiently with current emissions trends. Naturally, given the need to forecast to 2050, the studies make a number of heroic assumptions about future conditions. It is important to note that the emissions examined in these studies are those covered by international agreements and hence exclude the majority of emissions from the air transport sector. The five studies are:
• The Carbon Trust (2001): Draft Strategic Frameworkc.
• The Policy and Innovation Unit (PIU) (2002): The Energy Review.
• The Interdepartmental Analysts Group (IAG) (2002): Long Term Reductions in Greenhouse Gas Emissions in the UK.
• AEA Technology (2002): Future Energy Solutions from AEA Technology in collaboration with the Imperial College Centre for Energy Policy and Technology (ICCEPT): Options for a Low Carbon Futured.
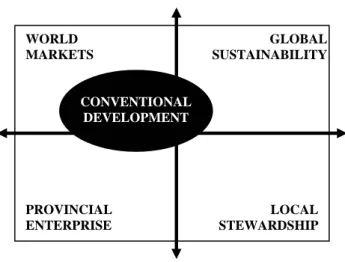
All of the studies recognise the need for substantial change in order to achieve a 60% reduction in carbon dioxide emissions by 2050. The Carbon Trust (2001), the RCEP (2000), and the IAG (2002) all develop scenarios to show how a 2050 world may look. The PIU (2002) use the Foresight (1999a) scenarios as the base for their work. The IAG and the AEA Technology/ICCEPT collaboration also consider the Foresight work. The Foresight scenarios were developed in 1999 by the DTI in cooperation with SPRU (Foresight, 1999a). There are four scenarios: World Markets; Provincial Enterprise; Global Sustainability; and Local Stewardship. The scenarios are set within the context of two dimensions of change: social values and governance systems, with social values forming the X axis and governance systems forming the Y axis (see Figure 2.2). There is no business as usual scenario but the World Markets scenario could be considered to most closely resemble conventional development.
Figure 2.2: Four Contextual UK Futures scenarios (Source: Foresight, 1999a)
Foresight (1999a) provides a synopsis of the key themes of the four scenarios:
• World Markets is “a world defined by emphasis on private consumption and a highly developed and integrated world trading system”.
• Global Sustainability is “a world in which social and ecological values are more pronounced and in which the greater effectiveness of global institutions is manifested through stronger collective action in dealing with environmental problems”.
• Provincial Enterprise is “a world of private consumption values coupled with a capacity for lower level policy-making systems to assert local, regional and national concerns and priorities”.
c
The Draft Strategic Framework is used rather than the Strategic Framework since information about the scenarios and baseline projections is provided in greater detail
d
The AEA Technology/ ICCEPT work examines three emissions targets: a 45%, a 60% and a 70% reduction from 2000 levels. CONVENTIONAL DEVELOPMENT WORLD MARKETS PROVINCIAL ENTERPRISE GLOBAL SUSTAINABILITY LOCAL STEWARDSHIP REGIONALISATION CONSUMERISM COMMUNITY GLOBALISATION
• Local Stewardship is “a world where stronger local and regional governments allow social and ecological values to be demonstrated to a greater degree at local level”.
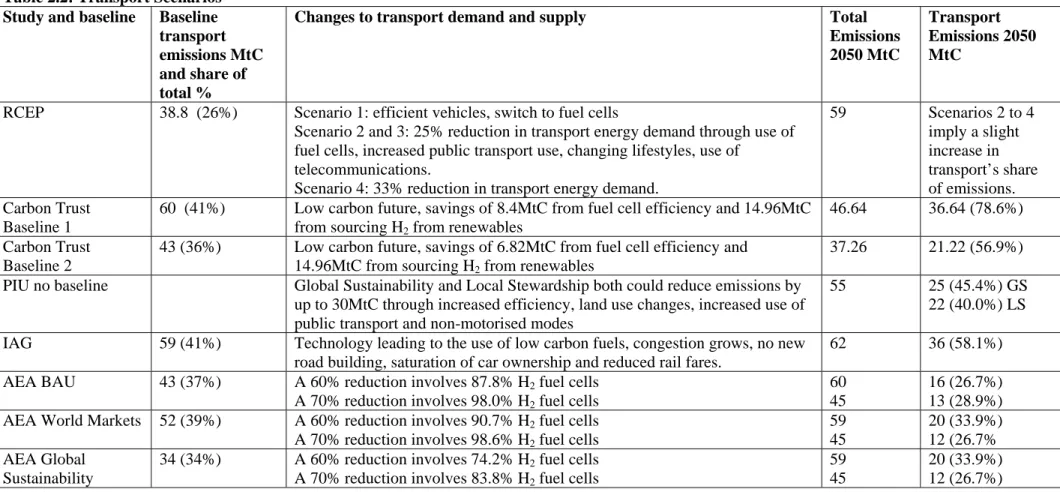
Table 2.2 summarises the varied roles transport is expected to play by the five different studies to achieve a 60% reduction. Table 2.2 includes only those scenarios that yield a reduction in CO2
emissions of 60% or more. It is noticeable that there are differences in both the magnitude of the expected role and the combination of the different measures used to achieve the reduction.
Table 2.2: Transport Scenarios Study and baseline Baseline
transport emissions MtC and share of total %
Changes to transport demand and supply Total
Emissions 2050 MtC
Transport Emissions 2050 MtC
RCEP 38.8 (26%) Scenario 1: efficient vehicles, switch to fuel cells
Scenario 2 and 3: 25% reduction in transport energy demand through use of fuel cells, increased public transport use, changing lifestyles, use of
telecommunications.
Scenario 4: 33% reduction in transport energy demand.
59 Scenarios 2 to 4 imply a slight increase in transport’s share of emissions. Carbon Trust Baseline 1
60 (41%) Low carbon future, savings of 8.4MtC from fuel cell efficiency and 14.96MtC from sourcing H2 from renewables
46.64 36.64 (78.6%)
Carbon Trust Baseline 2
43 (36%) Low carbon future, savings of 6.82MtC from fuel cell efficiency and 14.96MtC from sourcing H2 from renewables
37.26 21.22 (56.9%)
PIU no baseline Global Sustainability and Local Stewardship both could reduce emissions by
up to 30MtC through increased efficiency, land use changes, increased use of public transport and non-motorised modes
55 25 (45.4%) GS
22 (40.0%) LS
IAG 59 (41%) Technology leading to the use of low carbon fuels, congestion grows, no new
road building, saturation of car ownership and reduced rail fares.
62 36 (58.1%)
AEA BAU 43 (37%) A 60% reduction involves 87.8% H2 fuel cells
A 70% reduction involves 98.0% H2 fuel cells
60 45
16 (26.7%) 13 (28.9%)
AEA World Markets 52 (39%) A 60% reduction involves 90.7% H2 fuel cells
A 70% reduction involves 98.6% H2 fuel cells
59 45 20 (33.9%) 12 (26.7% AEA Global Sustainability
34 (34%) A 60% reduction involves 74.2% H2 fuel cells
A 70% reduction involves 83.8% H2 fuel cells
59 45
20 (33.9%) 12 (26.7%)
The RCEP (2000) develops four illustrative scenarios all of which are designed to reduce emissions by 60% (save scenario 1 which achieves 57%) through changes in energy supply and demand. In scenario 1 demand for energy stabilises at 1998 levels. A 57% reduction in CO2 emissions is achieved by
switching to less carbon intensive energy sources including 50% of energy from renewables and/or nuclear or fossil fuels with carbon sequestration. In scenarios 2 and 3 demand falls by 36% encouraged by energy efficiency measures and increases in energy prices. Scenarios 2 and 3 differ only in terms of the energy mix required to deliver them. Scenario 4 sees a fall in demand of 47% and no nuclear power or carbon sequestration. The report states that “It is difficult to see how energy demand reductions on this scale could be achieved”. The RCEP scenarios examine sectors in terms of energy demand reductions.
The Carbon Trust (2001) use two baseline projections from which reductions are estimated. Baseline 1 is close to a business as usual scenario but still foresees increases in energy efficiency and 15% of electricity from renewable sources by 2050. Emissions would be close to current levels at 150MtC. Baseline 2 sees a greater focus on efficiency and renewables and some constraints on the transport sector, resulting in emissions of 120MtC. Four possible scenarios are considered involving low carbon markets, government, consumers and futures. Only the low carbon futures scenario (which combines the other three in order to remove all the main technical, economic, regulatory, institutional and behavioural constraints), achieves a reduction at or above 60%, namely 72% for Baseline 1 and 79% for Baseline 2.
The remaining three studies make use of the Foresight futures outlined above. The PIU (2002) study does not have a baseline as such. For the purposes of this paper the World Markets and Provincial Enterprise scenarios, in which carbon emissions increase, have been used as the baselines. The Global Sustainability and Local Stewardship scenarios both achieve reductions in excess of 60%, while the World Markets scenarios see a massive rise in emissions from transport. The IAG (2002) baseline includes the measures outlined in the UK Climate Change Programme. They do not forsee a 60% reduction in emissions under any of the Foresight scenarios. They therefore sought to find a prescriptive route to such a reduction, which involved: efficiency savings, 40% renewables, all power generation carbon free by 2050 and both technical changes and reduced demand in the transport sector. AEA Technology (2002) used a business as usual baseline together with World Markets and Global Sustainability, firstly without a carbon constraint to give a baseline, then imposing additional change to reach targets of 45%, 60% and 70% reductions. Figures from this study have been factored up by 15% to give end user emissions.
All five studies assume that some fuel switching will occur in transport. This is at its most extreme in the AEA Technology/ICCEPT study where the remit was to explore technological solutions. In this case up to 98.6% of transport power is from hydrogen fuel cells.
Efficiency measures suggested include increasing the fuel efficiency of current vehicles, the use of hybrids, and the reduction of road congestion to help reduce emissions produced by stop start movements, although IAG also see congestion as a constraint on traffic growth.
All the studies (except AEA Technology/ICCEPT, which had a specific brief) recognize the need for some behavioural change. The Carbon Trust Study incorporates some changes into Baseline 2 in the form of modal switching and no new roads. IAG suggestions included no new road build beyond 2010, and reductions in rail fares to encourage modal switch. However, the detail on how these measures would be achieved was not clear.
None of the studies included emissions contributions from the growing international aviation sector. At present Kyoto targets only include emissions from the domestic sector. However it is recognised that if international emissions were shared out, the UK would find it considerably more difficult to reach a 60% reduction target (IAG, 2002).
The PIU (2002) suggest that there will be increased demand for road transport which will remain dependent on oil for the next two decades, though this is likely to be offset by increased energy efficiency in road transport. This was considered to provide “a synergy with security objectives (no increased dependence on oil)” and “environmental objectives (no increase in greenhouse gas emissions; reduced vehicle noise)”. The PIU also indicated that energy efficiency measures could increase the price of new vehicles. There was little information in the other studies on possible conflicts and competition between or within sectors or how these might be resolved or avoided.
It is clear from these studies that emission reductions from the transport sector are expected to arise from technological measures. This raises two issues for concern. Firstly, recent improvements in efficiency have been offset by a range of factors including: increased mileage driven by economic growth and lower motoring costs, increased size and weight of vehicles, and wider uptake of additional features such as air conditioning (Bristow, 1996, Fergusson, 2001, IPCC, 2001b). Secondly there is the possibility that the technology may not develop as quickly or as cost effectively as anticipated. This issue is recognised by the RAC Foundation (2002) which suggests that other options, which constrain the demand for vehicle use, need also to be examined.
2.4 Transport Scenarios and Targets
In this section specific scenarios for the transport sector are developed drawing on the studies reviewed. Two carbon dioxide emissions targets for the UK are examined and the role of the transport sector in achieving these targets is considered.
The carbon dioxide emission targets are determined using the RCEP interpretation of the contraction and convergence approach outlined above. The focus here is on the transport reductions needed to achieve the 450 ppm and the 550 ppm stabilisation targets.
A 450 ppm stabilisation target requires a 79% reduction in carbon dioxide emissions from 1997 levels by 2050. Since carbon dioxide emissions were 148 MtC in 1997 in the UK (DEFRA, 2002), stabilisation at 450 ppm means UK carbon dioxide emissions would need to fall to 31.1 MtC per annum in 2050. A 550 ppm stabilisation target requires a 58% reduction in carbon dioxide emissions from 1997 levels by 2050. To achieve stabilisation at 550 ppm, UK emissions would have to fall to 62.2 MtC per annum in 2050.
The key question is what role should transport play in achieving the overall carbon dioxide reduction targets identified as necessary to achieve stabilisation. Clearly there is considerable uncertainty about how much of a contribution to overall emissions will be made by different sectors. Two different options have been developed based on the forecasts discussed earlier. Option 1 assumes that transport’s emissions remain at the same proportion of total emissions as in 1997. Option 2 allows transport’s proportion of total carbon dioxide emissions levels to increase in line with forecasts.
Option 1: Transport’s contribution fixed at 1997 levels
In 1997 the end use of transport produced 39 MtC of the total 148 MtC from carbon dioxide emissions, a 26.4 % contribution. Applying the 26.4% to the 31.1 and the 62.2 MtC overall emissions targets results in transport contributing 8.2 MtC and 16.4 MtC.
Option 2: Transports contribution derived from forecasts
The second approach looks at the implications of existing forecasts for transport emissions. To determine the potential future contribution from transport, four of the five studies previously analysed were used. The RCEP work was not included, since the role of transport in achieving stabilisation of demand at 1998 levels is not quantified. Table 2 shows as the transport baseline for each study what might happen in a non-carbon constrained world. There is a range but for those scenarios that are closest to business as usual the figure is around 40%. Although the PIU do not use a baseline, their forecasts for World Markets suggest that transport’s share could be as high as 54%. In a carbon
constrained world there is a wide range of predictions for transport’s contribution. When compared to their non-carbon constrained forecast, the Carbon Trust and the IAG suggest that transport’s share of emissions could be even higher; the PIU figures roughly correspond with those for a non-carbon constrained world; while the AEA Technology/ICCEPT work suggests a lower contribution.
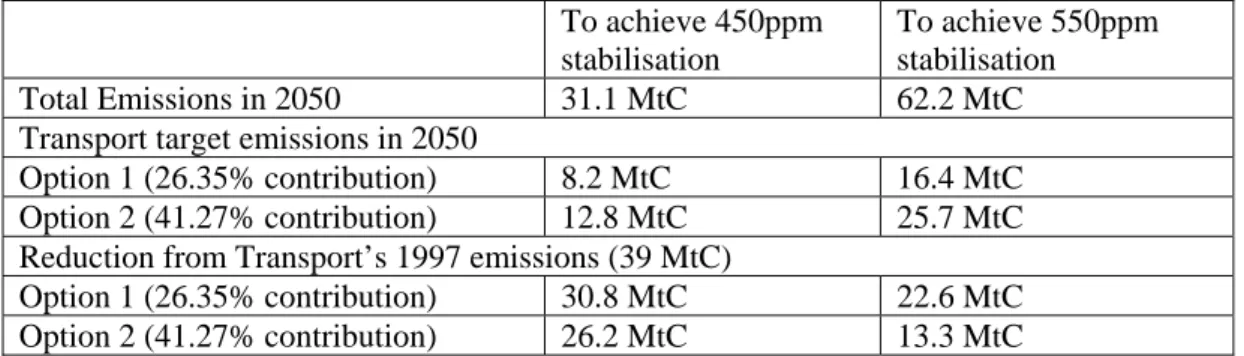
To determine transport’s future contribution it was decided to use the average contribution from transport to emissions in a carbon constrained world. This results in a higher contribution from the transport sector of 41.4%. This is in line with other UK research (DTI, 2003b) which indicates that transport carbon savings are among the higher cost options, compared to other sectors, and hence it is to be expected that transport’s percentage carbon contribution may end up higher than it is now. The 41.4% figure is also close to the estimates for a non-carbon constrained world. Applying this to the 31.1 MtC and the 62.2 MtC results in emissions of 12.8 MtC and 25.7 MtC. Table 2.3 shows the derived emissions targets for the transport sector.
Table 2.3: Transport target emissions
To achieve 450ppm stabilisation
To achieve 550ppm stabilisation
Total Emissions in 2050 31.1 MtC 62.2 MtC Transport target emissions in 2050
Option 1 (26.35% contribution) 8.2 MtC 16.4 MtC Option 2 (41.27% contribution) 12.8 MtC 25.7 MtC Reduction from Transport’s 1997 emissions (39 MtC)
Option 1 (26.35% contribution) 30.8 MtC 22.6 MtC Option 2 (41.27% contribution) 26.2 MtC 13.3 MtC
Option 2 is based on forecasts and is therefore probably the better representation of the role of transport. However, the more stringent targets in Option 1 are also useful, given the risk that other sectors may not be able to deliver reductions in excess of the 60 and 80% targets to 2050. Emissions from international air travel alone (excluded from these estimates) are forecast to exceed all but the weakest target by 2030. Whatever is achieved domestically will need to be matched by action on international aviation.
2.5 Conclusions
The objective of this phase of the work was to establish CO2 emission targets for the UK transport
sector in 2050. A literature review suggested two stabilisation targets for CO2 of 550 ppm and 450
ppm. For the UK this implies total emissions in 2050 of 62.2 and 31.1 MtC respectively. Work then moved on to a review of five key studies containing future scenarios for CO2 emissions for the UK.
These studies were used firstly to establish feasible 2050 baseline projections for the UK and secondly to examine possible ways in which reductions could be achieved.
Two approaches were used to estimate the contribution of transport to total emissions in 2050:
• stabilisation at the current level of approximately 26%
• an increase to approximately 41% derived from the studies reviewed
These percentage contributions were then applied to the 62.2 and 31.1 MtC emission targets and the emission reductions needed from transport’s 1997 levels calculated. The results gave a range of targets from 8.2 MtC to 25.7 MtC and a range of reductions from 13.3 MtC to 30.8 MtC. Even the weakest of these targets implies a significant reduction from current emission levels. When set against the forecast growth in emissions shown in Table 2.1, the weakest target would require a 50% reduction from trend by 2020.
3. DEVELOPING STRATEGIES TO MEET THE TARGETS FOR LAND BASED PASSENGER TRANSPORTe
Overall targets for reducing CO2 emissions were derived in Chapter 2. The second step was to
establish the contribution of personal land based transport to this total, which is currently around 65%. Analysis of the National Road Traffic Forecasts (DETR, 1997) suggests that personal land based transport’s contribution to transport emissions is likely to fall to around 60% in 2050. The estimated targets for transport as a whole and for personal land based transport, assuming a 60% share of transport emissions, are shown in Table 3.1.
While these are targets for 2050 the earlier they are achieved the better in terms of mitigating the impacts of climate change.
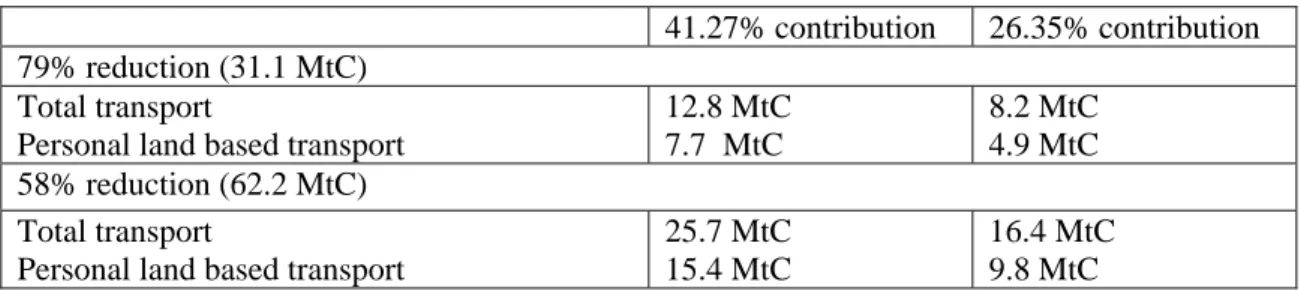
Table 3.1 Target emissions from land based personal transport for the UK in 2050
41.27% contribution 26.35% contribution 79% reduction (31.1 MtC)
Total transport
Personal land based transport
12.8 MtC 7.7 MtC 8.2 MtC 4.9 MtC 58% reduction (62.2 MtC) Total transport
Personal land based transport
25.7 MtC 15.4 MtC
16.4 MtC 9.8 MtC
To place these emission targets into context, potential carbon emissions in 2050, from the land based personal transport sector, were calculated. The initial assumption is that no improvements in car vehicle technology or changes in policy take place, giving what could be termed a worst case trend forecast. Current well to wheel emissions per kilometre were combined with predicted increases in car vehicle kilometres. Low, Central and High National Road Traffic Forecast (NRTF) (DETR, 1997) estimates were used with a continuation of trend assumed for the period 2031-2050. Current car vehicle kilometres are approximately 380 billion. The forecasts to 2050 give a range from 494 billion kilometres under the low growth assumptions to 686 billion kilometres under a high growth assumption. This results in carbon emissions from cars increasing from approximately 21.5 MtC to 33.8 MtC under the central NRTF assumptions.
Assumptions are also required on the levels of emissions from bus, rail, motorcycle and the manufacture of vehicles. It was assumed that increases in efficiency would reduce carbon emissions from these sources from approximately 5.5 MtC at present to 1.6 MtC in 2050. Although this is a strong assumption it was thought plausible due to increased electrification of rail and because it is easier to introduce new fuels and technologies in fleet based vehicles (buses).
The total carbon emissions from personal land based transport under our trend scenario for NRTF central growth assumptions are shown in Table 3.2.
Table 3.2 Trend growth in total Carbon emissions from personal land based transport under central growth forecasts (MtC)
2001 2010 2020 2030 2040 2050 Emissions 27.0 30.2 31.6 32.9 34.2 35.4
e
3.2 Developing Strategies to Meet the Targets
In order to examine how the targets in Table 3.1 might be achieved it was essential to gain a clear idea from the literature of the possible contribution of individual categories of measures, namely, technology, public transport, walking and cycling, restraint measures and land use. Most estimates in the literature on impacts are short or medium term, given the uncertainties associated with long run forecasts. We have developed a strategy for implementation for each measure, based on the best evidence from the literature and taking into account some constraints on acceptability. When looking at technology we have tried to identify two possible paths, but not the policies that would be necessary to secure such change. When considering other policy areas we have considered evidence on existing relationships to prices, service quality etc and attempted to identify the strategies that could be implemented and the changes in traffic levels that could be secured. We have to some extent taken practical feasibility, acceptability and phasing of measures into account. Improvements to public transport occur only after 2015 given the current condition of the rail network, road user charging is initially revenue neutral and in this case improvements to public transport occur only after revenue is generated which might contribute to them. Note that these scenarios are intended to be exploratory and illustrative of what might be achieved and they may be subject to further change. We recognise that many different approaches could have been taken and we present here only a subset of the possibilities. At the end of this section we consider the extent to which effects could be additive.
3.2.1 Technology
The role of technology and changes in purchasing behaviour to favour low emission vehicles was considered first, as this will form the base for further policy intervention.
It is expected that technological developments will play a major role in achieving emissions reduction, including: hybrid vehicles, fuel cell vehicles powered by hydrogen, and more efficient petrol vehicles. Average well to wheel emissions per vehicle kilometre for the current car fleet are 205.5 grams CO2.
To consider the potential impact of the use of lower carbon vehicles, two scenarios A and B were developed. Both scenarios assume full implementation of the ACEA/EC (1998) agreement to achieve average new vehicle emissions of 140g CO2/km by 2008. Scenario A assumes no further significant
change and gradual fleet turnover to give a 25% reduction in emissions by 2050. Scenario B assumes a combination of new technology, improvements to current technology and changes in purchasing behaviour toward more efficient vehicles to yield a 60% reduction in emissions by 2050. The estimated well to wheel carbon dioxide emissions per vehicle kilometre are shown in Table 3.3.
Table 3.3 Well-to-wheel Carbon Dioxide Emissions g/km
2001 2010 2020 2030 2040 2050 Scenario A 205.5 176.4 171 165 160 154 Scenario B 205.5 176.4 146 120 100 82 The best performing vehicles in terms of well to wheel CO2 (tailpipe emissions are uplifted by 1.15 to
provide a well to wheel figure) emissions available in the UK are : Honda Insight petrol/electric hybrid 1.0 IMA coupe (92), Renault Clio 1.5 80bhp diesel (126.5), the Smart City Coupe Pure petrol (130) and the Toyota Prius 1.5 petrol/electric hybrid (131.1) and a number of smaller diesel cars are approaching this level. We therefore have a scenario (A) that is achievable using existing technology and one (B) that requires substantial technological advance, investment and widespread adoption of new technology.
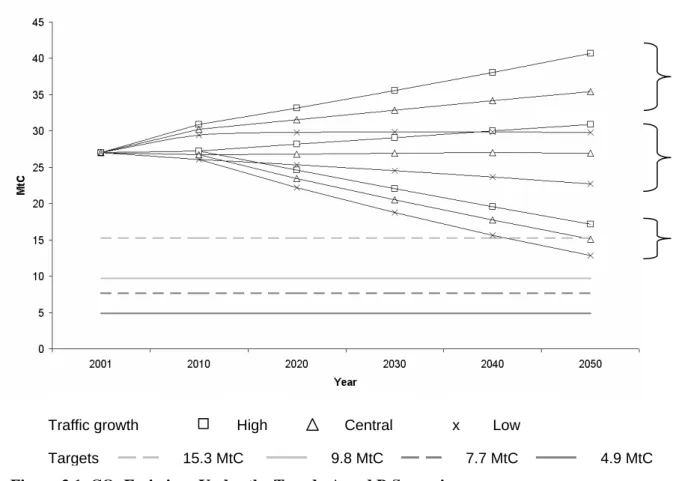
Figure 3.1 maps the trend scenario as outlined in section 3 alongside A and B. For each scenario in this and future graphs the low, central and high NRTF estimates are illustrated. Under scenario B the weakest target is met for the low and central growth forecasts.
Further technological gains may be possible, based on a switch to hydrogen propulsion by 2050 but considerable uncertainties remain with regard to the eventual development of the technology, the availability of carbon neutral hydrogen and the pace of change. It is unlikely that all the hydrogen required could be sourced from the carbon neutral sources necessary to secure reductions in emissions. Thus far hydrogen powered vehicles do not offer considerable overall savings in CO2 largely due to
the ways in which hydrogen is produced and stored (Pridmore and Bristow 2002). The initial potential savings from hydrogen are higher in sectors other than transport.
We view a 60% reduction in CO2 emissions from technology as a fairly optimistic scenario. It is clear
that behavioural change will be needed as an essential part of any strategy to achieve a low carbon transport future. Such behavioural change could also facilitate early movement in the direction of the targets, which is crucially important in order to prevent the build up of greenhouse gases in the atmosphere.
Figure 3.1 CO2 Emissions Under the Trend, A and B Scenarios
3.2.2 Pricing for Road Use
Two possible measures were considered (i) a national road user charge per vehicle kilometre and (ii) increases in fuel taxation. Increases in fuel taxation would not only reduce car use but also give an added incentive to chose a more efficient or alternatively fuelled vehicle. However, road user charging has advantages in that it may be varied according to when and where the mileage occurs and hence can be used to address other objectives of transport policy relating to efficiency and environmental impacts and may also prove to be more acceptable. We therefore considered both and attempted to identify a feasible pathway.
It is assumed that national road user charging is implemented in 2010 and is revenue neutral to 2015, offset by reductions in vehicle excise duty and fuel duty and yields a maximum 5% reduction in
Targets
Scenario A Trend
Scenario B
15.3 MtC 9.8 MtC 7.7 MtC 4.9 MtC High Central x Low
vehicle kilometres (CfIT, 2002). Between 2015 and 2020 the charge increases by 2% per annum. For this time period a short run elasticity of -0.16 is used (Brown et al, 1993). Between 2020 and 2030 it is assumed that the charge increases by 4% per annum, and a long run elasticity of -0.31 is used (Brown et al, 1993). Figure 3.2 shows the carbon emissions produced when road user charging is combined with scenarios A and B under the three different levels of NRTF traffic growth. At this stage the impact on public transport of modal shift is not considered - effectively trips are either suppressed or switched to existing public transport services or non-motorised modes.
Fuel consumption is more sensitive to price than traffic levels. Graham and Glaister (2002) estimate the price elasticity for fuel consumption to be –0.2 to –0.3 in the short run and –0.6 to –0.8 in the long run while for traffic levels the elasticities are –0.15 and –0.3 respectively. In this analysis we examine the change in traffic levels, as we have already made some assumptions relating to technology, albeit without policy incentives to secure such changes. The impacts from a similar implementation and pricing strategy as for national road user charging would lead to a similar reduction in traffic levels.
Figure 3.2 CO2 Emissions Under Scenarios A and B with Road User Charging
As Figure 3.2 shows, the addition of a strong price signal in combination with the substantial technical advance of Scenario B reaches the weakest target under all the NRTF assumptions. To reach the target of 7.7 MtC under Scenario B, prices would have to rise by 7.3% a year from 2015 to 2050 (under central traffic growth). Scenario A is still not close to the weakest target. In order to reach the strongest target under Scenario A prices would have to rise by 19% a year from 2015 to 2050, reducing vehicle kilometres to 75 billion.
3.2.3 Public Transport
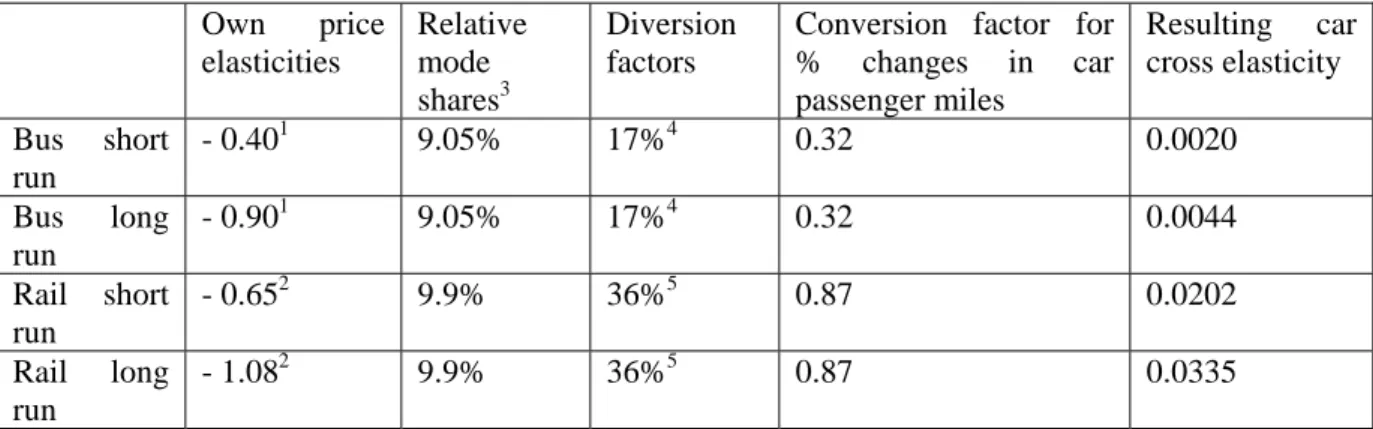
Our key interest is in the diversion of trips from car to public transport. To derive car cross elasticities the method set out in Dodgson (1991) and Acutt and Dodgson (1996) is used and the resulting elasticities are shown in Table 3.4.
Scenario A
15.3 MtC 9.8 MtC 7.7 MtC 4.9 MtC Targets
High Central x Low Traffic growth
Table 3.4 Key assumptions used to derive car cross elasticities Own price elasticities Relative mode shares3 Diversion factors
Conversion factor for % changes in car passenger miles Resulting car cross elasticity Bus short run - 0.401 9.05% 17%4 0.32 0.0020 Bus long run - 0.901 9.05% 17%4 0.32 0.0044 Rail short run - 0.652 9.9% 36%5 0.87 0.0202 Rail long run - 1.082 9.9% 36%5 0.87 0.0335 Sources: 1Dargay and Hanly 2002, 2Goodwin 1992, 3Bristow et al 2002, 4Nash 2002, 5derived from Acutt and Dodgson 1996 22% and Vicario 1999 50%.
Bus fares are assumed to fall by 3% per annum and service levels increase by 5% per annum between 2015 and 2035. Rail fares fall by 5% and service levels increase by 3% per annum between 2015 and 2035. After 2035 fares are held constant.
Decreasing fares and improvements in service provision are not the only ways of increasing the attractiveness of public transport; additional methods include improvements to interchange, simplification of fare structures, increased information provision, better integration between modes, adherence to timetables (reliability), and for bus increased priority. It is difficult to quantify the impact of these improvements. However, TAS (2001) suggest that reliability could be almost as influential as service level and also illustrate the potential return from quality packages. Here such measures are assumed to be half that of the fare and service impact combined. This might be viewed as a favourable assumption.
The 2030 emission reductions for public transport are partly offset by the provision of additional services. It is assumed by 2050 that the use of much lower emission buses and electrified trains powered by renewable energy remove this impact.
The analysis suggests that improvements to public transport could lead to a 8% reduction in vehicle kilometres driven in 2050. Rail provides 7% and bus 1% of this.
Depending on the scenario and growth rate the additional reduction offered by improvements to public transport would be between 0.89 and 2.34 MtC by 2050. The weakest target is met by 2050 only under Scenario B with low and central NRTF growth. Compared with technology alone no new targets are met.
3.2.4 Telecommunications
Our assumptions for 2050 are based on Salomon (1985) Van Ommeren et al (in Lake, 1997) and Handy and Moktarian (1996) such that by 2050 telecommunications replaces: 40% of business travel, 16% of commuting trips (assuming 40% of the commuters telework for two days every week) and 40% of shopping trips. The impacts on both car and public transport were calculated, and it was assumed that this replacement of travel would occur gradually. The outcome may be viewed as optimistic as we have assumed that all the car mileage is saved, whereas the car may be used by others in the household or the telecommuter may use it for additional trips (Hopkinson et al 2002).
Depending on the scenario and the traffic growth used the additional emission reductions offered in 2050 vary between 1.95 MtC and 5.06 MtC. The weakest target is met by 2050 only under Scenario B for low, central and high NRTF growth.
3.2.5 Land Use Measures and Improvements to Walking and Cycling Facilities
Land use measures include: increasing development densities, the use of maximum parking standards and altering development patterns to encourage provision and use of public transport, and walking/cycling facilities (May and Matthews, 2001). To achieve significant traffic reduction, alterations to land use need to be integrated with transport policies (Paulley and Pedler, 2000). The DOE/DOT (1993) suggest that land use planning policies in combination with transport measures could reduce transport emissions by 16% over a 20-year period while more recently WS Atkins (1999) suggest reductions in traffic of up to 2% could be achieved by 2010. For our scenario we have assumed that by 2050 land use measures alone could lead to traffic reductions of 10%.
Depending on the scenario and NRTF rate used, reductions of between 1.60 and 4.20 MtC could be achieved in 2050. The weakest target is met by 2050 only under Scenario B for low, central and high NRTF growth.
3.2.6 Combinations of Measures
Thus far even under scenario B no measure has achieved anything but the weakest carbon reduction target. Table 3.5 summarises the individual measures examined.
Table 3.5 Emission Levels under Scenarios A and B for central NRTF forecasts (MtC)
Intervention 2030 2050
Trend 32.9 35.4
Scenario A Scenario B Scenario A Scenario B Lower Emission Cars (LEC) 27.0 20.5 27.0 15.3 LEC + Road Pricing 22.4 17.2 22.1 12.5 LEC + Fuel Prices* 22.5 17.3 22.2 12.6 LEC + Public Transport 26.3 20.3 24.9 14.0 LEC + Telecommunications 24.3 18.5 22.4 12.6 LEC + Land Use 25.0 19.0 23.3 13.2 * Impact on traffic levels
In looking at combinations so far technology in combination with pricing appears to deliver the greatest reduction by 2050. If applied using fuel prices, this would also incentivise drivers to move to efficient vehicles and to adopt new technology earlier. The next question is the degree to which each measure secures benefits additional to the others. We have distinguished in Table 3.6 between four levels of interaction between measures:-
- substitutability: measure A has a similar impact to measure B, and can replace, but not add to it;
+ complementarity: the combined effect of measures A and B is greater than either alone but less than their sum;
++ additivity: the combined effect of measures A and B is equal to the sum of their individual effects
+++ synergy: the combined effect of measures A and B is greater than the sum of their individual effects.
Table 3.6 Expected Interactions Between Measures Road Pricing Fuel Pricing Public Transport Telecommun ications
Land use Technology Road Pricing Fuel Prices - Public Transport + + Telecommunic ations + + ? Land use + + + ? Technology ++ +++ ++ ++ ++
It is clear that there is positive interaction between road and fuel pricing and the additional measures. It is likely that some changes such as increased use of telecommunications will occur independently of transport policy. It does seem justified to add the impacts of technology to those of fuel or road pricing as our estimates considered the effect of pricing on road traffic rather than on efficiency gains. However, if pricing is implemented then this will increase uptake of public transport and this will reduce the impact of price and service changes on public transport, as there are now fewer car users to switch. Similarly pricing is likely to drive the take up of telecommunications and the development and use of walkable communities.
3.3 Interviews with Experts
Face to face interviews were carried out with 7 experts with transport policy and technology backgrounds. As part of the interview design process and as an informative exercise in its own right, a brain storming session was held in ITS in January 2003. The interviews took place over a three-week period (March-April 2003) and in the majority of cases were at the workplace of the interviewee. Prior to the interview the background information note was emailed and a colour copy posted to the interviewee. The background information note summarised our carbon reduction targets and provided detailed information about the role of technological and behavioural change in reducing transports carbon emissions. Topics for discussion at the interview were also suggested.
Overall the interviews went well. The background paper and suggestions for discussion topics helped provide a framework to the interview. Key results from the discussions are detailed below. Where appropriate reference is made to the ITS brainstorming session.
For technology it was clear that large reductions in carbon emissions are expected by 2050. Incremental improvements and modifications to internal combustion engines were likely to occur first. Hybrid vehicles were seen as playing a significant role in achieving carbon reduction. One respondent thought that the higher cost of hybrid technology would remain a barrier.
Increasing dieselisation of vehicles would also offer carbon reduction benefits. With diesel hybrids offering a 40% reduction compared to current conventional petrol vehicles. However diesel vehicles emit higher levels of small particulates and NOX and there is therefore a potential conflict between air
quality and climate change objectives.
In the longer term hydrogen fuel cell vehicles were seen as a possibility. However there were reservations, especially concerning the production of hydrogen and its storage (note the objections from residents of Havering to the siting of a BP hydrogen refuelling station nearby (Macalister, 2003)). It was apparent that the experts were less ‘sure’ about a hydrogen transport future than reports in the press and recent government literature would suggest. Other fuel sources, for example biofuels, were suggested.
To achieve an increase in fuel efficiency, changes had to be implemented at the European level, therefore future ACEA/EC agreements were seen as an important strategy. This was also a conclusion of the ITS brainstorming session. Other suggestions included grants to partially offset the additional cost of lower carbon vehicles as currently offered by Powershift for the purchase of hybrid vehicles. Changes in the tax system to favour the purchase of more fuel-efficient vehicles were also put forward. Those with a transport policy background were more in favour of fuel pricing as a mechanism to encourage the use of lower emission vehicles than people who were more technology orientated.
For behavioural change there was an emphasis on road traffic restraint measures. It was suggested that the government’s recent recognition that congestion reduction targets would not be met by the Ten Year plan coupled with a growing realisation that the extent of road build required to meet anticipated traffic growth would not be acceptable, would ensure that traffic restraint measures would be implemented in the longer term. The introduction of road user charging for Heavy Goods Vehicles in 2005, and the initial success of the London congestion charging scheme were also seen as contributing to a move to wider restraint measures. There was an emphasis on road pricing though road space re-allocation and fuel prices were also considered as restraint measures. The concept of fuel/carbon permits was not mentioned though was suggested in the brainstorming session. Initially a package of different traffic restraint measures would need to be implemented. Two of the technology experts thought the impact of traffic restraint low in proportion to the cost to the individual. The impact of restraint measures could be higher than our modelling suggests because of lifestyle changes in the longer term. In terms of public acceptance to the scheme it was thought that the initial implementation would be the hardest part.
It was recognised that there would be synergy between measures and that if the ‘stick’ of traffic reduction measures were implemented then ‘carrots’ would also be needed. There was agreement that improvements to public transport worked well with traffic restraint measures and that if pricing was involved this would act as a source of potential funding. There was also the suggestion that if road restraint measures were introduced then rail might then have the edge in competitive terms and the private funding for the railways assumed in the Ten Year Plan might become more readily available. Several public transport issues were raised. These included the location of new rail stations and services since new stations may simply encourage people to locate at greater distances from their workplace. Another issue was the ability of the public transport system to cope with the modal shift however it was noted that the system had accommodated change in the past. The impact of lifestyle change in the longer term was also considered and a move to a multi-modal lifestyle was thought possible.
Increased use of telecommunications was expected regardless of transport issues. The benefits in terms of carbon reduction were queried as additional energy could be used to travel in the time now freed from commuting and to heat and light the home during working hours. It was suggested that steps should be taken to ensure that the most energy efficient telecommunications technologies were used.
For land use our assumptions were thought to be reasonable. The general assumption that land use change takes place over the longer term and transport infrastructure change over the shorter term, was questioned by one respondent, suggesting that structural regeneration of UK cities could be quicker than implementing a light rail scheme.
The impact in carbon emission reductions was not quantified by any of the experts. The impacts and synergy would depend very much on individual circumstances. One expert said it would be impossible to quantify at a national level and extremely difficult at a local level. A matrix table indicating positive and negative synergy was thought an appropriate solution.
Experts also suggested several areas of policy, which we had either not considered or which needed further attention, these included: the impact of telematics, the impact of more fuel efficient driving
practices including further speed restrictions on the motorway, the replacement of short car trips by walking and cycling, the consideration of soft factors (in particular travel plans and individualised marketing), changes to taxation and the potential for increased competition between UK domestic flights and rail.
It is thought possible that real time driver information could produce a 6% reduction in mileage driven (Graham and Marvin, 1999). While more fuel-efficient driving practices for example: keeping tyres inflated at the correct pressure, avoiding excessive acceleration and observing motorway speed limits could result in a 5-20% improvement in fuel efficiency (Potter et al, 2001). The introduction of further speed restrictions on the motorway would bring about significant reductions in vehicle emissions since vehicle emissions are at their lowest at around 50mph rising on average between 30% and 35% between 70mph and 80mph (DETR, 2000). However such limits are unlikely to be publicly or politically acceptable at present.
Approximately 17% of all car distance travelled as a driver is for journeys of less than five miles (analysis using Potter, 1997). If 20% of these trips were replaced by walking or cycling and taking into account the 40% extra carbon production that results from the inefficiency of driving short distances, there could be a fall of approximately a 4.8% in carbon emissions from car use. A 20% replacement may be overoptimistic at the present time. Work by Mackett (2000) found that actions to encourage transfer from cars to walking and cycling could reduce the distance travelled by car by about 0.3% for walking and 0.4% for cycling, allowing for the inefficiency in driving short distances this would only result in around a 1% reduction in carbon emissions.
A review of 20 UK case studies on the impact of travel plans found that on average there was an 18% reduction in the proportion of commuter journeys being made as a car driver (DfT, 2002b). Quantitative results from travel blending programmes indicate that a 10% reduction in car driver kilometres is possible though further research is needed before results can be generalised (Rose and Ampt, 2001). In terms of overall impact Halcrow (2002) suggest workplace travel plans could lead to a 0.6% reduction in vehicle kilometres while Eco-Logica (2002) suggests a 2.4% reduction due to workplace travel plans and 1.3% reduction due to school travel plans.
Changes to taxation included alterations to the personal taxation regime to encourage modal shift, and these are already being considered by the DFT (2001). It was found that tax changes could help ease the development and benefits of company travel plans. More radical changes included the use of ecological taxation, here consumption would be taxed rather than labour.
In terms of carbon emissions a move to an increase in domestic aviation at the expense of rail transport would lead to large increases in carbon and other greenhouse gas emissions at approximately five times higher than those for rail.
3.4 Packages of Measures to Meet Targets
In this section we focus on one target to allow us to elaborate in some detail three strategies that could meet a target of 12.6 MtC by 2050, which is the midpoint between the 15.4 and 9.8 target detailed in Table 3.1. A 12.6 MtC target relates to a 58% reduction in carbon emissions by 2050 and a stabilisation target of 550 ppm. This reflects the target in the Energy White Paper (DTI, 2003). In order to achieve stabilisation at 450 ppm more dramatic strategies would have to be envisaged. The strategies are based on our modelling work and the interviews with experts.
Strategy 1 involves dramatic technological change affecting both the type of fuel and power mechanism used. There is no behavioural shift and car vehicle kilometres grow in line with central NRTF forecasts from 380 billion to around 600 billion. To reach the 12.6 MtC target carbon emissions per vehicle kilometre would have to fall to 66 grams of carbon dioxide per kilometre. A car fleet that was 42% hybrids and 58% powered by carbon neutral hydrogen fuel cells might achieve this. Hydrogen could be provided by electrolysis in which case a 39% increase in current electricity
production would be required. If produced from woody biomass then approximately 36% of UK arable land would have to be used to produce the crop.
Strategy 2 involves a mixture of both technological change and measures to ensure reduction in demand. The average vehicle would emit 88.4 grams of carbon dioxide per vehicle kilometre. A car fleet that was 68% hybrids and 32% powered by hydrogen fuel cells could achieve this. Under this scenario car vehicle kilometres grow from 384 to approximately 450 billion. This level is considerably below the central NRTF and will therefore require measures to reduce car use. Options include increasing the price of fuel by 2% a year from 2015 to 2050, an increase of 100% by 2050, or a nationwide road user charging scheme, revenue neutral from 2010 to 2015 and then increasing by 2% a year to 2050. The pricing measure would need to be accompanied by other measures to induce modal shift through bus and rail fares decreasing at 1% per annum and increased service provision at 1% per annum over the period 2015-2035. Additional methods of encouraging modal shift would include improvements to interchange, increased information provision, adherence to timetables and, for bus, increased priority.
Strategy 3 involves less technological change. Carbon dioxide emissions per car vehicle kilometre would be 133.6 grams per kilometre. This is achieved through improvement in fuel efficiency of internal combustion engines and use of hybrids. However, car vehicle kilometres would need to fall from current levels of 384 billion to 300 billion. To achieve this change options include increasing the price of fuel by 5.5% per annum from 2015 to 2050, an increase of 550% by 2050 or road user charging revenue neutral 2010 to 2015 and then increasing at 5.5% a year. Improvements in public transport on a similar scale to Strategy 2 would also be necessary. People would also be encouraged to live nearer their place of work, and telecommute. Walk and cycle facilities would be improved and there would be increased provision of local shops and facilities. The very large price increases under this strategy might well be expected to generate further gains in vehicle efficiency. Significant changes to attitudes and lifestyles would need to occur.
Strategy 1 offers a technological solution, assuming the technology delivers and that massive increases in electricity generation are feasible or a vast switch in arable crops. The main technological changes are likely to come towards the end of the time period, and it is therefore a risky scenario. Strategy 2 provides a mix of measures including an average vehicle performance beyond the best on the market to date. In order to restrain traffic growth the policies might be seen as fairly draconian, but this is in part due to the proposed delays in their implementation to reflect political acceptability. Strategy 3 is difficult to envisage without a large shift in attitudes, behaviour, lifestyles and the world around us.
3.5 Conclusions
We are operating in an area of great uncertainty as to what the transport system could look like in 50 years’ time. However, we have endeavoured to establish possible routes towards a low carbon future for personal land based transport. Key findings are:
1. Technology cannot be the sole measure for reducing CO2 emissions:
• there is uncertainty as to the level of reduction that can be delivered in terms of vehicle technology and securing carbon neutral sources of hydrogen;
• any cuts will be offset to some extent by increased demands; and
• it is important that reductions are secured sooner rather than later if key stabilisation targets are to be achieved.
2. Clear price signals to car users appear to be the most effective measure alongside technological change. The use of the price of conventional fuel as the instrument will also give an additional incentive to travellers to switch to more efficient vehicles or to adopt new technologies earlier than would otherwise be the case.
3. Improvements to passenger transport, cycling and walking facilities, the siting of facilities closer to home and the increased use of telecommunications will also be required if change is to occur on a sufficient scale.
4. Existing knowledge is stronger on technology and pricing effects than on measures relating to telecommunications, service quality, walking, cycling and land use. However, even for these, we cannot be certain that current elasticities will apply in fifty years time. There is uncertainty as to the nature of long run adaptation and life style change.
5. Our scenarios have been constrained by political and social acceptability, hence the relatively late introduction of both pricing and improvements to public transport. However, if these measures were introduced earlier, the required increases to say petrol prices would be less extreme as the traffic growth in the years prior to the 2010 and 2015 implementation dates could be avoided.
Thus far we have derived targets for CO2 reduction in the land based passenger transport sector and
using best estimates from the literature derived possible ways of reaching these. The next step reported in chapter 4 was to obtain further expert opinion on both the targets and the strategies.
4. EXPERT CONSULTATION 4.1 Introduction
A Delphi survey of experts was conducted to investigate how deep cuts in carbon dioxide emissions from the personal land-based transport sector could be made. A range of low carbon strategies were developed in chapter 3 based on trends, evidence on technological development and the academic literature on behavioural response. The Delphi survey aimed to explore the importance of a range of technological and behavioural measures in reducing carbon emissions from personal land based transport and to test further the feasibility, desirability and likelihood of the scenarios.
4.2 The Survey Process
The survey process was designed to generate over a short period (September to November 2003) a set of opinions about how carbon dioxide emissions are likely to change from present levels by 2050. The personal land-based transport sector was considered in detail with levels of projected traffic growth and emissions targets being examined. The people we consulted were either involved in transport-related research, or part of transport policy or industrial communities and were mainly based in the UK. The survey was conducted in two stages:
1. A paper-based survey using a detailed questionnaire ran for three weeks, ending in late September 2003. The aim was to generate as much data as possible without making it onerous for the participants. 77 people were identified as having knowledge of this field and were invited to participate. 16 completed surveys were received.
2. The results from the first phase were collated and used to prepare a report which participants and others were asked to comment on. All information was presented in an anonymous and unattributed form. The second phase of the survey allowed participants to compare their own answers with the responses of others, and to make changes if they desired or to add any further comments. To capture additional data, reactions were also encouraged from those who did not complete the first stage and the same 77 experts were invited to take part. The second phase ran for three weeks, ending in late October 2003. Out of the original 16 participants, 12 completed the second round. An additional six new participants also took part.
In total, we were able to collect the views of 22 people, constituting a diverse set of the key stakeholders in the field (broadly categorised as: 9 academics, 5 consultants, 2 pressure groups, 3 research institutions, 3 local/central government). It is our view that this sample is broadly representative of wider expert opinion. Considerable effort was made in contacting the expert community, but it is inherent in the nature of complex Delphi surveys that the response rate is low. Some respondents changed their answers in the second round. For some questions this had the effect of reducing the data range and eliminating the highest and lowest numbers, so there was greater agreement in the responses. However this effect was not seen in all cases, there was little or no movement on some questions and for others the second round responses increased the data range, this increase was, however, in all cases quite small.
4.3 Results and discussion
The survey process generated a wide variety of inputs and insights about how progress towards lowering carbon emissions from transport in the UK could be made. In this section the results of the survey are presented. The questions that were put to participants are given first, and the answers received follow.