4.5 TRANSPORTATION, TRAFFIC AND SAFETY
This section provides an overview of transportation and traffic and evaluates the operational and construction impacts associated with the proposed project and its alternatives. Topics addressed include the circulation system, congestion management plan, emergency access, and public transit, bicycle, and pedestrian facilities. Synchro modeling for Existing, Project and Alternative Conditions is on-file and available for review in the Planning Department, 6th Floor, Room 667, City Hall (contact Dave Somers at david.somers@lacity.org).
REGULATORY FRAMEWORK
FederalThere are no federal regulations that address transportation impacts associated with the project.
State
Complete Streets Act
Assembly Bill (AB) 1358, the Complete Streets Act (Government Code Sections 65040.2 and 65302), was signed into law by Governor Schwarzenegger in September 2008. As of January 1, 2011, the law requires cities and counties, when updating the part of a local general plan that addresses roadways and traffic flows, to ensure that those plans account for the needs of all roadway users. Specifically, the legislation requires cities and counties to ensure that local roads and streets adequately accommodate the needs of bicyclists, pedestrians and transit riders, as well as motorists.
At the same time, the California Department of Transportation (LADOT) unveiled a revised version of Deputy Directive 64, an internal policy document that now explicitly embraces Complete Streets as the policy covering all phases of state highway projects, from planning to construction to maintenance and repair.
CEQA
In September 2012, Governor Brown signed into law AB 2245, amending CEQA Section 21080.20.5 to exempt restriping of City streets (until January 1, 2018) for bicycle lanes. The City is required to prepare an assessment of traffic and safety impacts and to hold noticed public hearings in the affected areas.
Regional/Local
Congestion Management Program
As the Congestion Management Agency for Los Angeles County, Los Angeles County Metropolitan Transportation Authority (Metro) is responsible for implementing the Congestion Management Program (CMP). On October 28, 2010, the Metro Board adopted the 2010 CMP for Los Angeles County. The 2010 CMP summarizes the results of 18 years of CMP highway and transit monitoring and 15 years of monitoring local growth. CMP implementation guidelines for local jurisdictions are also contained in the 2010 CMP. Elements of the CMP include Highway and Roadway System monitoring, multi-modal system performance analysis, the Transportation Demand Management Program, the Land Use Analysis Program and local conformance for all the county's jurisdictions.
Please refer to the Section 4.3 Land Use for a discussion of relevant SCAG plans and the City of Los Angeles General Plan.
City of Los Angeles 2010 Bicycle Plan 4.5 Transportation, Traffic & Safety First Year of the First Five-Year Implementation Strategy &
Figueroa Streetscape Project Draft EIR
taha 2010-068 4.5-2
EXISTING SETTING
Circulation SystemThe City of Los Angeles has an extensive network of freeways, highways, and local streets. The Los Angeles General Plan contains definitions, goals and objectives, and regulatory requirements for a variety of roadway classifications that make up the City’s roadway system. The City has five general categories of roadway classifications, including Major Class I Highway, Major Class II Highway, Secondary Highway, Collector Street, and Local Street. These roadway classifications consider the level of traffic volume, roadway capacity, and its functions. Major highways generally provide four to eight lanes of travel and have access to intersecting freeways; secondary highways typically have four travel lanes; and collector and local streets provide two travel lanes. The General Plan also recognizes Transit Priority Streets, Scenic Highways, and Non-Motorized Streets. Designations of Transit Priority Streets include Primary Transit Priority Streets, Transit Priority Streets, and Future Transit Priority Streets. Designations of Non-Motorized Streets include Class I, Class II, and Class III Bikeways, and Commuter Bikeways.
Regional Access
The City of Los Angeles includes seven freeways that crisscross the region connecting Los Angeles to its outer regions in the north-south and the east-west directions. They include Interstates (I) 5, 10, 105, 110, 210, 405, and United States Highway (US) 101. It has seven State highways (SR) 1, 2, 47, 90, 118, 170 and 187. Bicycles and pedestrians are not allowed on freeways, but are allowed on some state highways that function as arterial roads. Portions of state highways, including Pacific Coast Highway (SR-1), Santa Monica Boulevard (SR-2), Slauson Avenue (SR-90), and Venice Boulevard (SR-187), are currently designated as part of the citywide bikeway network.
Local Roadway Network
Los Angeles has over 4,300 street miles of local streets.1
The following paragraphs describe the streets included in the proposed project, including the City of Los Angeles General Plan roadway designations, lane configuration within the study area, parking availability and the average daily vehicle volumes on each street.
Most roadways are aligned on a grid system providing multiple route options for getting from place to place. Pursuant to the California Vehicle Code, bicycles are allowed on any street within the local street system. The existing citywide bicycle route network identifies a series of interconnected streets and pathways on which bicycling is encouraged.
Venice Boulevard is a Secondary/Modified Secondary Highway. Between San Vicente Boulevard and
Main Street, it is an east-west roadway. Between I-110 and Main Street was re-designated as part of the new Downtown Street Standards. This segment of Venice is a Modified Secondary Highway (approved by the City Council in 2009). In the 2010 Bicycle Plan, from Venice Beach to Central Avenue, Venice Boulevard is a part of the Backbone Bicycle Network and has a Bicycle Lane designation in the Citywide Bikeway System. Between San Vicente Boulevard and Main Street, it is an east-west roadway. Venice Boulevard has three lanes in each direction and a center left-turn lane from San Vicente Boulevard to Arlington Avenue, two lanes in each direction and left-turn pockets with flare-outs at major intersections from Arlington Avenue to Figueroa Street, and one full-time lane and one peak-period lane in each direction from Figueroa Street to Main Street. I-110 and I-10 on- and off-ramps are located near the Venice Boulevard/L.A. Live Way intersection. On-street parking is generally permitted on both sides of the street except for the segments west of Crenshaw Boulevard and the segments east of Grand Avenue. However, the northern parking lane between Crenshaw Boulevard and Figueroa Street operates as a tow-away lane during the PM peak period, and the southern parking lane between Crenshaw Boulevard and Normandie Avenue operates as a tow-away
1
lane during the AM peak period. On a typical weekday, Venice Boulevard carries approximately 15,800 to 24,000 vehicles.2
Lankershim Boulevard is a Major Class II Highway. In the 2010 Bicycle Plan, Lankershim Boulevard is a
part of the Backbone Bicycle Network and has a Bicycle Lane designation in the Citywide Bikeway System. Between Cahuenga Boulevard and Chandler Boulevard, it is a north-south roadway. Lankershim Boulevard between Cahuenga Boulevard and Chandler Boulevard has two lanes in each direction and a center left-turn lane with the exception of the segment near Universal City where width and configurations vary. A US-101 off-ramp is located near the Lankershim Boulevard/Cahuenga Street intersection. The North Hollywood and Universal City Metro stations are located at the Lankershim Boulevard/Chandler Boulevard intersection and the Lankershim Boulevard/Camp de Cahuenga intersection, respectively. On-street parking is generally permitted on both sides of the street. On a typical weekday, Lankershim Boulevard carries approximately 22,600 vehicles.
3
Cahuenga Boulevard West is a Major Class II Highway. Between Lankershim Boulevard and Pilgrimage
Bridge, it is a north-south roadway. In the 2010 Bicycle Plan, Cahuenga Boulevard West is a part of the Backbone Bicycle Network and has a Bicycle Lane designation in the Citywide Bikeway System. Cahuenga Boulevard has two lanes in each direction and a center left-turn lane north of Barham Boulevard and a single northbound lane south of Barham Boulevard. US-101 on- and off-ramps are located at the Cahuenga Boulevard West/Regal Street intersection and also near the Cahuenga Boulevard West/Bennett Drive intersection. On-street parking is generally permitted on both sides of the street except for the segments south of Barham Boulevard. On a typical weekday, Cahuenga Boulevard West carries approximately 28,000 to 34,000 vehicles.
4
Cahuenga Boulevard East is a Secondary Highway. Between Pilgrimage Bridge and Odin Street, it is a
north-south roadway. In the 2010 Bicycle Plan, Cahuenga Boulevard East is a part of the Backbone Bicycle Network and has a Bicycle Lane designation in the Citywide Bikeway System. Cahuenga Boulevard East north of Odin Street has three northbound lanes, one of which transitions to the northbound US-101 on-ramp and also permits left-turns onto Pilgrimage Bridge. The other two northbound lanes merge into a single lane north of this on-ramp and the street operates northbound only for one-way traffic. US-101 off-ramps are located at the Cahuenga Boulevard East/Lakeridge Place intersection and also near the Cahuenga Boulevard East/Odin Street intersection. On-street parking is not permitted on either side of the street. On a typical weekday, Cahuenga Boulevard East carries approximately 24,000 vehicles.5
Cesar E. Chavez Avenue is a Major Class II Highway. In the 2010 Bicycle Plan, Cesar E. Chavez Avenue
is a part of the Backbone Bicycle Network and has a Bicycle Lane designation in the Citywide Bikeway System. Between Figueroa Street and Mission Road, it is an east-west roadway. Cesar E. Chavez Avenue has two lanes in each direction. From Figueroa Street to North Broadway, a third peak-period lane exists in both directions with some discontinuity. From North Broadway to Alameda Street, a third full-time lane exists in the westbound direction. The LA Union Station is located off Cesar E. Chavez Avenue at the intersection with Union Station Driveway. On-street parking is generally permitted on both sides of the street west of Broadway outside of the AM and PM peak periods. On a typical weekday, Cesar E. Chavez Avenue carries approximately 28,600 vehicles.6
2
LADOT, Traffic Count Data website, http://ladot.lacity.org/tf_Traffic_volume_counts.htm, accessed on April 1, 2012.
3Ibid. 4
Ibid.
5
City of Los Angeles 2010 Bicycle Plan 4.5 Transportation, Traffic & Safety First Year of the First Five-Year Implementation Strategy &
Figueroa Streetscape Project Draft EIR
taha 2010-068 4.5-4
7th Street is a Secondary/Modified Secondary Highway. In the 2010 Bicycle Plan, 7th Street, from Rampart Boulevard to Soto Street is a part of the Backbone Bicycle Network and has a Bicycle Lane designation in the Citywide Bikeway System. Between Figueroa Street and Main Street, it is an east-west roadway. Between Figueroa and San Pedro it was redesignated to a Modified Secondary as part of the downtown street standards (approved by the city council in 2009). 7th Street has two lanes in each direction from Figueroa Street to Main Street. The 7th Street/Metro Center Station is located at the 7th/Flower Streets intersection. Except for the segments east of Broadway, on-street parking is generally permitted on both sides of the street outside of the AM and PM peak periods. On a typical weekday, 7th Street carries approximately 17,900 to 26,900 vehicles.7
Vermont Avenue is a Major Class II Highway and a Primary Transit Priority Street. In the 2010 Bicycle
Plan, Vermont Avenue is a part of the Backbone Bicycle Network and has a Bicycle Lane designation in the Citywide Bikeway System. Between Venice Boulevard and Wilshire Boulevard, it is a north-south roadway. Vermont Avenue has two lanes in each direction and left-turn pockets with flare-outs at major intersections, with the exception of the northbound approach to Wilshire Boulevard, which has three lanes. The Wilshire/Vermont Metro Station is located at the Wilshire Boulevard/Vermont Avenue intersection. On-street parking is generally permitted on both sides of the On-street outside of the AM and PM peak periods. On a typical weekday, Vermont Boulevard carries approximately 39,000 vehicles.8
Martin Luther King Jr. Boulevard is a Major Class II Highway and a Transit Priority Street. In the 2010
Bicycle Plan, Martin Luther King Jr. Boulevard is a part of the Backbone Bicycle Network and has a Bicycle Lane designation in the Citywide Bikeway System. Between Marlton Avenue and Figueroa Street, it is an east-west roadway. Martin Luther King Jr. Boulevard has three lanes in each direction from Marlton Avenue to Crenshaw Boulevard, two lanes in each direction from Crenshaw Boulevard to Leimert Boulevard, and two full-time lanes and a peak-period lane in each direction from Leimert Boulevard to Figueroa Street. On-street parking is generally permitted on both sides of the On-street. However, the northern parking lane between Arlington Avenue and Normandie Avenue operates as a tow-away lane during the PM peak period and the southern parking lane between Leimert Boulevard and Figueroa Street operates as a tow-away lane during the AM peak period. On a typical weekday, Martin Luther King Jr. Boulevard carries approximately 43,700 vehicles.9
North Figueroa Street is a Major Class II Highway between San Fernando Road and Marmion Way, and a
Secondary Highway between Marmion Way and Colorado Boulevard. In the 2010 Bicycle Plan, N. Figueroa Street is a part of the Backbone Bicycle Network and has a Bicycle Lane designation in the Citywide Bikeway System. Between San Fernando Road and Colorado Boulevard, it is a north-south roadway with two travel lanes in each direction and a center turn-lane. I-110 on- and off-ramps are located between N. San Fernando Road and W. Avenue 26. On-street parking is generally permitted on both sides of the street. On a typical weekday, N. Figueroa Street carries approximately 26,400 to 32,000 vehicles.10
South Figueroa Street is a Major Class II/Modified Major Class II Highway. Between 7th Street and Martin Luther King Jr. Boulevard, it is a north-south roadway. Between I-10 and 7th Street was re-designated to a Modified Major Class II Highway as part of the new downtown street standards. In the 2010 Bicycle Plan, S. Figueroa Street is a part of the Backbone Bicycle Network and has a Bicycle Lane designation in the Citywide Bikeway System. S. Figueroa Street has two full-time lanes and one peak-period lane in the southbound direction and three full-time lanes and one peak-period lane in the northbound direction from Martin Luther King Jr. Boulevard to 30th Street. From 30th Street to Figueroa Way, there are two full-time southbound lanes and three full-time lanes and one peak-period lane in the northbound direction. Also at Figueroa Way, the northbound peak-period lane is eliminated to make way for a northbound peak-period
7LADOT, Traffic Count Data website, http://ladot.lacity.org/tf_Traffic_volume_counts.htm, accessed on April 1, 2012. 8 Ibid. 9 Ibid. 10 Ibid.
bus-only lane, which is present from Figueroa Way to 7th Street. From Figueroa Way to Venice Boulevard, there is one full-time time lane and one peak-period lane in the southbound direction and three full-time lanes and one peak-period bus-only lane in the northbound direction. North of Olympic Boulevard, Figueroa Street is a one-way northbound street with three full-time lanes and a peak-period bus-only lane up to 9th Street. North of 9th Street, an additional peak-period mixed-flow lane exists on the west side of the roadway, which becomes a full time lane just north of 8th Street. On-street parking is generally permitted on both sides of the street outside of the AM and PM peak periods. On a typical weekday, S. Figueroa Street carries approximately 28,000 vehicles.11
Westwood Boulevard is a Secondary Highway. In the 2010 Bicycle Plan, Westwood Boulevard is a part of
the Backbone Bicycle Network and has a Bicycle Lane designation in the Citywide Bikeway System. Between Santa Monica Boulevard and National Boulevard, it is a north-south roadway. Westwood Boulevard has two southbound lanes and one northbound lane from National Boulevard to just south of Pico Boulevard. From just south of Pico Boulevard to Santa Monica Boulevard, there are two full-time southbound lanes, one full-time and one peak-period northbound lanes. On-street parking is generally permitted on both sides of the street. On a typical weekday, Westwood Boulevard carries approximately 26,300 to 34,100 vehicles.12
Bundy Drive is a Secondary Highway north of Pico Boulevard and a Major Class II Highway south of Pico
Boulevard. In the 2010 Bicycle Plan, Bundy Drive is a part of the Backbone Bicycle Network and has a Bicycle Lane designation in the Citywide Bikeway System. Between San Vicente Boulevard and Stanwood Drive, it is a north-south roadway with one travel lane in each direction north of Wilshire Boulevard and two travel lanes in each direction south of Wilshire Boulevard. It continues on as Centinela Avenue south of Stanwood Drive. I-10 on- and off-ramps are located between Pico Boulevard and Pearl Street. On-street parking is generally permitted on both sides of the street with some discontinuity, except for parts of the street between Olympic Boulevard and Wilshire Boulevard, where parking is prohibited from 7:00 a.m. to 7:00 p.m. On a typical weekday, Bundy Drive carries approximately 48,500 to 59,000 vehicles.13
Centinela Avenue is a Major Class II Highway. Between Stanwood Drive and Washington Place, it is a
north-south roadway with two travel lanes in each direction. In the 2010 Bicycle Plan, Centinela Avenue is a part of the Backbone Bicycle Network and has a Bicycle Lane designation in the Citywide Bikeway System. It continues on as Bundy Drive north of Stanwood Drive. On-street parking is generally permitted on both sides of the street. On a typical weekday, Centinela Avenue carries approximately 32,600 to 37,400 vehicles.14
Sepulveda Boulevard is a Major Class II Highway. In the 2010 Bicycle Plan, Sepulveda Boulevard is a part
of the Backbone Bicycle Network and has a Bicycle Lane designation in the Citywide Bikeway System. Between National Boulevard and Ohio Avenue, it is a north-south roadway with two travel lanes in each direction. On-street parking is generally permitted on both sides of the street with the exception of the west side of Sepulveda Boulevard from Santa Monica Boulevard and Pico Boulevard, where parking is prohibited. On a typical weekday, Sepulveda Boulevard carries approximately 25,600 to 29,600 vehicles.15
Avenue of the Stars is a Major Class II Highway a Scenic Highway. In the 2010 Bicycle Plan, Avenue of
the Stars is a part of the Backbone Bicycle Network and has a Bicycle Lane designation in the Citywide Bikeway System. Between Santa Monica Boulevard and Pico Boulevard, it is a north-south roadway with three travel lanes in each direction, and a wide landscaped median with center left-turn lanes. On-street parking is not permitted on either side of the street.
11
LADOT, Traffic Count Data website, http://ladot.lacity.org/tf_Traffic_volume_counts.htm, accessed on April 1, 2012.
12Ibid. 13
Ibid.
14
City of Los Angeles 2010 Bicycle Plan 4.5 Transportation, Traffic & Safety First Year of the First Five-Year Implementation Strategy &
Figueroa Streetscape Project Draft EIR
taha 2010-068 4.5-6
Colorado Boulevard is a Major Class II Highway and a Scenic Highway. In the 2010 Bicycle Plan,
Colorado Boulevard is a part of the Backbone Bicycle Network and has a Bicycle Lane designation in the Citywide Bikeway System. Between Lincoln Avenue and Avenue 64, it is an east-west roadway. Colorado Boulevard has two lanes in each direction and a center left-turn lane from Lincoln Avenue to Broadway, three lanes in each direction and a center left-turn lane from Broadway to Dahlia Drive, and two lanes in each direction and a center left-turn lane from Dahlia Drive to Avenue 64. SR-2 on- and off-ramps are located between Lincoln Avenue and Broadway. On-street parking is generally permitted on both sides of the street between Sierra Villa Drive and SR-2. On a typical weekday, Colorado Boulevard carries approximately 34,000 vehicles.16
Woodley Avenue is a Major Class II Highway. In the 2010 Bicycle Plan, Woodley Avenue is a part of the
Neighborhood Bicycle Network and has a Bicycle Lane designation in the Citywide Bikeway System. Between Stagg Street and Chase Street, it is a north-south roadway with two travel lanes in each direction with left-turn pockets, except for the segment between Roscoe Boulevard and Raymer Street which has three travel lanes in each direction. Typically on-street parking is not permitted on either side of the street. On a typical weekday, Woodley Avenue carries approximately 30,900 vehicles.17
Devonshire Street is a Major Class II Highway and a Future Transit Priority Street. In the 2010 Bicycle
Plan, Devonshire Street is a part of the Backbone Bicycle Network and has a Bicycle Lane designation in the Citywide Bikeway System. Between Haskell Avenue and Sepulveda Boulevard, it is an east-west roadway with three travel lanes in each direction and left-turn pockets. On-street parking is permitted on both sides of the street west of I-405 southbound ramps; however, the western parking lane operates as a tow-away lane during the PM peak period and the eastern parking lane operates as a tow-away lane during the AM peak period. On a typical weekday, Devonshire Street carries approximately 28,300 vehicles.18
2nd Street is a Secondary/Modified Secondary Highway/Modified Collector Street. In the 2010 Bicycle
Plan, 2nd Street is a part of the Backbone Bicycle Network and has a Bicycle Lane designation in the Citywide Bikeway System. Between Beverly Boulevard and Broadway, it is an east-west roadway with two travel lanes in each direction except for the eastbound segment between Hill Street and Broadway where one of the lanes is a travel lane only in the peak-periods, with parking permitted outside of the AM and PM peak periods. The segment between Alameda and Los Angeles Street was redesignated to a Modified Collector Street; and between Los Angeles Street and Figueroa it was redesignated to a Modified Secondary Highway. The segment between Figueroa Street and Hill Street is grade-separated through a tunnel. On-street parking is generally permitted on both sides of the street north of Figueroa Street.
Grand Avenue is a Major Class II Highway. In the 2010 Bicycle Plan, Grand Avenue is a part of the
Backbone Bicycle Network and has a Bicycle Lane designation in the Citywide Bikeway System. Between Washington Boulevard and 30th Street, it is a north-south roadway. Grand Avenue has two travel lanes in each direction with a center left-turn lane from 30th Street and only one northbound lane from Adams Boulevard to Washington Boulevard. On-street parking is generally permitted on both sides of the street except for the west side of the street between 30th Street and Adams Boulevard. On a typical weekday, Grand Avenue carries approximately 14,800 vehicles.19
Virgil Avenue is a Secondary Highway. Between Santa Monica Boulevard and Melrose Avenue, it is a
north-south roadway with two travel lanes in each direction. In the 2010 Bicycle Plan, Virgil Avenue is a part of the Backbone Bicycle Network and has a Bicycle Lane designation in the Citywide Bikeway System. On-street parking is generally permitted on both sides of the street except for the PM peak period. On a typical weekday, Virgil Avenue carries approximately 37,000 vehicles.20
16
LADOT, Traffic Count Data website, http://ladot.lacity.org/tf_Traffic_volume_counts.htm, accessed on April 1, 2012.
17Ibid. 18 Ibid. 19 Ibid. 20 Ibid.
Level of Service Methodology
In order to quantify traffic delays along study streets, study intersections were identified within each study area where reduction of travel lanes along the street would likely result in significant traffic impacts. These intersections were evaluated using the 2010 Highway Capacity Manual operations methodology, which determines the capacity for each lane group approaching the intersection. The level of service (LOS) is then based on the average stopped delay per vehicle (seconds per vehicle) for the various movements within the intersection. LOS is a qualitative measure used to describe the condition of traffic flow, ranging from excellent conditions at LOS A to overloaded conditions at LOS F. LOS D is recognized as the minimum acceptable level of service in the City of Los Angeles. Table 4.5-1 defines each level of service.
TABLE 4.5-1: LEVEL OF SERVICE DEFINITIONS FOR SIGNALIZED INTERSECTIONS
LOS Average Vehicle Delay (sec) Definition
A <10.0 EXCELLENT. No vehicle waits longer than one red light and no approach
phase is fully used
B >10.0 and <20.0 VERY GOOD. An occasional approach phase is fully utilized; many drivers begin to feel somewhat restricted within groups of vehicles.
C >20.0 and <35.0 GOOD. Occasionally drivers may have to wait through more than one red light; backups may develop behind turning vehicles.
D >35.0 and <55.0 FAIR. Delays may be substantial during portions of the rush hours, but enough lower volume periods occur to permit clearing of developing lines, preventing excessive backups.
E >55.0 and <80.0 POOR. Represents the most vehicles intersection approaches can accommodate; may be long lines of waiting vehicles through several signal cycles.
F >80.0 FAILURE. Backups from nearby locations or on cross streets may restrict or
prevent movement of vehicles out of the intersection approaches. Tremendous delays with continuously increasing queue lengths.
A total of 99 signalized intersections were analyzed. Most intersections include proposed bikeway improvements along the study street only, however, there are four intersections where bike improvements are proposed for both north-south and east-west approaches. For these four intersections, intersection LOS analysis assumes bike improvements on both streets are implemented. The intersections were analyzed for the peak 60-minute period during the weekday AM (7:00 a.m. to 10:00 a.m.) and PM (3:00 p.m. to 6:00 p.m.) peak periods to calculate the greatest impact at each study intersection.21 No additional growth factor has been applied to the existing traffic turning movement counts since the proposed project would be implemented immediately.22
21
LADOT conducted intersection LOS analysis using a SYNCHRO 7 model, which is based on the 2010 Highway Capacity Manual, but has a capability to analyze the study intersections as a system for the entire roadway network. Traffic-turning movement counts were collected on Tuesday, March 20, 2012, during the AM and PM peak periods at 51 of 105 study intersections. Traffic data for the remaining 54 intersections were based on counts previously collected for LADOT between 2008 and 2011. Due to the economic recession and subsequent period of sustained low growth, using the data collected during this period for these 54 intersections is anticipated to represent a conservative approach.
22
City of Los Angeles 2010 Bicycle Plan 4.5 Transportation, Traffic & Safety First Year of the First Five-Year Implementation Strategy &
Figueroa Streetscape Project Draft EIR
taha 2010-068 4.5-8
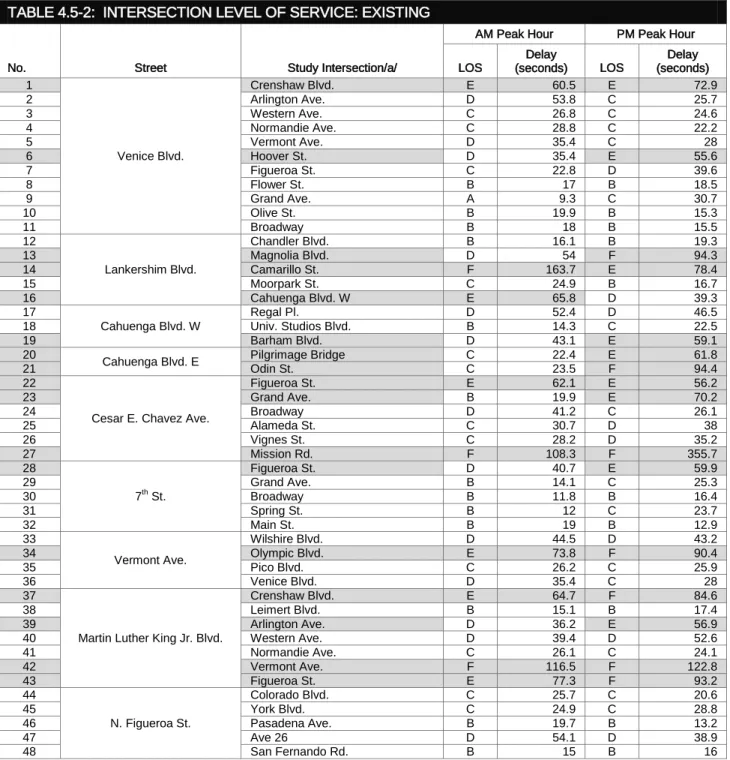
Table 4.5-2 presents the existing LOS and average delay (in seconds) data for the study intersections. It is noted that the delay represents the sum of delays from all directions of travel including the direction of the study street and cross traffic. The results indicate that, of the 99 study intersections, 79 intersections currently operate at LOS D or better in the AM peak hour and 69 intersections operate at LOS D or better in the PM peak hour. In the AM peak hour, nine intersections operate at LOS E and eleven operate at LOS F. In the PM peak hour, these numbers increase to 14 intersections operating at LOS E and 16 operating at LOS F. Intersections operating at LOS E or F are shaded.
TABLE 4.5-2: INTERSECTION LEVEL OF SERVICE: EXISTING
No. Street Study Intersection/a/
AM Peak Hour PM Peak Hour
LOS Delay (seconds) LOS Delay (seconds) 1 Venice Blvd. Crenshaw Blvd. E 60.5 E 72.9 2 Arlington Ave. D 53.8 C 25.7 3 Western Ave. C 26.8 C 24.6 4 Normandie Ave. C 28.8 C 22.2 5 Vermont Ave. D 35.4 C 28 6 Hoover St. D 35.4 E 55.6 7 Figueroa St. C 22.8 D 39.6 8 Flower St. B 17 B 18.5 9 Grand Ave. A 9.3 C 30.7 10 Olive St. B 19.9 B 15.3 11 Broadway B 18 B 15.5 12 Lankershim Blvd. Chandler Blvd. B 16.1 B 19.3 13 Magnolia Blvd. D 54 F 94.3 14 Camarillo St. F 163.7 E 78.4 15 Moorpark St. C 24.9 B 16.7 16 Cahuenga Blvd. W E 65.8 D 39.3 17 Cahuenga Blvd. W Regal Pl. D 52.4 D 46.5 18 Univ. Studios Blvd. B 14.3 C 22.5 19 Barham Blvd. D 43.1 E 59.1 20
Cahuenga Blvd. E Pilgrimage Bridge C 22.4 E 61.8
21 Odin St. C 23.5 F 94.4
22
Cesar E. Chavez Ave.
Figueroa St. E 62.1 E 56.2 23 Grand Ave. B 19.9 E 70.2 24 Broadway D 41.2 C 26.1 25 Alameda St. C 30.7 D 38 26 Vignes St. C 28.2 D 35.2 27 Mission Rd. F 108.3 F 355.7 28 7th St. Figueroa St. D 40.7 E 59.9 29 Grand Ave. B 14.1 C 25.3 30 Broadway B 11.8 B 16.4 31 Spring St. B 12 C 23.7 32 Main St. B 19 B 12.9 33 Vermont Ave. Wilshire Blvd. D 44.5 D 43.2 34 Olympic Blvd. E 73.8 F 90.4 35 Pico Blvd. C 26.2 C 25.9 36 Venice Blvd. D 35.4 C 28 37
Martin Luther King Jr. Blvd.
Crenshaw Blvd. E 64.7 F 84.6 38 Leimert Blvd. B 15.1 B 17.4 39 Arlington Ave. D 36.2 E 56.9 40 Western Ave. D 39.4 D 52.6 41 Normandie Ave. C 26.1 C 24.1 42 Vermont Ave. F 116.5 F 122.8 43 Figueroa St. E 77.3 F 93.2 44 N. Figueroa St. Colorado Blvd. C 25.7 C 20.6 45 York Blvd. C 24.9 C 28.8 46 Pasadena Ave. B 19.7 B 13.2 47 Ave 26 D 54.1 D 38.9 48 San Fernando Rd. B 15 B 16
TABLE 4.5-2: INTERSECTION LEVEL OF SERVICE: EXISTING
No. Street Study Intersection/a/
AM Peak Hour PM Peak Hour
LOS Delay (seconds) LOS Delay (seconds) 49 S. Figueroa St. 8th St. C 25.6 F 135.3 50 Olympic Blvd. C 27 C 21.3 51 Pico Blvd. B 17.5 B 18.8 52 Venice Blvd. C 22.8 D 39.6 53 18th St. B 11.1 A 9.4 54 Washington Blvd. F 142.2 E 66.7 55 23rd St. B 14.2 B 15.6 56 Adams Blvd. C 32.4 D 38.6 57 Jefferson Blvd. D 43.7 D 38.9 58 Exposition Blvd. C 30.3 D 38.8
59 Martin Luther King Jr. Blvd. E 77.3 F 93.2
60 Westwood Blvd. Santa Monica Blvd. F 120.3 E 77.6 61 Olympic Blvd. F 104 E 62.4 62 Pico Blvd. E 55.8 F 90 63 National Blvd. D 47 D 35.8 64 Bundy Dr. Wilshire Blvd. C 34.9 D 42.6 65 Santa Monica Blvd. C 20.7 C 26.7 66 Olympic Blvd. F 97.8 F 80.1 67 Pico Blvd. D 54.4 E 76.2
68 I-10 E/B On-Ramp B 20.3 C 23.8
69 Ocean Park Blvd. F 110.1 F 186.6 70 National Blvd. F 80.8 C 29 71 Centinela Ave. Palms Blvd. D 50.4 D 43.9 72 Venice Blvd. F 112.8 F 161.4 73 Washington Pl. C 31.7 D 36.4 74 Sepulveda Blvd. Ohio Ave. C 30.3 D 39.5 75 Santa Monica Blvd. E 64.1 D 52.8 76 Olympic Blvd. D 40.9 D 42.2 77 Pico Blvd. E 79.1 E 70.8 78 National Blvd. D 39.8 D 50.3 79
Ave. of the Stars
Santa Monica Blvd. D 44.2 C 32.2 80 Constellation Blvd. C 30.5 C 27.3 81 Olympic Blvd. (WB) B 12.5 B 10.3 82 Olympic Blvd. (EB) B 17.4 B 19.3 83 Pico Blvd. C 33.4 B 18.3 84 Colorado Blvd. SR-2 NB Ramps B 17.2 B 16.7 85 Broadway B 13.2 B 17.1 86 Sierra Villa Dr. C 29.4 F 246.6 87 Eagle Rock Blvd. D 37 F 264.4 88 SR-134 Ramps C 23.3 B 14.7 89 N. Figueroa St. C 25.7 C 20.6
90 Woodley Ave. Roscoe Blvd. F 117.1 F 175.6
91 Devonshire St. I-405 SB Ramps C 30.8 B 16.5 92 I-405 NB Ramps B 11.6 B 11.1 93 Sepulveda Blvd. D 51.8 F 106.1 94 2nd St. Beverly Blvd./Glendale Blvd. D 41.8 D 48.3 95 Beaudry Ave. B 17.8 D 42.1 96 Figueroa St. B 17.7 D 37.6 97 Hill St. B 19.3 C 27.1 98 Broadway B 16.1 B 19.3 99 Grand Ave. Washington Blvd. C 25.3 C 28.9 100 Adams Blvd. B 16.9 C 21.9 101 30th St. B 11.7 A 9.7 102
Virgil Ave. Santa Monica Blvd. C 23.7 B 18.6
103 Melrose Ave. B 19.4 B 16.7
/a/Includes four duplicate study intersections where a study street meets another study street. They include the following intersections: Venice Blvd./ Vermont Ave., Venice Blvd./Figueroa St., Martin Luther King Jr. Blvd./Figueroa St., and Figueroa St./Colorado Blvd.
City of Los Angeles 2010 Bicycle Plan 4.5 Transportation, Traffic & Safety First Year of the First Five-Year Implementation Strategy &
Figueroa Streetscape Project Draft EIR
taha 2010-068 4.5-10
Congestion Management Plan
The Los Angeles Metropolitan Transportation Authority (Metro) updates the Congestion Management Program (CMP) biannually to meet the requirements of Section 65089 of the California Government Code. As required by statute, Los Angeles County’s CMP evaluates and monitors the performance of highways, roadways, and its multimodal system. The CMP establishes the LOS to measure congestion on the highways and roadways. The LOS standard in Los Angeles County is LOS E, except where base year LOS is worse than E. In such cases, the base year LOS is the standard. A 1992 base year has been established for Los Angeles.
There are three CMP monitoring intersections that overlap with the study intersections. They are the intersections of Westwood Boulevard/Santa Monica Boulevard (#60), Bundy Drive/Santa Monica Boulevard (#65), and Centinela Avenue/Venice Boulevard (#72).
Emergency Access
California state law requires that drivers yield the right-of-way to emergency vehicles and remain stopped until the emergency vehicles have passed. Generally, multi-lane arterial roadways allow the emergency vehicles to travel at higher speeds and permit other traffic to maneuver out of the path of the emergency vehicle.
Los Angeles Fire Department in collaboration with the LADOT has developed a Fire Preemption System (FPS), a system that automatically turns traffic lights to green for emergency vehicles travelling on designated streets in the City. Among the study streets, portions of Vermont Avenue, Sepulveda Boulevard, Cesar E. Chavez Avenue, and Martin Luther King Jr. Boulevard currently have FPS.23
Public Transit
The study areas are served by multiple transit operators, with routes connecting different communities within and outside of the City of Los Angeles. The primary transit operator in the City is Metro. Metro provides bus, light rail and subway services within the Los Angeles County. In addition, the LADOT operates local and commuter bus routes, which mainly connect the downtown area and the remaining parts of the City. There are also several regional rail and municipal bus operators which provide regional transit services between the City of Los Angeles and municipalities in the outer region.
Los Angeles County Metropolitan Transportation Authority (Metro). The Metro provides bus, light rail
and subway services within the Los Angeles County. There are six Metro light rail lines (i.e., Blue, Red, Green, Gold, Purple, and Expo) and two subway lines (i.e., Orange and Silver) operating in exclusive right-of-ways. During the weekday PM peak period, headways are generally 5 to 10 minutes for each line. Bicycles are allowed in designated areas on Metro trains at no extra charge at all times. Metro also operates approximately 180 bus routes in mixed traffic. These bus services vary considerably in speed, frequency and capacity. Most buses are equipped with two bicycle racks at the front of the bus, and bicyclists are allowed to load their bicycles on the rack when there is space available at no extra charge. If the rack is full, bicyclists are asked to wait for the next bus.
Los Angeles Department of Transportation (LADOT). LADOT provides local and commuter express bus
services in the City. The Downtown Area Short Hop (DASH) operates 32 local routes covering Downtown Los Angeles and many outlying communities within the City. The Commuter Express operates 14 routes making a limited number of stops and transporting passengers between Downtown Los Angeles and other major centers within the City. All Commuter Express routes except for one operate during the peak hours only in the peak direction. Most buses are equipped with two bicycle racks at the front of the bus, and bicyclists are allowed to load their bicycles on the rack when there is space available at no extra charge. If the rack is full, bicyclists are asked to wait for the next bus.
23
Training Bulletin: Traffic Signal Preemption System for Emergency Vehicles, Los Angeles Fire Department, Bulletin No. 133, October, 2008.
Other Transit Operators. There are several other transit operators that provide transit services between the City of Los Angeles and outlying cities. These transit operators include Santa Monica Municipal Bus Lines (Big Blue Bus); Culver City Transit; Orange County Transportation Authority (OCTA); Riverside Transit Agency; OmniTrans, which serves the San Bernardino Valley; Santa Clarita Transit; Gardena Transit; Torrance Transit; and Montebello Bus Lines.
In addition, commuter rail services to Downtown are primarily provided by Metrolink and Amtrak. Metrolink covers six counties (Los Angeles County, Orange County, San Diego County, Riverside County, San Bernardino County and Ventura County) in Southern California. Amtrak also serves communities along the coast in Southern California. Most passengers on Metrolink and Amtrak arrive at Union Station, from which connecting services to their destinations are provided by Metro. Bikes are allowed on all Metrolink trains at all times with a capacity of up to three bikes per car. As part of its green initiative program, Metrolink also added special bike cars which could accommodate up to 18 bikes per car on select trains. Amtrak generally allows bikes onboard for free on select routes including Pacific Surfliner.
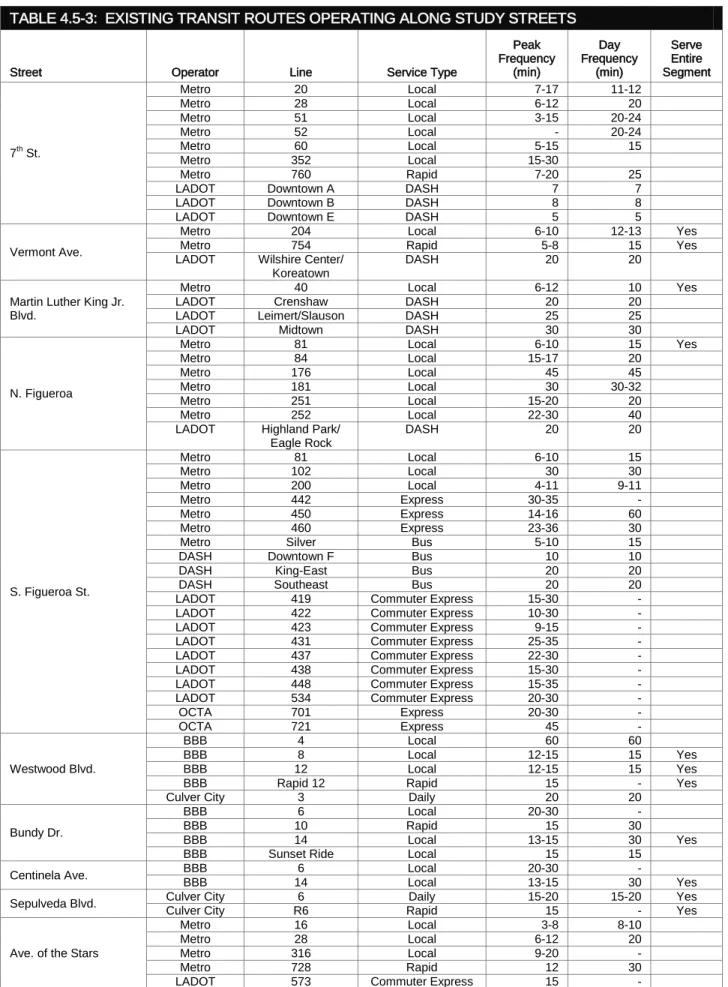
Major bus routes operating in each study area are summarized in Table 4.5-3. Almost all streets are served by transit routes, except for 2nd Street and Virgil Avenue, and have one or more bus routes operating along the entire study area. The streets most heavily served by transit are Cesar E. Chavez Avenue, 7th Street, and S. Figueroa Street with more than ten bus routes operating in each street.
TABLE 4.5-3: EXISTING TRANSIT ROUTES OPERATING ALONG STUDY STREETS
Street Operator Line Service Type
Peak Frequency (min) Day Frequency (min) Serve Entire Segment Venice Blvd. Metro 2 Local 6-10 10-12 Metro 4 Local 9-12 15
Metro 33 Local 7-15 15-20 Yes
Metro 70 Local 10-12 15
Metro 71 Local 15-35 35
Metro 733 Rapid 8-15 20 Yes
Metro 770 Rapid 10-13 15
Lankershim Blvd.
Metro 152 Local 8-20 23-24
Metro 183 Local 30-60 60
Metro 224 Local 10-12 20-40 Yes
LADOT 549 Commuter Express 20-35 -
Cahuenga Blvd. W Metro 156 Local 25-50 50 Yes
Metro 222 Local 25-40 50-60
Cahuenga Blvd. E Metro 222 Local 25-40 50-60 Yes
Cesar E. Chavez Ave.
Metro 2 Local 6-10 10-12 Metro 4 Local 9-12 15 Metro 40 Local 6-12 10 Metro 55 Local 4-15 20 Metro 60 Local 5-15 15 Metro 68 Local 15-17 20 Metro 70 Local 10-12 15 Metro 71 Local 15-35 35 Metro 78 Local 6-20 14-28 Metro 79 Local 15-30 40-45 Metro 302 Local 7-20 - Metro 355 Local 8-18 - Metro 378 Local 11-28 - Metro 442 Express 30-35 - Metro 704 Rapid 10-15 20 Metro 728 Rapid 12 30 Metro 733 Rapid 8-15 20 Metro 745 Rapid 4-10 20 Metro 770 Rapid 10-13 15
LADOT Lincoln Heights/ Chinatown
DASH 30 30
City of Los Angeles 2010 Bicycle Plan 4.5 Transportation, Traffic & Safety First Year of the First Five-Year Implementation Strategy &
Figueroa Streetscape Project Draft EIR
taha 2010-068 4.5-12
TABLE 4.5-3: EXISTING TRANSIT ROUTES OPERATING ALONG STUDY STREETS
Street Operator Line Service Type
Peak Frequency (min) Day Frequency (min) Serve Entire Segment 7th St. Metro 20 Local 7-17 11-12 Metro 28 Local 6-12 20 Metro 51 Local 3-15 20-24 Metro 52 Local - 20-24 Metro 60 Local 5-15 15 Metro 352 Local 15-30 Metro 760 Rapid 7-20 25
LADOT Downtown A DASH 7 7
LADOT Downtown B DASH 8 8
LADOT Downtown E DASH 5 5
Vermont Ave.
Metro 204 Local 6-10 12-13 Yes
Metro 754 Rapid 5-8 15 Yes
LADOT Wilshire Center/ Koreatown
DASH 20 20
Martin Luther King Jr. Blvd.
Metro 40 Local 6-12 10 Yes
LADOT Crenshaw DASH 20 20
LADOT Leimert/Slauson DASH 25 25
LADOT Midtown DASH 30 30
N. Figueroa
Metro 81 Local 6-10 15 Yes
Metro 84 Local 15-17 20
Metro 176 Local 45 45
Metro 181 Local 30 30-32
Metro 251 Local 15-20 20
Metro 252 Local 22-30 40
LADOT Highland Park/ Eagle Rock DASH 20 20 S. Figueroa St. Metro 81 Local 6-10 15 Metro 102 Local 30 30 Metro 200 Local 4-11 9-11 Metro 442 Express 30-35 - Metro 450 Express 14-16 60 Metro 460 Express 23-36 30
Metro Silver Bus 5-10 15
DASH Downtown F Bus 10 10
DASH King-East Bus 20 20
DASH Southeast Bus 20 20
LADOT 419 Commuter Express 15-30 - LADOT 422 Commuter Express 10-30 - LADOT 423 Commuter Express 9-15 - LADOT 431 Commuter Express 25-35 - LADOT 437 Commuter Express 22-30 - LADOT 438 Commuter Express 15-30 - LADOT 448 Commuter Express 15-35 - LADOT 534 Commuter Express 20-30 -
OCTA 701 Express 20-30 - OCTA 721 Express 45 - Westwood Blvd. BBB 4 Local 60 60 BBB 8 Local 12-15 15 Yes BBB 12 Local 12-15 15 Yes
BBB Rapid 12 Rapid 15 - Yes
Culver City 3 Daily 20 20
Bundy Dr.
BBB 6 Local 20-30 -
BBB 10 Rapid 15 30
BBB 14 Local 13-15 30 Yes
BBB Sunset Ride Local 15 15
Centinela Ave. BBB 6 Local 20-30 -
BBB 14 Local 13-15 30 Yes
Sepulveda Blvd. Culver City 6 Daily 15-20 15-20 Yes
Culver City R6 Rapid 15 - Yes
Ave. of the Stars
Metro 16 Local 3-8 8-10
Metro 28 Local 6-12 20
Metro 316 Local 9-20 -
Metro 728 Rapid 12 30
TABLE 4.5-3: EXISTING TRANSIT ROUTES OPERATING ALONG STUDY STREETS
Street Operator Line Service Type
Peak Frequency (min) Day Frequency (min) Serve Entire Segment Colorado Blvd.
Metro 81 Local 6-10 15 Yes
Metro 84 Local 15-17 20
Metro 180 Local 30 30-32
Metro 181 Local 30 30-32
Metro 780 Rapid 10-15 22-25
LADOT Highland Park/ Eagle Rock
DASH 20 20
Woodley Metro 237 Local 60 60 Yes
Devonshire St. Metro 158 Local 20-50 60-67 Yes
2nd St. NO SERVICE
Grand Ave.
Metro 37 Local 4-10 15
Metro 38 Local 8-24 24 Yes
Metro 55 Local 4-15 20
Metro 355 Local 8-18 -
Metro 603 Shuttle 8-15 15-20
Virgil Ave. NO SERVICE
SOURCE: CHS Consulting Group, 2012; Metro, LADOT, Santa Monica Big Blue Bus, Culver City, OCTA, 2012.
Bicycle Facilities
Bikeways are typically classified as Class I, Class II, or Class III facilities. Class I Bikeways provide a completely separated right-of-way for the exclusive use of bicycles and pedestrians and are typically not located within a roadway area. Class II Bikeways are bike lanes striped within the paved areas of roadways and established for one-way bike travel on a street or highway. Class III Bikeways are signed bike routes that allow bicycles to share streets with pedestrians or motor vehicle traffic. Class III Bikeways may also include Shared Lane Markings also known as sharrows. In addition, the bicycle facilities include the use of bicycle-transit-only lanes where bicycle use is allowed on surface street bus-only lanes as permitted by California Vehicle Code (CVC) 21202. The 2010 Bicycle Plan establishes a policy to work with Metro to develop both full-time and peak period bus/bike-only lane standards to accommodate bicycles and install appropriate signage and on-street markings. In addition, there are separated bicycle lanes that are within the existing roadbed positioned between a curb and a parking lane which provide an additional level of protection from travel lanes. Currently, the City has approximately 403.9 miles of bikeways, including 55.4 miles of Class I facilities, 240.1 miles of Class II facilities, and 108.4 miles of Class III facilities (and of those 29.6 miles have sharrows).24
Bicycle parking is provided both within the public right-of-ways and in private developments. The LADOT installs bicycle racks in public right-of-ways to encourage bicycling to shopping and commercial areas, city buildings and libraries. There are over 3,600 inverted-U racks provided by LADOT through the sidewalk bicycle-parking program. In addition, the City’s Planning Department mandates the provision of off-street bicycle parking spaces in private developments per Los Angeles Municipal Code Sections 12.21.
The proposed bike lanes would create a comprehensive network of citywide bikeways by filling in the gaps and connecting the proposed bike lanes in this EIR with the existing bike lanes. Figure 4.5-1 shows the location of proposed bike lanes in relation to the existing bike lanes, as well as areas with high rate of bike collisions. It shows that the areas with higher accident rates tend to be concentrated in the Central and South Los Angeles, as well as parts of the West Los Angeles near Santa Monica and the Northridge areas. They are mostly highly urbanized areas in the City with a large volume of motorists, pedestrians and bicyclists on the roadway. These areas are partially served by bike facilities today. The existing bike facilities in the vicinity of the study areas are described below.
SOURCE: SWIRTS, LADOT Bike Program, 2012.
CITY OF LOS ANGELES DEPARTMENT OF CITY PLANNING
First Year of the First Five-Year Implementation Strategy &
Figueroa Streetscape Project Environmental Impact Report
FIGURE 4.5-1
SAFETY HOTSPOT ANALYSIS
taha 2011-068LEGEND:
Bicycle Collisions/Square Mile Weighted by Severity
Existing Bike Lanes Existing Bike Paths
Highest Density & Severity
Lowest Density & Severity EIR Proposed Bike Lanes
Approx. Scale N N Miles 0 4.5 9.0
Venice Boulevard – There are bike lanes along Venice Boulevard from near its western terminus in Venice Beach to Crenshaw Boulevard. The study segment would extend these bike lanes east to Main Street. This extension would facilitate connections with the existing bike lanes on Hoover Street and Main Street and the proposed bike lanes on Vermont Avenue and Figueroa Street.
Lankershim Boulevard – There are no bike lanes along Lankershim Boulevard today. The proposed bike
lanes along Lankershim Boulevard would connect with the existing bike lanes on Chandler Boulevard and the proposed bike lanes on Cahuenga Boulevard West.
Cahuenga Boulevard West – There are no bike lanes along Cahuenga Boulevard West today. The proposed
bike lanes along Cahuenga Boulevard West would connect with the proposed bike lanes on Lankershim Boulevard.
Cahuenga Boulevard East – There are bike lanes along Cahuenga Boulevard East from Odin Street to
Yucca Street. The proposed bike lanes would extend these lanes north to Pilgrimage Bridge.
Cesar E. Chavez Avenue – There are no bike lanes along Cesar E. Chavez Avenue today. The proposed
bike lanes along Cesar E. Chavez Avenue would connect with the existing bike lanes on North Spring Street and North Main Street.
7th Street – There are bike lanes along 7th Street from Catalina Street to Figueroa Street. The proposed bike lanes would extend the existing bike lanes and connect with the existing bike lanes on Spring Street and Main Street.
Vermont Avenue – There are no bike lanes along Vermont Avenue today. The proposed bike lanes along
Vermont Avenue would connect with the existing bike lanes on 7th Street and the proposed bike lanes on Venice Boulevard.
Martin Luther King Jr. Boulevard – There are bike lanes along Martin Luther King Jr. Boulevard from
Rodeo Road to Marlton Avenue. The proposed bike lanes would extend these bike lanes and connect with the proposed bike lanes on Figueroa Street.
N. Figueroa Street – There are no bike lanes along N. Figueroa Street today. The proposed bike lanes along N. Figueroa Street would connect with the Los Angeles River Bike Path (under construction) and the proposed bike lanes on Colorado Boulevard.
S. Figueroa Street – There are no bike lanes along S. Figueroa Street today. The proposed bike lanes on S. Figueroa Street would connect to the proposed bike lanes on Martin Luther King Jr. Boulevard, Venice Boulevard, 11th Street, and 7th Street.
Westwood Boulevard – There are no bike lanes along Westwood Boulevard today. The proposed bike lanes
would extend the existing bike lanes on Westwood Boulevard north of Santa Monica Boulevard and connect with the existing bike lanes on National Place and Santa Monica Boulevard.
Bundy Drive – There are no bike lanes along Bundy Drive today. The proposed bike lanes would connect
with the existing bike lanes on San Vicente Boulevard.
Sepulveda Boulevard – There are bike lanes along Sepulveda Boulevard from Venice Boulevard to
National Boulevard. The proposed bike lanes would extend these bike lanes north and connect with the existing bike lanes on Santa Monica Boulevard.
Avenue of the Stars – There are no bike lanes along Avenue of the Stars today. The proposed bike lanes
City of Los Angeles 2010 Bicycle Plan 4.5 Transportation, Traffic & Safety First Year of the First Five-Year Implementation Strategy &
Figueroa Streetscape Project Draft EIR
taha 2010-068 4.5-16
Colorado Boulevard – There are no bike lanes along Colorado Boulevard today. The proposed bike lanes
would connect with the proposed bike lanes on N. Figueroa Street.
Woodley Avenue – There are bike lanes along Woodley Avenue from Victory Boulevard to Rinaldi Street,
with the exception of the study segment. The proposed bike lanes would close this gap and provide continuous bike lanes from Victory Boulevard to Rinaldi Street.
Devonshire Street – There are bike lanes along Devonshire Street from Topanga Canyon Boulevard to
Woodman Avenue, with the exception of the study segment. The proposed bike lanes would close this gap and provide continuous bike lanes from Topanga Canyon Boulevard to Woodman Avenue.
Pedestrian Facilities
In Los Angeles County, approximately 14 percent of trips are made by walking and all transit trips require a pedestrian link.25
THRESHOLDS OF SIGNIFICANCE
Although the majority of streets in Los Angeles are known as auto-oriented, there are several pockets of commercial and neighborhood activity centers that are characterized by ground floor retail and service uses oriented to pedestrians along the sidewalk. The City of Los Angeles General Plan designates such areas as Pedestrian Priority Street segments. In general, sidewalks are 10 to 12 feet wide. Pedestrian Priority Street segments are recommended to have wider sidewalks of 15 to 17 feet in width and other pedestrian friendly features such as curb side parking, wide crosswalks with the minimum width of 15 feet, and traffic signal modifications to ensure longer pedestrian crossing times, where warranted.
In accordance with Appendix G of the State CEQA Guidelines, the proposed project would have a significant impact related to transportation and traffic if it would:
• Conflict with an applicable plan, ordinance or policy establishing measures of effectiveness for the performance of the circulation system, taking into account all modes of transportation including mass transit and non-motorized travel and relevant components of the circulation system, including but not limited to intersections, streets, highways and freeways, pedestrian and bicycle paths, and mass transit;
• Conflict with an applicable congestion management program, including, but not limited to level of service standards and travel demand measures, or other standards established by the county congestion management agency for designated roads or highways;
• Result in inadequate emergency access; and/or
• Conflict with adopted policies, plans, or programs regarding public transit, bicycle, or pedestrian facilities, or otherwise decrease the performance or safety of such facilities.
This section discusses potential transportation-related impacts for each of the above significance thresholds. Significant traffic impacts generated by the proposed project are identified by comparing the LOS of the Existing Plus Project condition to the No Project condition. In accordance with the LADOT’s Traffic Study Policies and Procedures, traffic circulation impacts are evaluated based on the additional average vehicle delay that a proposed project could cause. Table 4.5-4 presents the applicable thresholds for this evaluation. For example, a project is considered to have a significant impact at an intersection with existing LOS C if it adds 6.0 or more seconds of delay. If an intersection continues to operate at LOS A or B after implementation of a project, then it is considered to have no substantial adverse impact on that intersection.
25
TABLE 4.5-4: INTERSECTION SIGNIFICANCE THRESHOLDS
Final Intersection LOS with Project Change in Delay (in seconds) from the Existing Condition
LOS A ---- LOS B ---- LOS C 6.0 LOS D 4.0 LOS E 2.5 LOS F 2.5 SOURCE: LADOT, 2012. Approach to Analysis
The transportation impact analysis was conducted for the “Existing Plus Project” and a “Future Cumulative (2035)” conditions. The “Existing Plus Project” condition was analyzed by assuming the proposed project is implemented on the existing transportation conditions. The impact analysis does not take into account anticipated potential decreases in traffic caused by shifting to alternative transportation modes such as increased bicycling as bicycle and pedestrian routes become more convenient, safer, and user friendly. Year 2035 was selected as the future cumulative analysis year because the Southern California Association of Governments (SCAG)’s Regional Travel Demand Model provides traffic forecasts for cumulative development and growth through the year 2035. The SCAG’s travel demand model considers increases in population and employment anticipated to occur between now and 2035 to forecast future year 2035 traffic volumes. The SCAG data conservatively (for traffic impacts) assumes only modest share of bicycle trips with approximately1.5 percent to 2 percent of total trips by bicycle.
IMPACTS
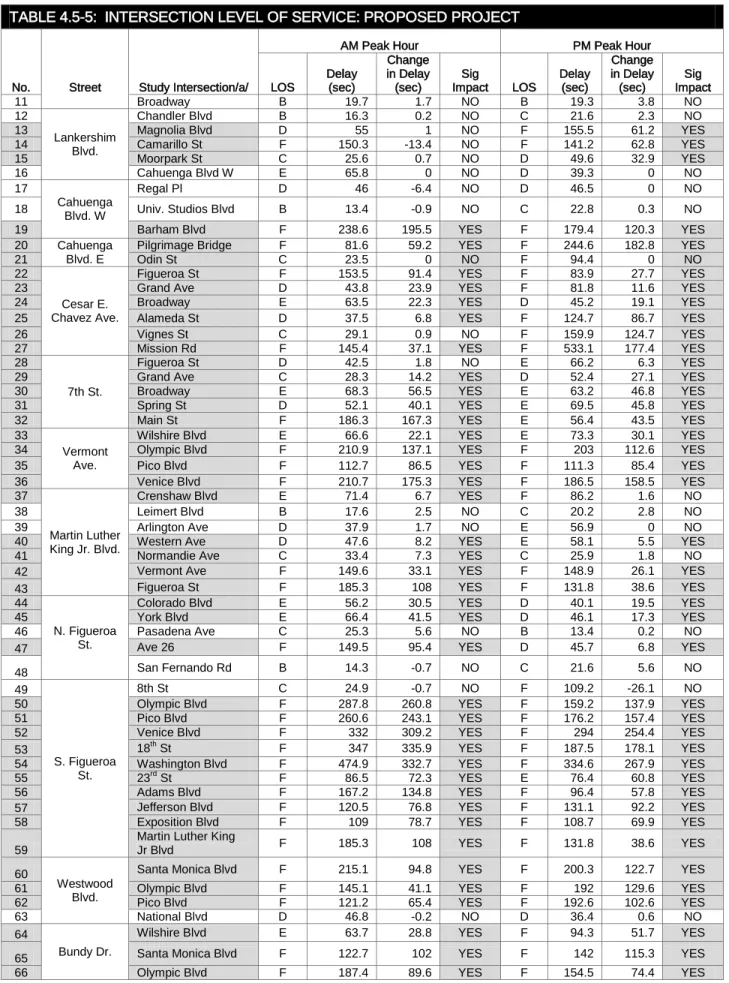
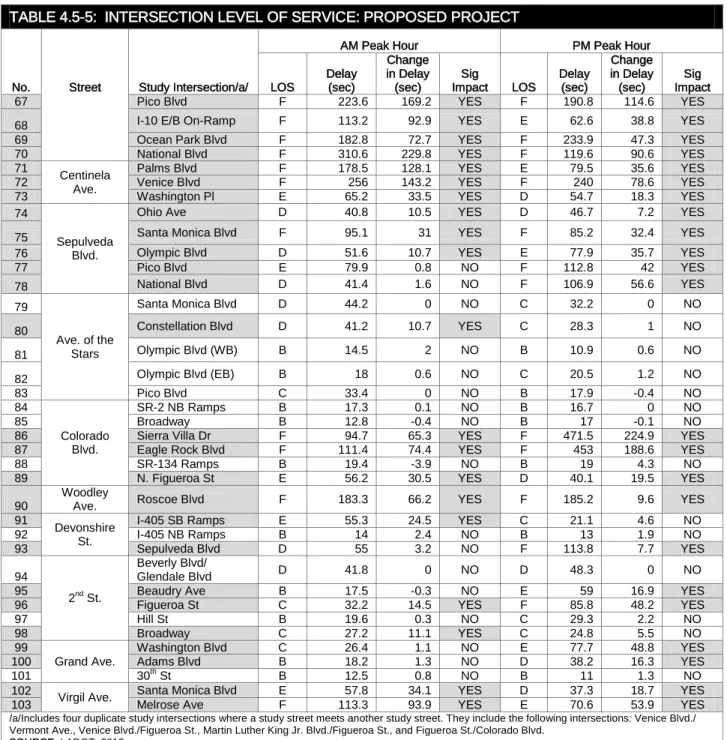
The results of the traffic analysis and corresponding AM and PM peak hour LOS and delay are presented in
Table 4.5-5. The results indicate that under the project condition, 44 intersections would operate at LOS D or better in the AM peak hour and 37 intersections would operate at LOS D or better in the PM peak hour. During the AM peak hour, 15 intersections would operate at LOS E and 40 would operate at LOS F. In the PM peak hour, these numbers would increase to 19 intersections operating at LOS E and 43 operating at LOS F.
Per significance thresholds presented in Table 4.5-4, above, 63 intersections would have potentially significant impacts during the AM peak hour and 71 intersections would have potentially significant impacts during the PM peak hour. Intersections with potentially significant impacts are shaded.
TABLE 4.5-5: INTERSECTION LEVEL OF SERVICE: PROPOSED PROJECT
No. Street Study Intersection/a/
AM Peak Hour PM Peak Hour
LOS Delay (sec) Change in Delay (sec) Sig Impact LOS Delay (sec) Change in Delay (sec) Sig Impact 1 Venice Blvd.
Crenshaw Blvd F 101.2 40.7 YES E 80 7.1 YES 2 Arlington Ave F 130.3 76.5 YES E 68.5 42.8 YES
3 Western Ave F 86.7 59.9 YES E 71.6 47 YES
4 Normandie Ave E 69 40.2 YES D 41.6 19.4 YES
5 Vermont Ave F 210.7 175.3 YES F 186.5 158.5 YES
6 Hoover St E 55.5 20.1 YES E 68.5 12.9 YES
7 Figueroa St F 332 309.2 YES F 294 254.4 YES
8 Flower St E 73.2 56.2 YES E 66.8 48.3 YES
9 Grand Ave B 12.5 3.2 NO D 38.4 7.7 YES
City of Los Angeles 2010 Bicycle Plan 4.5 Transportation, Traffic & Safety First Year of the First Five-Year Implementation Strategy &
Figueroa Streetscape Project Draft EIR
taha 2010-068 4.5-18
TABLE 4.5-5: INTERSECTION LEVEL OF SERVICE: PROPOSED PROJECT
No. Street Study Intersection/a/
AM Peak Hour PM Peak Hour
LOS Delay (sec) Change in Delay (sec) Sig Impact LOS Delay (sec) Change in Delay (sec) Sig Impact 11 Broadway B 19.7 1.7 NO B 19.3 3.8 NO 12 Lankershim Blvd. Chandler Blvd B 16.3 0.2 NO C 21.6 2.3 NO 13 Magnolia Blvd D 55 1 NO F 155.5 61.2 YES 14 Camarillo St F 150.3 -13.4 NO F 141.2 62.8 YES 15 Moorpark St C 25.6 0.7 NO D 49.6 32.9 YES 16 Cahuenga Blvd W E 65.8 0 NO D 39.3 0 NO 17 Cahuenga Blvd. W Regal Pl D 46 -6.4 NO D 46.5 0 NO 18 Univ. Studios Blvd B 13.4 -0.9 NO C 22.8 0.3 NO 19 Barham Blvd F 238.6 195.5 YES F 179.4 120.3 YES 20 Cahuenga
Blvd. E
Pilgrimage Bridge F 81.6 59.2 YES F 244.6 182.8 YES
21 Odin St C 23.5 0 NO F 94.4 0 NO
22
Cesar E. Chavez Ave.
Figueroa St F 153.5 91.4 YES F 83.9 27.7 YES
23 Grand Ave D 43.8 23.9 YES F 81.8 11.6 YES
24 Broadway E 63.5 22.3 YES D 45.2 19.1 YES
25 Alameda St D 37.5 6.8 YES F 124.7 86.7 YES
26 Vignes St C 29.1 0.9 NO F 159.9 124.7 YES
27 Mission Rd F 145.4 37.1 YES F 533.1 177.4 YES 28
7th St.
Figueroa St D 42.5 1.8 NO E 66.2 6.3 YES
29 Grand Ave C 28.3 14.2 YES D 52.4 27.1 YES
30 Broadway E 68.3 56.5 YES E 63.2 46.8 YES
31 Spring St D 52.1 40.1 YES E 69.5 45.8 YES
32 Main St F 186.3 167.3 YES E 56.4 43.5 YES
33
Vermont Ave.
Wilshire Blvd E 66.6 22.1 YES E 73.3 30.1 YES 34 Olympic Blvd F 210.9 137.1 YES F 203 112.6 YES 35 Pico Blvd F 112.7 86.5 YES F 111.3 85.4 YES 36 Venice Blvd F 210.7 175.3 YES F 186.5 158.5 YES 37 Martin Luther King Jr. Blvd. Crenshaw Blvd E 71.4 6.7 YES F 86.2 1.6 NO 38 Leimert Blvd B 17.6 2.5 NO C 20.2 2.8 NO 39 Arlington Ave D 37.9 1.7 NO E 56.9 0 NO
40 Western Ave D 47.6 8.2 YES E 58.1 5.5 YES
41 Normandie Ave C 33.4 7.3 YES C 25.9 1.8 NO
42 Vermont Ave F 149.6 33.1 YES F 148.9 26.1 YES 43 Figueroa St F 185.3 108 YES F 131.8 38.6 YES 44
N. Figueroa St.
Colorado Blvd E 56.2 30.5 YES D 40.1 19.5 YES
45 York Blvd E 66.4 41.5 YES D 46.1 17.3 YES
46 Pasadena Ave C 25.3 5.6 NO B 13.4 0.2 NO
47 Ave 26 F 149.5 95.4 YES D 45.7 6.8 YES
48 San Fernando Rd B 14.3 -0.7 NO C 21.6 5.6 NO 49
S. Figueroa St.
8th St C 24.9 -0.7 NO F 109.2 -26.1 NO 50 Olympic Blvd F 287.8 260.8 YES F 159.2 137.9 YES 51 Pico Blvd F 260.6 243.1 YES F 176.2 157.4 YES 52 Venice Blvd F 332 309.2 YES F 294 254.4 YES 53 18th St F 347 335.9 YES F 187.5 178.1 YES 54 Washington Blvd F 474.9 332.7 YES F 334.6 267.9 YES
55 23rd St F 86.5 72.3 YES E 76.4 60.8 YES
56 Adams Blvd F 167.2 134.8 YES F 96.4 57.8 YES 57 Jefferson Blvd F 120.5 76.8 YES F 131.1 92.2 YES 58 Exposition Blvd F 109 78.7 YES F 108.7 69.9 YES
59
Martin Luther King
Jr Blvd F 185.3 108 YES F 131.8 38.6 YES 60
Westwood Blvd.
Santa Monica Blvd F 215.1 94.8 YES F 200.3 122.7 YES 61 Olympic Blvd F 145.1 41.1 YES F 192 129.6 YES 62 Pico Blvd F 121.2 65.4 YES F 192.6 102.6 YES
63 National Blvd D 46.8 -0.2 NO D 36.4 0.6 NO
64
Bundy Dr.
Wilshire Blvd E 63.7 28.8 YES F 94.3 51.7 YES
65 Santa Monica Blvd F 122.7 102 YES F 142 115.3 YES 66 Olympic Blvd F 187.4 89.6 YES F 154.5 74.4 YES
TABLE 4.5-5: INTERSECTION LEVEL OF SERVICE: PROPOSED PROJECT
No. Street Study Intersection/a/
AM Peak Hour PM Peak Hour
LOS Delay (sec) Change in Delay (sec) Sig Impact LOS Delay (sec) Change in Delay (sec) Sig Impact 67 Pico Blvd F 223.6 169.2 YES F 190.8 114.6 YES 68 I-10 E/B On-Ramp F 113.2 92.9 YES E 62.6 38.8 YES 69 Ocean Park Blvd F 182.8 72.7 YES F 233.9 47.3 YES 70 National Blvd F 310.6 229.8 YES F 119.6 90.6 YES 71
Centinela Ave.
Palms Blvd F 178.5 128.1 YES E 79.5 35.6 YES
72 Venice Blvd F 256 143.2 YES F 240 78.6 YES
73 Washington Pl E 65.2 33.5 YES D 54.7 18.3 YES 74
Sepulveda Blvd.
Ohio Ave D 40.8 10.5 YES D 46.7 7.2 YES
75 Santa Monica Blvd F 95.1 31 YES F 85.2 32.4 YES 76 Olympic Blvd D 51.6 10.7 YES E 77.9 35.7 YES
77 Pico Blvd E 79.9 0.8 NO F 112.8 42 YES 78 National Blvd D 41.4 1.6 NO F 106.9 56.6 YES 79 Ave. of the Stars Santa Monica Blvd D 44.2 0 NO C 32.2 0 NO 80 Constellation Blvd D 41.2 10.7 YES C 28.3 1 NO 81 Olympic Blvd (WB) B 14.5 2 NO B 10.9 0.6 NO 82 Olympic Blvd (EB) B 18 0.6 NO C 20.5 1.2 NO 83 Pico Blvd C 33.4 0 NO B 17.9 -0.4 NO 84 Colorado Blvd. SR-2 NB Ramps B 17.3 0.1 NO B 16.7 0 NO 85 Broadway B 12.8 -0.4 NO B 17 -0.1 NO
86 Sierra Villa Dr F 94.7 65.3 YES F 471.5 224.9 YES 87 Eagle Rock Blvd F 111.4 74.4 YES F 453 188.6 YES
88 SR-134 Ramps B 19.4 -3.9 NO B 19 4.3 NO
89 N. Figueroa St E 56.2 30.5 YES D 40.1 19.5 YES
90
Woodley
Ave. Roscoe Blvd F 183.3 66.2 YES F 185.2 9.6 YES 91
Devonshire St.
I-405 SB Ramps E 55.3 24.5 YES C 21.1 4.6 NO
92 I-405 NB Ramps B 14 2.4 NO B 13 1.9 NO 93 Sepulveda Blvd D 55 3.2 NO F 113.8 7.7 YES 94 2nd St. Beverly Blvd/ Glendale Blvd D 41.8 0 NO D 48.3 0 NO
95 Beaudry Ave B 17.5 -0.3 NO E 59 16.9 YES
96 Figueroa St C 32.2 14.5 YES F 85.8 48.2 YES
97 Hill St B 19.6 0.3 NO C 29.3 2.2 NO 98 Broadway C 27.2 11.1 YES C 24.8 5.5 NO 99 Grand Ave. Washington Blvd C 26.4 1.1 NO E 77.7 48.8 YES 100 Adams Blvd B 18.2 1.3 NO D 38.2 16.3 YES 101 30th St B 12.5 0.8 NO B 11 1.3 NO
102 Virgil Ave. Santa Monica Blvd E 57.8 34.1 YES D 37.3 18.7 YES 103 Melrose Ave F 113.3 93.9 YES E 70.6 53.9 YES /a/Includes four duplicate study intersections where a study street meets another study street. They include the following intersections: Venice Blvd./ Vermont Ave., Venice Blvd./Figueroa St., Martin Luther King Jr. Blvd./Figueroa St., and Figueroa St./Colorado Blvd.
SOURCE: LADOT, 2012.
It is noted that while the proposed project could cause an increase in vehicle delays at the majority of study intersections (89 out of 99), some would experience a reduction in vehicle delays with the implementation of the proposed project. The reduction in vehicle delays at these intersections is minor. It is caused by changes in roadway geometry or due to fewer vehicles arriving from heavily congested upstream intersection. They are described in more detail below under the impacts discussion for each street.
Venice Boulevard – The proposed project would eliminate one travel lane in each direction between
Crenshaw Boulevard and Figueroa Street and introduce a continuous center left turn lane between Arlington Avenue and Figueroa Street. This would result in potentially significant impacts at the following ten intersections:
City of Los Angeles 2010 Bicycle Plan 4.5 Transportation, Traffic & Safety First Year of the First Five-Year Implementation Strategy &
Figueroa Streetscape Project Draft EIR
taha 2010-068 4.5-20
• Intersection #2: Venice Boulevard/Arlington Avenue (AM and PM)
• Intersection #3: Venice Boulevard/Western Avenue (AM and PM)
• Intersection #4: Venice Boulevard/Normandie Avenue (AM and PM)
• Intersection #5: Venice Boulevard/Vermont Avenue (AM and PM)
• Intersection #6: Venice Boulevard/Hoover Street (AM and PM)
• Intersection #7: Venice Boulevard/Figueroa Street (AM and PM)
• Intersection #8: Venice Boulevard/Flower Street (AM and PM)
• Intersection #9: Venice Boulevard/Grand Avenue (PM)
• Intersection #10: Venice Boulevard/Olive Street (PM)
Currently there is one study intersection operating unsatisfactorily at LOS E or F in the AM peak hour and two intersections that are operating at LOS E or F in the PM peak hour. With the implementation of the proposed project, the number of intersections operating unsatisfactorily would increase to eight and seven in the AM or PM peak hours, respectively.
Lankershim Boulevard – The project would eliminate a travel lane in the northbound direction. There are
currently two northbound lanes, with the exception of the segment adjacent to Universal City where there are four northbound lanes. As a result, only one travel lane would remain for the majority of the segment. Consequently, the proposed project would result in potentially significant impacts at the following three intersections:
• Intersection #13: Lankershim Boulevard/Magnolia Boulevard (PM)
• Intersection #14: Lankershim Boulevard/Camarillo Street (PM)
• Intersection #15: Lankershim Boulevard/Moorpark Street (PM)
Currently there are two intersections operating unsatisfactorily at LOS E or F each in the AM and PM peak hours. There would be no change in the number of intersections operating at LOS E or F with the proposed project. It is noted that during the AM peak hour, the intersection of Lankershim Boulevard/Camarillo Street would experience a decrease in delay because the project would change the first southbound shared lane into a second through lane, which would reduce the delay for the through movement, thus decreasing the delay at the intersection.
Cahuenga Boulevard West – South of Barham Boulevard, the project would eliminate two southbound
lanes to a single southbound lane and introduce a southbound bike lane only. This would cause the project to result in potentially significant impacts at the following intersection:
• Intersection #19: Cahuenga Boulevard West/Barham Boulevard (AM and PM)
Currently all three study intersections operate satisfactorily at LOS D or better in the AM peak hour, and one intersection operates unsatisfactorily at LOS E or F in the PM peak hour. With the implementation of the proposed project, the number of intersections operating unsatisfactorily in the AM peak hour would increase to one; however, the number of intersections operating unsatisfactorily in the PM peak hour would not change. It is noted that during the AM peak hour, the intersections of Cahuenga Boulevard West/Regal Place and Cahuenga Boulevard West/Universal Studio Boulevard would experience a minor decrease in delay because the project would remove the parking lane near the intersection and the high traffic volume would experience less delay as a result of the parking reduction near the intersection.
Cahuenga Boulevard East – The project would eliminate a (northbound) travel lane on Cahuenga
Boulevard East south of the Pilgrimage Bridge, north of Odin. This would cause the project to result in potentially significant impacts at the following intersection:
This intersection is currently operating at LOS C in the AM peak hour and at LOS E in the PM peak hour. With the implementation of the project, it would be degraded to LOS F in the AM and PM peak hours.
Cesar E. Chavez Avenue – The project would eliminate a travel lane in each direction during the AM and
PM peak periods and on-street parking on the south side of the street. The double westbound left-turn pocket at Grand Avenue would be reduced to a single left-turn pocket. West of Alameda Street, travel lanes would be reduced from two eastbound lanes to a single eastbound lane. This would cause the project to result in potentially significant impacts at the following six intersections:
• Intersection #22: Cesar E. Chavez Avenue/Figueroa Street (AM and PM)
• Intersection #23: Cesar E. Chavez Avenue/Grand Avenue (AM and PM)
• Intersection #24: Cesar E. Chavez Avenue/Broadway (AM and PM)
• Intersection #25: Cesar E. Chavez Avenue/Alameda Street (AM and PM)
• Intersection #26: Cesar E. Chavez Avenue/Vignes Street (PM)
• Intersection #27: Cesar E. Chavez Avenue/Mission Road (AM and PM)
Currently there are two intersections operating unsatisfactorily at LOS E or F in the AM peak hour and three intersections operating at LOS E or F in the PM peak hour. With the implementation of the project, the LOS E or F intersections would increase to three and five in the AM and PM peak hours, respectively.
7th Street – Between Figueroa Street and Main Street, the project would eliminate one lane in each direction (with the exception of at the intersection with Figueroa Street where two westbound lanes can be retained) and introduce a continuous center left turn lane. This would cause the project to result in potentially significant impacts at the following five intersections:
• Intersection #28: 7th Street/Figueroa Street (PM)
• Intersection #29: 7th Street/Grand Avenue (AM and PM)
• Intersection #30: 7th Street/Broadway (AM and PM)
• Intersection #31: 7th Street/Spring Street (AM and PM)
• Intersection #32: 7th Street/Main Street (AM and PM)
Currently all five study intersections operate at LOS D or better in the AM and PM peak hours, except for the intersection of 7th Street/Figueroa Street, which operates at LOS E in the PM peak hour. With the implementation of the proposed project, two study intersections would operate at LOS E or F in the AM peak hour, and four study intersections would operate at LOS E or F in the PM peak hour.
Vermont Avenue – The proposed project would eliminate a travel lane in each direction while preserving
two northbound lanes at Wilshire Boulevard, and would introduce a continuous center let-turn lane. This would cause the project to result in potentially significant impacts at the following four intersections:
• Intersection #33: Vermont Avenue/Wilshire Boulevard (AM and PM)
• Intersection #34: Vermont Avenue/Olympic Boulevard (AM and PM)
• Intersection #35: Vermont Avenue/Pico Boulevard (AM and PM)
• Intersection #36: Vermont Avenue/Venice Boulevard (AM and PM)
Currently only one study intersection operates at LOS E or F in the AM and PM peak hours; however, with the implementation of the project, the LOS at all four study intersections would be degraded to LOS E or F in the AM and PM peak hours.