Topics in Middle Eastern and North African
Economies Journals and Magazines
9-1-2017
Financial literacy in developing countries
Financial literacy in developing countries
Melike Kokkizi
Bahcesehir University, [email protected] Kamer Karakurum-Ozdemir
The World Bank, [email protected] Gokce Uysal
Bahcesehir University, [email protected]
Follow this and additional works at: https://ecommons.luc.edu/meea
Recommended Citation Recommended Citation
Kokkizi, Melike; Karakurum-Ozdemir, Kamer; and Uysal, Gokce, "Financial literacy in developing countries". Topics in Middle Eastern and North African Economies, electronic journal, 19, 2, Middle East Economic Association and Loyola University Chicago, 2017, http://www.luc.edu/orgs/meea/
This Article is brought to you for free and open access by the Journals and Magazines at Loyola eCommons. It has been accepted for inclusion in Topics in Middle Eastern and North African Economies by an authorized
administrator of Loyola eCommons. For more information, please contact [email protected].
This work is licensed under a Creative Commons Attribution-Noncommercial-No Derivative Works 3.0 License. © 2017 The Authors
135
Financial literacy in developing countries
1Melike Kokkizil2
Kamer Karakurum-Ozdemir3
Gokce Uysal4
Abstract
As global funds flow at unprecedented rates, consumers in developing countries have increased access to financial markets and find themselves handling more complex financial tools. In such a setting, consumers may be overexposed to financial risks. In this respect, increasing financial literacy levels of consumers has become essential, and assessing the financial literacy of the population is a key ingredient of any policy to do so. Using an international survey, we study financial literacy in Mexico, Lebanon, Uruguay, Colombia and Turkey. After establishing financial literacy levels, we identify the least financially literate groups in each country to facilitate targeting of public policy. We find that females, younger adults and individuals who cannot read or write in the official language of their country of residence have lower financial literacy scores. In line with the previous findings in the literature on the developed countries, our results indicate that financial literacy increases with education. In Mexico and Turkey, there are large regional differences that must be addressed.
Keywords: Financial literacy, Financial knowledge, Developing countries, Emerging markets JEL Classifications: A11, F64, F65
1 The authors gratefully acknowledge funding from the Russia Financial Literacy and Education Trust Fund, the Central Bank of Turkey and the Capital Markets Board of Turkey. The data was collected as a part of the Financial Capability Survey carried out by the World Bank. The usual disclaimer applies. We thank Prof. Seyfettin Grsel and the seminar participants in 13th EBES Conference 2014 for valuable comments and suggestions. All remaining errors are our own.
2 Bahcesehir University, [email protected]
3 World Bank, [email protected]
136
Introduction
As financial markets develop, the funds available to consumers increase both in volume and in complexity. At the outbreak of Great Recession, it became clear that the consumers were having difficulty handling the financial decisions they had to make, e.g. mortgage borrowing, saving for retirement, etc. Moreover, a non-negligible group of consumers are overexposing themselves to financial risks that they are not capable of managing. In this context, financial literacy became a critical topic of interest among policymakers, central bankers, banking and stock market regulators in the developed and developing countries alike. Starting in 2010, the OECD and its International Network on Financial Education (INFE) took the lead in setting principles for building national strategies on financial education. In 2012, under Russia’s Presidency, G20 leaders highlighted the importance of national strategies for financial education by endorsing the principles set by the OECD/INFE. A key element in developing such strategies is to employ tools to measure financial literacy, as
summarized in OECD (2014). Many developed countries conducted thorough assessments of the financial literacy levels of their consumers to identify the groups within each country that are in dire need. This is the first step to start designing and implementing policies to increase financial education.
Developing countries face a slightly different picture. Following the Great Recession, many developed countries adopted quantitative easing policies and capital started flowing from the developed to the developing countries at an unusual rate. This flow of funds facilitated the growth of financial markets in developing countries and increased the access of consumers to new financial products which are also becoming increasingly more complex. As the indebtedness of consumers’ surge, governments worry about the aptitude of consumers to make informed financial choices. Therefore, the developing countries are following suit in investing in financial education since the exposure risk is particularly imminent in developing countries where education levels are low and financial inclusion is increasing fast. This issue is the main axis of this study: What are the financial literacy levels in developing countries? Which groups should policies target to increase financial literacy levels? The answers to these questions will lay the foundations for policy
137 design.
The developing countries analyzed within this context are Mexico, Lebanon, Uruguay, Colombia, and Turkey. This choice was dictated by availability of data on financial literacy. The data used in this study comes from the Financial Capability Survey implemented by the World Bank Russia Trust Fund as a part of their Financial
Literacy and Education Program.i In the larger context of the Financial Capability
Survey, there were different modules available to countries, should they wish to implement them. Even though 11 countries participated in the Financial Capability Survey, only five countries mentioned above implemented the Financial Literacy Module of the larger survey, which provides our data. In this study, first we document the financial literacy levels of the countries under study. Then we try to identify the subgroups within each country that has lower levels of financial literacy.
The literature on financial literacy is a relatively new one, but it is growing fast. Some common findings in the literature are as follows. Atkinson and Messy (2012) find that there is a gender gap in financial literacy in Albania, Armenia, Germany, Ireland, Norway, Poland, the UK, and the British Virgin Islands. In another study, Bucher et al. (2012) show that females have significantly lower scores of financial literacy in the US, Germany and the Netherlands. Lusardi and Mitchell (2011) use a different international data set and find that gender gaps in financial literacy exist in Sweden, Japan, Italy and New Zealand as well. Conducting a study across Latin America and the Caribbean, Garca et al. (2013) show that females have lower levels of financial knowledge in these countries, too.
Education is an important determinant of financial literacy in all countries for which data is available. Atkinson and Messy (2012) find that incomplete schooling implies lower financial literacy levels and education beyond secondary schooling implies higher levels. Lusardi and Mitchell (2011) use data from Germany, Norway, Sweden, Italy, Japan, New Zealand, and the US, and Bumcrot and Lusardi (2011) use state-level data in the US. Both studies also show that education increases financial literacy.
Previous studies show that financial literacy is a quadratic function of age. In Romania, 25-44 year olds have the highest scores as demonstrated by Stanculescu (2010). Lusardi and Mitchell (2011) show that financial literacy has an inverted-U
138
shaped relationship with age. Cole et al. (2011) find that financial literacy peaks between the ages of 40 and 45 in their study.
Lusardi and Mitchell (2011) and Bumcrot and Lusardi (2011) show that there are significant differences across ethnic groups in the United States and in Italy. In the US, white and Asian ethnic groups have higher financial literacy scores; in Italy, individuals who live in the north and in central areas have higher scores than those who live in the southern parts. Fonseca et al. (2012) also show that minorities and ethnic groups have lower financial literacy scores.
Among the Latin American and Caribbean countries studied by Garca et al. (2013), Colombia is the only country that we also cover. The authors conduct a descriptive study that covers many countries in the area. In our study, we conduct an econometric exercise to shed light on financial literacy while controlling for certain structural characteristics that are common in the literature. Akin et al. (2012) provide the first study on financial literacy in Turkey where they study the effect of financial literacy on consumer credit card satisfaction. In their study, financial literacy is not the outcome under scrutiny, but is an explanatory factor. There is no direct measure of financial literacy in their study. The authors use financial information, financial
activeness and financial sophistication as proxies. Our study is the first to establish financial literacy levels in Turkey. To the best of our knowledge, no other work exists on the four countries that we consider, namely, Mexico, Lebanon, Uruguay, Colombia and Turkey.
1
Data
The data used in this paper was collected as a part of the Financial Capability Survey funded by the World Bank Russia Trust Fund as well as The Central Bank of Armenia, The Central Bank of Colombia, The Institute of Finance in Lebanon, CNBV and CONDUSEF in Mexico, The National Bureau of Statistics in Nigeria, the Capital Markets Board of Turkey, the Central Bank of Turkey, Turkish Statistical Agency and
the Central Bank of Uruguay.ii The Financial Capability Survey was conducted in 11
countries around the World and its main goal was to deepen the understanding of financial capability in low- and middle-income countries. The survey was administered
139
to individuals and the samples drawn were representative of the national adult population of each country. A respondent was selected randomly in each household among the adults who either participate in the financial decision-making in the household or are at least partially responsible for their own spending. Within the larger context of Financial Capability, a smaller module was developed with the help of the OECD to measure financial literacy in participating countries. The implementation of the Financial Literacy Module was optional. Only five countries chose to use the Financial Literacy Module, i.e. Mexico, Lebanon, Uruguay, Colombia and Turkey. The module consisted of five short questions which aim to measure basic mathematical and financial concepts, such as division, time value of money, calculation of interest on a loan, calculation of interest and principle as well as the concept of compound interest. These five questions correspond to the first five question of the eight questions used by
Atkinson and Messy (2012). The questions are as follows.iii
1. (Division) Imagine that five brothers are given a gift of $1,000. If the brothers
have to share the money equally how much does each one get?
2. (Time value of money) Now imagine that the brothers have to wait for one year to
get their share of the $1,000. In one year’s time will they be able to buy:
(a) (Read out) More with their share of the money than they could today;
(b) (Read out) The same amount;
(c) (Read out) Or, less than they could buy today.
(d) It depends on inflation
(e) It depends on the types of things that they want to buy
3. (Interest on a loan) You lend $25 to a friend one evening and he gives you $25 back
the next day. How much interest has he paid on this loan?
4. (Simple interest) Suppose you put $100 into a savings account with a guaranteed
interest rate of 2% per year. You don’t make any further payments into this account and you don’t withdraw any money. How much would be in the account at the end of the first year, once the interest payment is made?
5. (Compound interest) And how much would be in the account at the end of five years?
Would it be: (Read out)
140
(b) Exactly $110
(c) Less than $110
(d) Or is it impossible to tell from the information given
Each individual got a score of 1 for every correct answer and 0 for every incorrect answer they provided to these questions. Then, the financial literacy levels were calculated as the sum of correct answers to the 5 financial literacy questions, as
recommended by the OECD in Atkinson and Messy (2012).iv Therefore, financial
literacy scores range from 0 to 5. Mean scores for each country are provided in Table 1.
Table 1: Mean and Standard Deviation of Financial Literacy Scores
Mean Std. Dev. Mexico 2.80 0.028 Lebanon 3.13 0.034 Uruguay 3.35 0.034 Turkey 2.65 0.025 Colombia 2.85 0.029
Turkey has the lowest financial literacy score, 2.65 and Uruguay has the highest, 3.45. The distribution of scores is provided for each country in Table 2. The cumulative distribution of scores is provided in
Figure 1. Clearly, regardless of the country, a majority of the population answered
at most 3 questions correctly. In Turkey, Mexico and Colombia, about two thirds of the population scored at most 3.
Table 2: Financial Literacy Scores (%)
0 1 2 3 4 5 Mexico 6.4 9.3 19.9 32.6 26.1 5.7 Lebanon 2.1 9.7 13.6 32.7 31.9 10.1 Uruguay 3.8 5.9 11.8 26.7 33.8 18.1 Turkey 8.5 12.7 22.3 27.3 19.9 9.2 Colombia 4.2 7.7 20.6 38.1 25.5 3.9
The first panel of Table 3 presents the share of correct answers by question in each country. Looking at different questions, we see that about 85% of respondents answered the division question correctly. Note that there is not much variation across countries in this basic division question. More than 80 percent of participants can perform a basic division. As we progress from one question to the next, the share of correct answers fall. More than two thirds of the respondents in Lebanon, Uruguay and Colombia understand the time value of money. Lusardi and Mitchell (2011) also shows that countries that experienced inflation in the past have a better understanding
141
of inflation. Nevertheless, it is surprising to see that only 56 % of Mexican and 47% of Turkish participants could answer this question correctly, especially given that these countries, too, battled high inflation rates not so long ago. Calculation of the interest on a loan seems to be relatively easy as well. More than 70% can calculate the interest and the principle. This time, the share of correct answers in Lebanon and Turkey are lower than in other countries. The last two questions prove more difficult for the residents of these developing countries as the share of correct answers fall dramatically. In Mexico and Turkey, only one third of the participants can calculate a basic interest, and can understand (and not necessarily be able to calculate) compound interest. Surprisingly in Lebanon even though 66% can calculate simple interest, only 22% understand the concept of compound interest. The share of correct answers to interest rate questions in Colombia point to an anomaly. About 87% of respondents answered the interest on a loan question correctly, but only 19% answered the basic interest correctly. Even more surprisingly, the share of correct answers increase to 26% for the compound interest question. One would have expected that respondents who understand compound interest, would have a better understanding of simple interest and thus answered that question correctly as well.
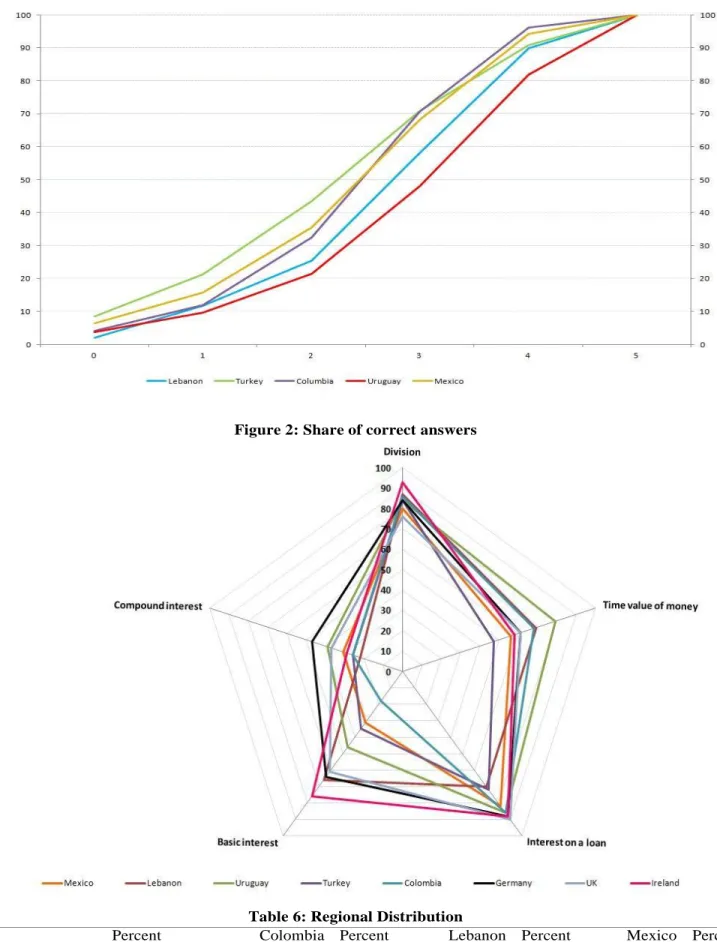
Table 3: Share of correct answers (%)
Division Time value of money Interest on a loan Basic interest Compound interest
Mexico 80 56 82 31 31 Lebanon 87 69 70 66 22 Uruguay 84 79 86 46 39 Turkey 84 47 72 35 26 Colombia 86 68 86 18 26 Germany 84 61 88 64 47 UK 76 61 90 61 37 Ireland 93 58 88 76 29
We can look at Atkinson and Messy (2012) to put these numbers in perspective as they provide the same shares for the same five questions in their paper. Even though their study has eight financial literacy questions, the first five ones coincide. We include comparable data on the UK, Germany and Ireland in Table 3 and the data is summarized visually in Figure 2. A general comparison shows that variation between countries is smallest in the division and the interest on a loan questions. On the other hand, variations in the time value of money, basic and compound interest rate
questions are much greater. Data also shows that even in more developed countries, less than half of the population understands the concept of compound interest.
142
Table 4: Share of correct answers by gender (%)
Mexico Lebanon Uruguay Turkey Colombia Total
Math - Male 79.79 91.98 87.17 90.24 90.36 90.01
Math - Female 80.50 82.87 82.43 77.89 83.20 81.03
Inflation - Male 54.95 76.34 78.25 51.73 71.82 63.89
Inflation - Female 56.06 63.28 80.63 41.81 66.39 59.83
Basic interest rate 1 - Male 81.37 79.58 87.17 76.25 89.09 80.93 Basic interest rate 1 - Female 82.37 62.55 85.32 68.35 84.43 74.89 Basic interest rate 2 - Male 31.26 65.65 54.19 42.17 24.73 45.13 Basic interest rate 2 - Female 30.97 65.89 41.16 28.20 14.86 34.21 Compound Interest - Male 32.42 27.10 43.32 29.97 29.82 31.82 Compound Interest - Female 30.22 17.42 36.94 21.91 23.87 24.78
Table 4 reveals that financial literacy may differ substantially across genders. There are sizeable gender differences in the share of correct answers to each question in all countries, although the gender gap is considerable smaller in Uruguay and there is no gender gap in Mexico. On the other end of the spectrum is Turkey, where the gender gap is the widest.
Other variables that we consider are age, marital status, education, being literate in the official language, labor market status, personal income and region, whenever possible since not all countries have data on all variables. Age is used as a continuous variable and its square was included in the analysis to allow for non-linear effects. Marital status variable is a dummy that takes on the value 1 if the individual is single given that the majority of the sample is married. Especially in developing countries, single individuals may choose to reside with their parents until they get married, and may start managing household financing only then. In that case, single individuals may be engaging in fewer financial transactions and may have lower financial literacy levels. When they get married, they are more likely to make financial decisions and may spend more effort in increasing financial literacy.
Table 5: Descriptive Statistics
Gender Mexico Lebanon Uruguay Turkey Colombia Total
Male 47 43 40 52 36 45 Female 53 57 60 48 64 55 Total 100 100 100 100 100 100 Marital Status Married 67 66 54 65 58 63 Single 33 34 46 35 42 37 Total 100 100 100 100 100 100
Labor Market Status
Inactive 37 42 42 42 32 40
Employed 40 35 41 42 26 38
Self-employed 2 21 9 11 10 10
Unemployed 4 1 4 2 3 3
143
Total 100 100 100 100 100 100
Literate in Official Language
No 5 6 1 4 4 4 Yes 95 94 99 96 96 96 Total 100 100 100 100 100 100 Education Level Primary or below 36 28 35 44 36 37 Secondary 55 46 47 42 43 46 Tertiary 9 26 17 14 21 16 Total 100 100 100 100 100 100 Personal Income Quartile 1 9 8 52 21 Quartile 2 28 22 32 26 Quartile 3 33 32 8 26 Quartile 4 30 38 8 27 Total 100 100 100 100
Education may also affect financial literacy levels to the extent that more educated individual’s access and process more information more easily. The education variable was constructed such that the education levels in each country were classified according to the ISCED categorization. Being literate in the official language may be another measure of education. However, it may point to problems in access to financial services as well. Being literate in the official language of the respective country may facilitate gaining financial knowledge or being illiterate in the official language may impede it. Individuals may even find it impossible to gain financial literacy if all available resources are only in the official language.
The descriptive statistics of the sample are provided in Table 5. There are two statistics that stand out. First, there are more females in the sample than males. This is particularly acute in Colombia where 64% of respondents are female. Secondly, the education level of the sample is much lower in Turkey than in other countries.
This is in line with other international data.v
144
Figure 2: Share of correct answers
Table 6: Regional Distribution
Turkey Percent Colombia Percent Lebanon Percent Mexico Percent
Istanbul 18 Bogota 16 Beirut 12 Central 21
145
Aegean 14 Centro Oriental 25 North Lebanon 18 North Central 14
Eastern Marmara 10 Sur Occidental 17 Bekaa 12 North East 4
Western Anatolia 10 Norte Caribe 22 South Lebanon 10 North West 2
Mediterranean 13 Total 100 Nabatieh 6 South 19
Central Anatolia 5 Total 100 Southeast 5
Western Black Sea 7 West 11
Eastern Black Sea 4 Total 100
Northeastern Anatolia 3 Middle eastern Anatolia 5 Southeastern Anatolia 7 Total 100
Whenever possible we include other variables in the analysis as well. Personal income is one such variable. Higher personal income levels may indicate either higher education or financial inclusion. Individuals with higher income levels have more opportunities to make financial decisions and therefore may spend more time and resources investing in financial education. Personal income is available only for Uruguay, Turkey and Colombia. Each country customized the questionnaire to categorize personal income into quartiles. Given the low response rate to income questions, categorizing the responses in this manner may increase it. Regional information is another variable that we use in the regressions for Mexico, Turkey, Colombia and Lebanon as these are the only countries with data on regions. Table 6
presents the data.vi Although it is not very clear why different regions would have
different financial literacy levels, such a characterization may help policymakers design more directed policies to increase financial literacy.
2
Regression Analysis
We run a linear regression model of financial literacy where the dependent variable is the financial literacy score of the individual. The independent variables considered in the regression analysis are standard. We control for age, gender, marital status, education level, knowledge of the official language in their respective country and labor market status. The reference category is an employed, married male with a high school diploma who is literate in the official language.
Table 7: Regression Results
VARIABLES Mexico Lebanon Uruguay Turkey Colombia
Female 0.0493 -0.270*** -0.222*** -0.320*** -0.254*** (0.0638) (0.0725) (0.0661) (0.0530) (0.0592) Single 0.0151 -0.0890 -0.131** 0.0183 -0.0434 (0.0638) (0.0702) (0.0666) (0.0546) (0.0556) Age 0.00220 0.0113 0.0348*** 0.0316*** 0.0446*** (0.0107) (0.0117) (0.0101) (0.00985) (0.00925)
146
Age square -1.40e-05
-0.000226* -0.000358*** -0.000406*** -0.000529*** (0.000116) (0.000123) (0.000101) (0.000108) (9.76e-05) Less than high school -0.254*** -0.410*** -0.714*** -0.762*** -0.343*** (0.0703) (0.0780) (0.0751) (0.0579) (0.0661)
University 0.404*** 0.335*** 0.341*** 0.193*** 0.392***
(0.101) (0.0772) (0.0898) (0.0712) (0.0716) Not literate in official language -0.333** -0.996*** -0.00639 -1.199*** -1.092*** (0.134) (0.136) (0.291) (0.124) (0.140) Inactive -0.0721 -0.322*** -0.0221 -0.0999 -0.241*** (0.0758) (0.0851) (0.0860) (0.0644) (0.0787) Self-employed -0.120 -0.0375 -0.0141 0.0774 -0.181* (0.187) (0.0860) (0.120) (0.0791) (0.100) Unemployed -0.139 -0.0307 0.204 -0.546*** -0.183 (0.146) (0.248) (0.173) (0.173) (0.162) Other LM status 0.129 -0.0490 -0.153 0.415*** -0.128* (0.0844) (0.729) (0.168) (0.144) (0.0727) Constant 2.793*** 3.542*** 3.035*** 2.649*** 2.447*** (0.237) (0.275) (0.249) (0.217) (0.214) Observations 2,012 1,214 1,388 3,005 1,524 R-squared 0.033 0.275 0.137 0.204 0.203
Standard errors in parentheses *** p<0.01, ** p<0.05, * p<0.1
Table 7 presents the regression results for each country separately. The results indicate that females have lower financial literacy scores in all the countries in the sample, except in Mexico where there is no gender gap. The lowest significant gender gap is in Uruguay. Financial literacy scores of females in Uruguay are 0.222 lower. On the other hand, Turkey has the largest gender gap, where females score 0.32 points lower. Note that the gender gap persists even when education differences are controlled for. This finding is common in the literature, as summarized above.
Another persistent result is the effect of education on financial literacy. Individuals who do not hold high school degrees have lower financial literacy scores. In Mexico, they score 0.254 points lower, and in Turkey, they score 0.762 points lower. Similarly, having a university degree increases financial literacy scores, by 0.193 in Turkey vs. 0.404 in Mexico.
Furthermore, not being able to read and write in the official language of the country lowers financial literacy scores in all countries considered except in Uruguay where only one percent of the sample was not literate in Spanish. In Lebanon, Turkey and Colombia, not being literate in the official language decreases financial literacy scores by about 1 point; in Mexico, by 0.3 points. Not being able to read and write in the official language is one of the most important barriers to financial education. These individuals may not have access to schooling in their primary language, but the effect of being illiterate in the official language is over and above that of education. In other words, being illiterate affects financial literacy very adversely even when
147
differences in education are accounted for. Lower education quality could be one explanation. Individuals who are illiterate in the official language may attend educational institutions of lower quality. Another explanation may be that financial information is only available in the official language of the respective country. In this case, individuals who reside in the country, but are illiterate in the official language, may not have access to financial information that they need to gain financial literacy, especially if financial education is not part of the compulsory education curricula.
Regression results also indicate that financial literacy is a concave function of age. As individuals get older, their financial literacy scores increase, albeit at a decreasing rate. This is another common finding in the financial literacy literature. In Mexico, age does not significantly affect financial literacy scores.
To study the effects of employment on financial literacy scores, we include controls for labor market status. In Lebanon, an individual who is inactive in the labor market scores 0.322 points lower. A similar finding is observed in Colombia. Although the coefficient on being inactive in the labor market is negative in Uruguay and in Turkey as well, it is not significantly different than zero. Other results regarding employment status differ across countries. In Colombia, those who are self-employed score 0.181 points lower. The unself-employed in Turkey score almost half a point lower. The group of “other labor market status” is a more mixed group. In Turkey, individuals in this category score 0.415 points higher, whereas in Colombia they score 0.128 points lower. It is impossible to tell from the data the employment status of these individuals in different countries. Let us remind you that the labor market status in the survey is employed, self-employed, unemployed and others. The usual classification in this category would also contain employers and unpaid family workers. It may well be that the shares of these two groups may differ significantly across different countries, and this, in its turn, may affect financial literacy scores differently.
Looking at the regression results provided in Table 7, we suspect that the coefficients on different variables may differ across countries. However, we need a more thorough analysis to test whether the coefficients are statistically different from each other. To this end, we conduct the relevant Chow tests.vii The results of the Chow tests indicate that the gender coefficient is not the same across countries, i.e. the differences between the gender coefficients are statistically different than zero. The coefficients on lowest levels of education, i.e. the variable “less than high school”, are different across countries. Finally, the coefficients on not being literate in the official language are different as well. All other coefficients are not statistically different across countries. Given that the coefficients on various variables are statistically not the same across countries, we proceed without pooling the data. That is, we continue our analysis with separate regressions for each country under study. Nevertheless, we conduct a basic regression on pooled data
148
However, we also include a basic analysis using pooled data below to test whether the differences in financial literacy levels across different countries stem from differences in structural characteristics of the population that are being considered here.
3.1 Region and Income
Given that regional information is provided for only four of the countries of our sample, i.e. Mexico, Lebanon, Turkey and Colombia, we run a separate regression including regional controls for these four countries (See Table 8). One striking finding is that the coefficients on other control variables are pretty robust to the inclusion of regional dummies in Mexico, Lebanon and in Colombia. In other words, regional differences in these countries are not strongly correlated with any of the other factors that are being considered. In Mexico, participants in Northwestern, South Central, Southwestern and Western regions score significantly lower in financial literacy than those in Eastern regions. Participants living in Northwestern and Western regions score about half a point lower. Residents in regions 1 and 4 in Lebanon have significantly higher scores than residents elsewhere in Lebanon, but the differences are relatively small, i.e. around 0.2 points. In Colombia, residents in Norte Caribe have significantly lower scores by 0.253 points.
The regional outlook in Turkey is different. In Turkey, the coefficients shrink when regional controls are added. The negative effects of less education, not being literate in the official language and being unemployed on financial literacy are considerably smaller. Moreover, the effects of having a tertiary education degree and being older are also mitigated. More interestingly, the detrimental effects of gender on financial literacy grow. When region of residence is controlled for, females score 0.336 points lower in financial literacy. Also, note that regional differences are stark and large. Istanbul has the highest financial literacy scores. Compared to Istanbul, the lowest scores are in Southeast Anatolia (1.226 points), Eastern Marmara (1.234 points) and Northeast Anatolia (1.834 points). To reiterate, region of residence has large and statistically significant effects on financial literacy in Turkey. Given that regions can predetermine 1 to 2 points in financial literacy scores, regional differences should become a primary concern for policymakers in Turkey. Conducting further research on regional differences in financial literacy in Turkey is imperative for the design of any meaningful policy.
Even though we control for various structural characteristics such as education, regional differences persist. Regional differences may stem from educational quality differences that we fail to control for. Alternatively, if financial education is not a part of the compulsory education curricula, access financial information may also vary by region.viii Clearly, any policy to increase financial literacy should focus on the
149
reasons behind remaining differences and tailor policies accordingly. Table 8: Regression Results: Regional Controls Included
VARIABLES Mexico Lebanon Turkey Colombia
Female 0.0439 -0.261*** -0.336*** -0.257*** (0.0631) (0.0726) (0.0497) (0.0591) Single -0.00846 -0.0953 -0.00938 -0.0537 (0.0632) (0.0700) (0.0514) (0.0560) Age 0.00374 0.0118 0.0203** 0.0440*** (0.0106) (0.0117) (0.00923) (0.00923)
Age square -2.87e-05
-0.000230* -0.000314*** -0.000526*** (0.000115) (0.000123) (0.000101) (9.74e-05) Less than high school -0.288*** -0.417*** -0.661*** -0.338*** (0.0703) (0.0789) (0.0552) (0.0662)
University 0.339*** 0.347*** 0.162** 0.408***
(0.101) (0.0776) (0.0665) (0.0718) Not literate in official
language -0.352*** -0.967*** -1.078*** -1.046*** (0.132) (0.137) (0.119) (0.140) Inactive -0.0887 -0.337*** 0.0336 -0.223*** (0.0749) (0.0854) (0.0611) (0.0786) Self-employed -0.168 -0.0225 0.166** -0.116 (0.186) (0.0860) (0.0747) (0.103) Unemployed -0.161 -0.0759 -0.332** -0.184 (0.144) (0.248) (0.162) (0.161) Other LM Status 0.0495 0.0560 0.380*** -0.115 (0.0847) (0.728) (0.135) (0.0728) Central -0.501*** (0.0829) North Central -0.197** (0.0940) North East -0.255* (0.150) North West -0.312 (0.205) South -0.245*** (0.0849) Southeast -0.758*** (0.136) West -0.460*** (0.101) Beirut 0.207** (0.0982) North Lebanon 0.130 (0.0857) Bekaa 0.191* (0.0972) South Lebanon -0.134 (0.104)
150 Nabatieh -0.118 (0.125) Western Marmara -1.000*** (0.112) Aegean -0.777*** (0.0776) Eastern Marmara -1.234*** (0.0854) Western Anatolia -1.016*** (0.0844) Mediterranean -0.333*** (0.0816) Central Anatolia -0.829*** (0.107)
Western Black Sea -1.134***
(0.0957)
Eastern Black Sea -0.692***
(0.118)
Northeastern Anatolia -1.834***
(0.140)
Middle eastern Anatolia -1.175***
(0.114)
Southeastern Anatolia -1.226***
(0.0981)
Bogota -0.00419
(0.0837)
Antioquia Eje Cafetero -0.0811
(0.0792)
Sur Occidental 0.0191
(0.0837)
Norte Caribe Constant -0.253***
(0.0769)
Constant 3.094*** 3.479*** 3.601*** 2.521***
(0.239) (0.276) (0.210) (0.218)
Observations 2,012 1,214 3,005 1,524
R-squared 0.060 0.283 0.314 0.211
Standard errors in parentheses *** p<0.01, ** p<0.05, * p<0.1
Another exercise is to control for income, an arguably endogenous variable. Personal income variable is provided only for Uruguay, Turkey and Colombia. Results are in Table 9. In Uruguay, financial literacy scores increase with personal income. Respondents in the upper two income groups score about half a point higher. There are similar effects for the highest income groups in Turkey and Colombia. However, there are no other significant effects in other income groups in Turkey. In Colombia, financial literacy scores of respondents in the second income group are 0.2
151 points higher.
The coefficients on other controls change when income controls are added to the model. For example, the gender gap in financial literacy decreases by half in Turkey, i.e. when income controls are included, the gender gap decreases from -0.336 points to -0.165 points. A similar, albeit smaller fall is observed in Uruguay (from -0.222 to -0.145) and Colombia (from -0.254 to 0.203). Likewise, the effects of education are smaller in size in all three countries. Both the negative effects of having a primary education degree and the positive effects of having a university degree shrink in absolute terms.
Why does higher income imply higher financial literacy levels? Higher income individuals have more resources to invest in financial education. Not only do they have the resources, but they probably also have the opportunity. In other words, given higher income levels, they probably save more, make more financial decisions, etc. This may increase the returns to investing in financial education for higher income individuals as well. Reverse causality may also be a concern here as higher levels of financial literacy will help individuals make better financial decisions, and therefore increase their income. Unfortunately, it is impossible to disintegrate the two effects given the nature of the data collected for this analysis.
Lastly, we include both income and regional variables and run the regression for Turkey and Colombia, the only two countries for which both variables are available. The results are available in Table 10.
The gender gap in Colombia does not change, however, that in Turkey becomes -0.186. Remember that when only regions were included, it was -0.320, and when only income levels were included, it was -0.165. Again, the effects of education are further mitigated in both countries.
3.2 Pooled Data
Another exercise is to pool all the data from different countries and include country dummies to test any differences between countries statistically. In other words, we implicitly assume that coefficients on structural characteristics we consider are common across countries. We state above that the Chow tests conducted show that the coefficients on gender, lowest level of education and not being literate in the official language are statistically different from each other in different countries. However, the coefficients on other characteristics are statistically similar. Therefore, we present the results from pooled regression, but they should be taken with a grain of salt.
152
findings are confirmed. We find that females’ financial literacy scores are 0.210 points lower than those of males. Financial literacy scores increase with age and with education. Being illiterate in the official language and being inactive in the labor market are an obstacle to financial literacy. Controlling for all these structural factors, important differences across countries remain. The reference country in this exercise is Turkey, and the regression results clearly show that Turkey has lower financial literacy scores than all the other countries considered. Mexican participants score 0.151 points, Colombians 0.159 points, Lebanese 0.399, Uruguayans 0.720 points higher than Turkish participants. The differences across countries may stem from differences in the content and quality of education and/or differences in financial sectors, etc.
4
Conclusion
Using data collected by the World Bank on financial literacy as part of the Financial Capability Survey, we focus on financial literacy levels in five countries, Mexico, Lebanon, Uruguay, Turkey and Colombia, for which data are available and comparable. In a series of regressions, we try to understand financial literacy and how it changes across different demographic and socioeconomic groups.
The results indicate that financial literacy patterns in developing countries are similar to developed countries. Women have lower financial literacy scores than men. Some of the gender gap seems to be due to lower income levels of females, but the gender gap persists even after controlling for personal income. Education is another important determinant of financial literacy. Individuals who have at most a primary education degree have lower, and individuals who have a university degree have higher financial literacy scores than those with a high school degree in all countries that we study. Again, the effects of education are still large and significant even after controlling for income and region of residence, albeit somewhat mitigated. Not being literate in the official language is an important impediment to financial literacy, the effect of which persists even when education is controlled for. One may think that not being literate in the official language presents an obstacle to financial inclusion as well.
In line with other findings in the literature, our regression results indicate that financial literacy increases with income. This finding may indicate that income is correlated with education quality and/or access to financial information. On the other hand, individuals with higher income levels may be making more financial decisions which require financial literacy. Therefore, they may invest more money and resources in acquiring financial information.
153
Colombia, but are sizeable in Mexico. On the other hand, they are large in Turkey. Regional variations in financial literacy scores are about 1 point (out of a possible total of 5) in Turkey. Clearly, some of these differences are due to income levels. However, regional disparities remain large and significant when income is also controlled for. If it is neither education, nor income that can explain regional variations in financial literacy scores, a thorough analysis is needed to shed light on what may be causing these variations.
Chow tests indicate that the effect of gender, low levels of education and not being literate in the official language on financial literacy differ in magnitude across countries. Therefore, we conduct only a basic regression on pooled data to test whether there are significant differences across countries in terms of financial literacy. We show that significant differences across countries remain even when we control for various structural characteristics, that we know affect financial literacy scores. In other words, the financial literacy levels are different even when we control for differences in gender, age, education and labor market status in different countries. The countries rank from lowest to highest scores as follows: Turkey, Mexico, Colombia, Lebanon, and Uruguay.
Our findings indicate that education is an indispensable policy when it comes to increasing financial literacy and access to financial resources may be a crucial component. There are stark differences in financial literacy of males and females, so any effort to increase financial literacy levels should include a component that focuses on females. More analysis is needed within countries to understand regional differences in financial literacy and to unpack the relation between income and financial literacy. If this relation reflects access to financial resources, then increasing resources should be an integral part of any policy to increase financial literacy.
Table 9: Regression Results - Including Personal Income
VARIABLES Uruguay Turkey Colombia
Female -0.145** -0.165*** -0.203*** (0.0700) (0.0596) (0.0600) Single -0.132* -0.122** -0.0256 (0.0700) (0.0613) (0.0575) Age 0.0302*** 0.0256** 0.0409*** (0.0109) (0.0115) (0.00964) Age square -0.000333*** -0.000426*** -0.000507*** (0.000108) (0.000125) (0.000101)
Less than high school -0.654*** -0.552*** -0.233***
(0.0813) (0.0717) (0.0727)
University 0.263*** 0.0905 0.277***
(0.0962) (0.0761) (0.0783)
154 (0.318) (0.187) (0.148) Inactive 0.0502 0.210** -0.185** (0.0985) (0.0904) (0.0850) Self-employed 0.0785 0.0698 -0.151 (0.126) (0.0799) (0.101) Unemployed 0.263 -0.356 -0.109 (0.191) (0.352) (0.168) Other LM status -0.0719 0.469*** -0.0864 (0.170) (0.147) (0.0737)
Personal Income Quantile-2 0.0407 0.00733 0.201***
(0.129) (0.112) (0.0672)
Personal Income Quantile-3 0.452*** 0.0860 0.146
(0.128) (0.112) (0.111)
Personal Income Quantile-4 0.494*** 0.421*** 0.475***
(0.135) (0.116) (0.120)
Constant 2.787*** 2.649*** 2.371***
(0.286) (0.262) (0.222)
Observations 1,221 2,211 1,349
R-squared 0.169 0.162 0.214
Standard errors in parentheses *** p<0.01, ** p<0.05, * p<0.1
Table 10 Regression Result Including Personal Income and Region
VARIABLES Turkey Colombia
Female -0.186*** -0.203*** (0.0570) (0.0599) Single -0.123** -0.0327 (0.0588) (0.0580) Age 0.0217** 0.0400*** (0.0109) (0.00963) Age square -0.000383*** -0.000503*** (0.000118) (0.000101) Less than high school -0.511*** -0.227***
(0.0686) (0.0728)
University 0.111 0.288***
(0.0721) (0.0787) Not literate in official language -1.082*** -1.018***
(0.179) (0.148)
155 (0.0855) (0.0854) Self-employed 0.122 -0.0897 (0.0765) (0.104) Unemployed -0.318 -0.102 (0.332) (0.168) Other LM status 0.401*** -0.0738 (0.140) (0.0738) Personal Income Quantile-2 0.0531 0.208***
(0.108) (0.0673) Personal Income Quantile-3 0.116 0.163
(0.111) (0.111) Personal Income Quantile-4 0.275** 0.489***
(0.116) (0.120) Western Marmara -1.058*** (0.130) Aegean -0.675*** (0.0894) Eastern Marmara -1.184*** (0.101) Western Anatolia -0.852*** (0.0958) Mediterranean -0.199** (0.0972) Central Anatolia -0.594*** (0.135)
Western Black Sea -1.022***
(0.107) Eastern Black Sea -0.574***
(0.133) Northeastern Anatolia -1.680***
(0.197) Middle eastern Anatolia -0.925***
(0.150) Southeastern Anatolia -0.928***
(0.131)
Bogota -0.0112
(0.0891)
Antioquia Eje Cafetero -0.0861
(0.0818)
Sur Occidental 0.0626
(0.0894)
Norte Caribe Constant -0.196**
156
Constant 3.362*** 2.433***
(0.257) (0.227)
Observations 2,211 1,349
R-squared 0.261 0.220
Standard errors in parentheses *** p<0.01, ** p<0.05, * p<0.1
Table 11: Regression results using pooled data
(1)
VARIABLES Financial literacy
Female -0.210*** (0.0280) Singe -0.0121 (0.0279) Age 0.0219*** (0.00458) Age Square -0.000264*** (4.83e-05) Less than high school -0.532*** (0.0308)
University 0.357***
157
Not literate in official language -0.833*** (0.0659) Inactive -0.146*** (0.0344) Self-employed 0.0348 (0.0458) Unemployed -0.182** (0.0782) Other LM status 0.0398 (0.0478) Mexico 0.151*** (0.0353) Lebanon 0.399*** (0.0415) Uruguay 0.720*** (0.0408) Colombia 0.159*** (0.0399) Constant 2.630*** (0.107) Observations 9,143 R-squared 0.171
Standard errors in parentheses *** p<0.01, ** p<0.05, * p<0.1
References
Akin, G. G., A. F. Aysan, S. Ozcelik, and L. Yildiran (2012). Credit Card Satisfaction and Financial Literacy: Evidence from an Emerging Market Economy. Emerging Markets Finance and Trade 48 (S5), 103–115.
Atkinson, A. and F. Messy (2012). Measuring financial literacy. Technical report, OECD. Bucher, T., A. Lusardi, R. Alessie, and M. von Roij (2012). How Financially Literate are
Women? Some New Perspectives on the Gender Gap. Panel Paper 31, Network for Studies on Pension, Aging and Retirement.
Bumcrot, C., L. J. and A. Lusardi (2011). The Geography of Financial Literacy: A Report. Technical report, RAND Corporation.
Cole, S., T. Sampson, and B. Zia (2011). Prices or Knowledge? What Drives Demand for Financial Services in Emerging Markets? The Journal of Finance 66 (6), 1933–1967.
158
Fonseca, R., K. J. Mullen, G. Zamarro, and J. Zissimopoulos (2012). What Explains the Gender Gap in Financial Literacy? the Role of Household Decision Making. Journal of Consumer Affairs 46 (1), 90–106.
Garca, N., A. Grifoni, J. C. Lopez, and D. Meija (2013). Financial Education in Latin America and the Caribbean: Rationale, Overview and Way Forward. OECD Working Papers on Finance, Insurance and Private Pensions. No. 33, OECD Publishing, Paris.
Lusardi, A. and O. S. Mitchell (2011). Financial Literacy around the World: An Overview. Journal of Pension Economics and Finance 10, 497–508.
OECD (2014). OECD/INFE Progress Report on Financial Education. Technical report, OECD.
Stanculescu, M. S. (2010). Analysis of the Financial Literacy Survey in Romania and Recommendations. World Bank Other Operational Studies 12874, The World Bank.
i The Central Bank of Armenia, The Central Bank of Colombia, The Institute of Finance in Lebanon, CNBV and
CONDUSEF in Mexico, The National Bureau of Statistics in Nigeria, the Capital Markets Board of Turkey, the Central Bank of Turkey, Turkish Statistical Agency and the Central Bank of Uruguay co-funded the project as explained at the following website: https://www.finlitedu.org/measurement/wb/data/ accessed at 23 December 2013.
ii https://www.finlitedu.org/measurement/wb/data/ , accessed at 23 December 2013.
iiiCountry teams worked with the main team at the World Bank to ensure that the questionnaire was adapted to the
specific conditions of each country. Needless to say, all the US dollars in the questions were replaced with local currencies, e.g. 1,000 TL.
iv In the second question, the interviewer read out loud the first three answers to the interviewee. If the interviewee’s
answer was either (d) or (e), their answer was coded accordingly. We choose to accept these as correct answers. We also experimented with another definition where these answers were taken to be wrong, and the results were qualitatively and quantitatively similar.
vAccording to UNDP, 2010 data, mean years of schooling of adults are 6.5 years in Turkey, 7.3 in Colombia, 7.9 in
Lebanon and 8.5 in Mexico and Uruguay. http://hdr.undp.org/en/content/mean-years-schooling-adults-years,
159
accessed 25 April 2014.
vi
Note that not all 31 states of Mexico are covered in the survey data. We contacted the country team to clarify this issue, but they did not respond.
vii The econometric results are available upon request from the authors.
viiiIt is difficult to think of a measure for access to financial information. Number of commercial bank branches may
be an indicator as banks are also a source of financial information. A World Bank indicator provides information on the number of commercial bank branches per 100,000 adults. There are 112.3 in Colombia, 29.3 in Lebanon, 20.1 in Turkey, 12.7 in Uruguay and 15.3 in Mexico. It seems like the number of commercial bank branches may not be related to access to financial information. However, better data is needed to analyze this question further. The data is taken from the following website: