The
Environmental
Dimensions
of
Universal
Access
to
Safe
Water
Roger Calowa Alan MacDonaldb Miriam Denis Le Sevec
a Programme Head, Water Policy Programme, ODI, London [email protected]
b Principal Hydrogeologist, British Geological Survey, Lyell Centre, Edinburgh. [email protected] c Research Officer, Water Policy Programme, ODI, London [email protected]
Introduction
The world faces a major challenge in adapting to a future where demand for water is accelerating, but
supply remains essentially fixed and increasingly variable. Meeting this challenge is central to
achieving the Sustainable Development Goals (SDGs) as water is a common denominator linking
health, food security and nutrition, clean energy, sustainable cities, climate action, gender equality
and the protection of ecosystems. The overall framing of the SDGs, and Goal 6 specifically, marked a
desire to unite the hitherto polarised spheres of environment and development, recognising the need to both develop water resources for domestic and productive uses, and to protect them for current and future generations (1, 2).
Against this background, Goal 6 ‐ Ensuring availability and sustainable management of water and
sanitation for all by 2030 – represents a hard‐won marriage of environmental and developmental
objectives. But can we ‘have our cake and eat it?’ Unlike energy, where tradeoffs between energy
expansion and environmental degradation can be negated through renewables, extending access to water without a commensurate increase in ‘efficiency’, or reallocation from another use/user, may increase pressure on a finite resource. In a 2050 world of almost 10 billion people1 requiring food, energy and drinking water, demands and trade‐offs will increase. In this chapter we attempt to answer this question in the context of a more ambitious SDG target for achieving ‘universal and equitable access to safe and affordable drinking water for all’ (Target 6.1). More specifically, we address two key questions:
What are the likely environmental constraints to meeting a much more ambitious SDG
drinking water target, alongside other goals that have a bearing, or claim, on the use of water resources?
What steps can be taken to safeguard both existing gains in access to safe drinking water
(water with no microbial or chemical contamination), and secure future entitlements as
pressures on water resources increase? We begin with a brief review of the status of global water resources. We then turn our attention to Africa, and sub‐Saharan Africa (SSA) in particular (Section 2), the SDG region with the greatest drinking water challenge2, and highlight the growing importance of groundwater as a source of supply. Section 3 then reviews key pressures and trends affecting water resources and drinking water services. Finally, Section 4 sets out three priorities for extending and protecting poor people’s access to safe water.
Although the focus of this chapter is on drinking water, we note some of the obvious connections
between extending and sustaining access to safe water and sanitation. Excreta that are not safely
1 Based on latest UN medium‐variant projections estimating a 2050 global population of 9.8 billion (3).
2 Of the 159 million people still using unimproved surface water sources in 2015, 147 million lived in rural areas, with over
disposed of in situ, or transported and treated offsite, pose a threat to water resources, water sources and the wider environment, with well‐rehearsed health risks (5).
Water resource status
Interpreting the global arithmetic: what does the balance sheet look like?
Future water availability to meet the goal of universal access cannot be assumed. To date, however, sector strategies in most countries have operated in a silo, disconnected from wider concerns about water availability, water quality and competing demands from other sectors (6).
In part, this reflects the fact that domestic supply accounts for only a minor component of total water withdrawals, albeit with significant local variation. However, it also reflects the dearth of data on resource conditions and patterns of use, particularly for groundwater. Globally, monitoring records
have been in decline for decades, with under‐investment leading to the collapse of established
networks and a reduction in the quantity and quality of data available for decision‐making (7, 8). The result is that “…few countries know about how much water is being used and for what purposes, the
quantity and quality of water that is available and can be withdrawn without serious environmental
consequences, and how much is being invested in water infrastructure” (9).
On the supply side, we know that the resource base is essentially fixed but highly variable over space and time. We also know that humans have little control over the majority ‐ saltwater in oceans,
freshwater in glaciers, and water in the atmosphere. Most public investment and attention has
focused on rivers and lakes – providing the images used for water messaging – and the dams,
reservoirs and distribution systems that receive the bulk of investment (10, 8). However, groundwater accounts for roughly 96% of freshwater, excluding that locked in glaciers (11). In view of its significance, we might expect to see groundwater figure prominently in assessments of global, regional and national water availability. Surprisingly, it does not. As Taylor (12) and Gleeson et al (13) note, most assessments of global resources have focused on surface water only, or have failed to differentiate between the fraction of freshwater that is well distributed as groundwater with long residence times (years to decades, or longer), or that which is relatively ephemeral and concentrated
in rivers. Crucially, this means that while groundwater may implicitly be included in freshwater
assessments through its contribution to surface water baseflow (e.g. 14), the significance of
groundwater storage is overlooked. This is a major oversight; many countries designated ‘water
scarce’ in terms of annual flows have significant groundwater reserves that could be developed for
domestic use (15, 16). On the demand side, of the water that is withdrawn for human use, roughly 69% is used for irrigation, 19% for industry (including energy generation) and 12% to meet municipal (largely domestic) needs (17). Global averages again conceal major variation, however. Throughout much of the low rainfall areas of the Middle East, North Africa and Central Asia, for example, irrigation accounts for 80‐90% of total withdrawals (ibid). Globally, groundwater abstraction accounts for around one‐quarter of total water withdrawals (8). An
estimated 1‐5–2.8 billion people rely on groundwater as their primary source of domestic water supply
(18, 19); in Africa, probably 50% or more of the population rely on groundwater for drinking (20). Large
scale and intensive groundwater use has also provided the springboard for many Asian countries to transform from agrarian to industrialised economies, helping millions of poor farmers escape poverty (21, 10).
Although water abstractions or withdrawals are often equated with consumption, more than 60% of withdrawals flow back to local hydrological systems via return flows to rivers and aquifers. The distinction between consumptive and non‐consumptive use helps explain why efficiency ‘savings’ in major water using sectors often fail to translate into downstream gains for others, since the ‘saved’ water was never lost in the first place (22, 23). That said, the impact of return flows is not always positive. Where these are of poor quality, the effect may be to degrade water resources and reduce the availability of safe drinking water.
Digging deeper – regional trends and hot spots
Looking a little deeper at the relationship between supply and demand, we know that water scarcity3
in broad terms is increasing. Population growth is a major factor, but water withdrawals have been growing faster than population for decades; between 1990 and 2000 the world’s population grew by a factor of four, but freshwater withdrawals grew by a factor of nine (24, 25). This trend is set to continue, driven by economic transformation in the fast‐growing economies of Africa, Asia and South America (26)
On the supply‐side, while desalination will likely grow in importance in some richer (coastal) countries with secure energy supplies, low cost desalination will not be scaled in the short to medium term. And while climate change is also influencing freshwater availability (see below), over the next 30 years or
so global warming will have only a modest effect on future water scarcity relative to demand‐side
drivers (14, 27, 28).
More than 1.6 billion people now live in river basins where water withdrawals are estimated to
approach or exceed sustainable limits, typically defined in terms of abstraction rates at or above 70% ‐ 80% of total annual renewable (river) flows. Over the next two decades, the numbers of people living in such ‘water stressed’ basins may double (29). The symptoms of unsustainable use are most visible in river, lake and wetland systems – in the intermittent failure of the Yellow River in China to reach the sea, for example, or the shrinking of the Aral Sea in central Asia. However, the fastest growth in water withdrawals is for groundwater, with abstraction at least tripling over the last 50 years (19). Over the 10 year period 2003 – 2013, water levels reportedly fell in 21 of the world’s 37 largest aquifer systems (30, 8). These include the North China Plain, the Guarani aquifer in South America, the western Sahara and Nubian sandstone aquifers of North Africa, aquifers of the Arabian peninsula and the Levant, and the aquifers of the Indus and Ganges basins, as well as those in central and southern
India (ibid). Nearly all underlie some of the world’s most important agricultural regions, with over‐
pumping for irrigation the primary culprit. While the ‘domestic’ sector’s contribution has been
relatively minor, and confined largely to urban areas, the consequences extend to rural and urban
drinking water in terms of both reduced availability and quality. In its latest 2016‐2030 strategy, UNICEF argues that unsustainable water withdrawals associated with drying rivers, depleting aquifers and deteriorating ecosystems put safe and sustainable drinking water at risk (31).
While the problem of aquifer‐scale water level decline assumes prominence in the literature, the
direct monitoring evidence remains thin. Over the last 10 years or so, remote sensing techniques using GRACE4 datasets have been used to indirectly assess the extent of groundwater ‘overdraft’ (32).
3 Defined broadly here to indicate a difference between water availability and demand. Some authors have used thresholds
of available water per person per year to define different categories or levels of water scarcity; others have defined
‘economic’ water scarcity to describe situations where water is abundant but access is constrained by lack of
infrastructure, finance or other factors. For a detailed review of water metrics, see Mason and Calow (2).
4 Gravity Recovery and Climate Experiment (GRACE) data are collected by two NASA satellites that have flown in low‐earth
However, the dominance of publications using GRACE data has arguably skewed much of the recent debate on aquifer depletion. Gravity data from the GRACE mission are gathered at a coarse scale of
400 x 400 km. Trends in resource conditions at a finer scale can only be confidently resolved with
careful interpretation of in situ measurements (33). This is illustrated in northern India, where
repeated GRACE studies have warned of widespread depletion across the Indo‐Gangetic aquifer.
However, a careful analysis of water well measurements in the region shows a much more nuanced situation, with rapid depletion limited to smaller zones, and larger areas with stable or rising
groundwater levels (34). Findings indicate that deteriorating water quality rather than widespread
depletion is the principal concern for drinking water and sustainable agriculture (ibid).
Water quality – a neglected but growing concern
The availability of water is also linked to water quality, as the pollution of water resources can
compromise different types of use – especially for drinking. The symptoms of water quality
degradation are evident in the data we have on water‐borne disease, primarily from fecal
contamination. Many of the poorest people rely on untreated water from either improved or
unimproved sources, so maintaining the quality of the ‘raw’ resource remains vital. Local groundwater is often preferred as it is better protected from pathogens (35). That said, with only 39% of the global population using a safely managed sanitation service and nearly 900 million people still defecating in the open (4), risks to water quality are a widespread concern.
Risks are amplified in fast‐growing cities where the sub‐surface acts as both a source of water and a
receptor of waste. A recent 12‐city study by the World Bank found that two‐thirds of households relied
on on‐site sanitation facilities and, on average, fecal waste from only 22% of households using such
systems was safely managed (36). In flood‐prone cities such as Dhaka, Bangladesh, almost all fecal
sludge ends up in drains or the wider environment, with the result that floodwaters mix with raw
sewage, water supplies become contaminated and outbreaks of typhoid and cholera are
commonplace (37).
Less well documented are the risks associated with a range or organic and inorganic chemical agents from agricultural and industrial sources, and those associated with the salinisation of water bodies. Inorganic industrial pollutants linked to disease include arsenic, copper and lead; in agricultural areas
elevated concentrations of nitrate and high salinity can be a concern. Organic pollutants linked to
health impacts include pesticides, chlordane, phenol, endocrine‐disrupting compounds and
pharmaceuticals (38, 39).
The experience of rapidly urbanising and industrialising economies that have failed to address the
pollution threat offer lessons on the costs – in economic and health terms – of inaction. China, for
example, faces one of most serious water pollution crises ever documented, with official data
indicating that over 30% of monitored river reaches are unfit for potable use or human contact (40). In the densely populated North China Plain, less than 30% of shallow and deep groundwater sources are classified as drinkable (ibid).
Two natural constituents in groundwater, arsenic and fluoride, are of particular concern to health.
One of the most dramatic demonstrations of this is the arsenic crisis in South Asia (notably Bangladesh and West Bengal), where shallow boreholes constructed to supply safe drinking water turned out to have naturally high arsenic concentrations (41, 42). Arsenic in drinking water is responsible for significant morbidity and mortality through a wide range of health problems including skin and other cancers, Type 2 diabetes, and higher rates of fetal loss and infant death. Natural fluoride in groundwater also poses a significant health risk in some areas, particularly in hard‐rock formations.
Around 200 million people may be at risk (43), with over 60 million affected with dental, skeletal and non‐skeletal fluorosis in India alone (44).
The problem of under‐utilisation and inequitable allocation
While the problem of unsustainable use is a growing problem in some locations, it would wrong to assume that the world is ‘running out of water’ in any meaningful sense. As the authors of the Human Development Report pointed out in 2006, “The scarcity at the heart of the global water crisis is rooted
in power, poverty and inequality, not in in physical availability” (45). More recently, an analysis of resource conditions and trends across 10 of the world’s major river basins concluded that while there was scarcity in certain areas, inefficient and inequitable use – essentially a political challenge ‐ was a
more widespread concern than physical scarcity (46). This brings us back to the question of who gets
what – picked up again in Sections 3 and 4.
In addition, while much of the research on water resources management focusses on overuse and
abuse, there are also areas of major untapped potential that could support multiple uses. While the untapped potential of groundwater in parts of Africa is well known (15) – see below, even in India, where groundwater resources are under greater pressure, there are significant opportunities. Recent
work has focussed on mapping out differences in water resource resilience, with the large Indo‐
Gangetic aquifer divided into a series of typologies, each responding in a different way to external pressures (34). In eastern India, there is still vast groundwater potential that remains largely untapped (10).
A regional perspective: Africa’s hydrology and what it means for drinking
water
Uneven distribution between areas and over time
Contrary to popular myth, Africa is not short of water, at least when assessed with conventional ‘averaging’ metrics. Water availability in SSA compares favourably with other regions of the world, having 9% of the world’s water resources and roughly 6000 cubic metres of annual renewable water
resources per capita. This compares with Asia’s 4000 cubic metres and the Middle East and North
Africa’s 1500 cubic metres per capita (47). However, the regional average conceals major problems with mobilising and managing water for lives and livelihoods, and the challenge of uneven distribution across and within countries.
Water in Africa is distributed very unevenly between areas and over time. Inter‐annual rainfall
variability, especially in eastern and southern Africa, is extremely high and will likely increase with
climate change. These areas experience year‐on‐year variations exceeding 30% around the mean ‐
much greater than in the temperate climates of Europe and North America (20). High seasonal
variability compounds these effects, causing droughts and floods (48). Runoff is also very low. This, coupled with high rainfall variability, helps explain the unpredictable and relatively low seasonal and annual flows in many African rivers, and the growing importance of groundwater as a source of supply
– for agriculture, industry and domestic supply.
The advantages of groundwater for secure water supply
In rural areas with dispersed populations, the relative ubiquity and higher quality of groundwater
compared with surface water alternatives means that groundwater development often provides the only cost‐effective way of meeting demand. Moreover, the storage aquifers provide offers a hugely valuable buffering or stabilisation effect, allowing groundwater sources to provide more reliable dry season or drought supply and, in the Asian context especially, supplementary or full irrigation for millions of farmers.
Storage, or more specifically large storage volume per unit of inflow, makes groundwater less sensitive
to annual and inter‐annual rainfall variation and longer term change (49, 15, 16). Storage potential
varies significantly between different hydrogeological environments, but the emerging evidence
suggests that groundwater storage in SSA is substantial – perhaps 20 times the water stored in the continent’s rivers and lakes (Figure 1).
As elsewhere, areas of largest groundwater storage occur in sedimentary basins – both renewable and non‐renewable. In North Africa, for example, water is stored in extensive ‘fossil’ aquifers (e.g. the Nubian sandstone aquifer beneath Chad and Egypt) that receive no contemporary recharge but offer significant development potential. Aquifers with less storage occur in the basement rocks that cover roughly 34% of the continent (35). However, research using environmental tracers has shown that even these lower potential aquifers can store water from several decades (20‐70 years), with reserves that are effectively de‐coupled from more recent rainfall (50).
Implications for meeting drinking water targets
What does this mean for the ambition of achieving universal access to safe drinking water in Africa? On the plus side, evidence suggests that modest yields of groundwater (0.1 ‐ 0.3 litres per second) are
widely available at accessible depths, sufficient to sustain handpump abstraction and with enough
storage to sustain use through inter‐annual variations in rainfall (15) – see Figure 2. Moreover, the long‐term reductions in average rainfall and runoff projected for much of southern Africa by the end of the century will not necessarily translate into less groundwater; much will depend on the timing and intensity of rainfall events, and on changes in land use (see Section 3). In terms of risks and uncertainties, the implication is that higher levels of service associated with on‐ plot access may be difficult to achieve, either from networked sources, or from household‐developed (self‐supply) sources of the kind seen in south Asia. Although the safely managed indicator does not specify the quantity of safe water that should be supplied, the clear implication is that households with on‐plot access will use significantly more water than those with only ‘basic’ or ‘intermediate’ levels of service (5). Moreover, there is at least some evidence to suggest that easy‐to‐reach areas
and groups of people have already been targeted, leaving more difficult environments still to be
tackled. For example, MacDonald and Calow (35) discuss the ‘gravitational pull’ of easier
hydrogeological areas where drilling success rates are higher and unit costs lower.
A key conclusion is that the higher yields (>5 litres per second) needed for more intensive groundwater
use – for multi‐village schemes, more intensive urban development or major agricultural abstraction
‐ are unlikely beyond the major sedimentary terrain, or achievable only when accompanied by in‐
depth hydrogeological investigation. The availability and accessibility of groundwater over much of
Africa is therefore favourable to rural development, but there are limits to the levels of service that
Some African cities will continue to rely heavily on groundwater for utility supply because of their
favourable hydrogeological location (e.g. Addis Ababa, Lusaka). Across a much wider range of
environments, however, household self‐supply within urban areas will likely grow in importance, not
least because of rapid urban growth and the limited reach of piped networks. This poses a risk to
health in circumstances where shallow aquifers are contaminated, and where households use this
water for drinking (rather than as a source of supplementary, non‐potable supply) in the absence of safe and affordable alternatives (52). Figure 1. Groundwater storage in Africa. Source: (15). Note: Groundwater storage based on effective porosity and saturated aquifer thickness. The map of Africa (left) shows groundwater storage expressed as water depth in millimetres with modern annual recharge (contour lines) for comparison. The graph on the right compares groundwater storage volume for each country with annual renewable freshwater availability (FAO data for 2005).
Figure 2. Aquifer productivity map of Africa Source: (15). Note: aquifer productivity based on likely interquartile range for boreholes drilled and sited using appropriate techniques and expertise. The inset map shows an approximate depth to groundwater (51).
Global pressures and trends: key issues affecting water resources and
services
Although the discussion above points broadly to a world of increasing water stress, irrespective of the precise metrics employed, it tells us little about what is driving change, and the specific pressure
points, or constraints, which might impact on SDG attainment. In this section, we therefore briefly
review some of the main drivers of change and global projections, before looking specifically at two converging trends: climate change as a driver affecting the availability and quality of freshwater, and urbanisation as a driver affecting water demand and pollution loads.
Divers of change – decadal projections
Population growth and economic transformation in developing countries will account for almost all growth in water demand (25). While agricultural withdrawals will continue to dominate the overall
share, manufacturing, energy and domestic demands will account for a larger proportion of the overall
take in those countries experiencing rapid growth.
The drivers of demand are inter‐connected and complex to model. The need to raise agricultural
output, for example, will substantially increase demand for the water needed to grow crops, and for
the water needed to generate the energy required to produce and process food. And rising living
standards will increase domestic demand, energy‐water demand, and further shift diets from
predominantly starch‐based to more water‐intensive meat and dairy products.
On the supply‐side, we know that climate change will alter the timing, amount and intensity of rainfall, while changes in evaporative demand resulting from the combined effects of shifts in temperature,
radiation, humidity and wind speed will modify surface and groundwater availability. Specific
outcomes are difficult to predict, particularly for rainfall and its secondary impacts on runoff and recharge (see below) but, in broad terms, water availability is expected to increase at high latitudes and in some wet tropical areas, and decrease over some dry regions at mid‐latitudes and in the dry tropics. At the same time, overall variability is expected to increase, with more droughts and floods (53, 27).
Bringing the demand and supply‐side together, what can we deduce about the combined effects of
these major global changes, and what does this begin to tell us about the opportunities and constraints
affecting the ‘domestic’ sector? Drawing on recent high resolution modelling by the Water Resources
Institute (WRI) to 2040 (28) and on assessments carried out by the Intergovernmental Panel on
Climate Change (IPCC, 27), we highlight the following:
Rapid increases in water stress5 across many regions including north and southern Africa,
Africa, the Middle East, northern China, western Asia and Chile, as well as the (much richer) North American West, eastern Australia and Mediterranean.
The relative dominance of changes in demand over changes in supply, with projected
increases in irrigation withdrawals (and consumptive use) dominating the demand side.
The large numbers of people moving across categories of water stress because of climate
change. Demand‐side pressures tend to dominate the picture over the next three decades.
5 Defined by WRI (28) as the ratio of water withdrawals to available freshwater on an annual, average basis, excluding
storage. Available freshwater was calculated as flow‐accumulated runoff minus upstream consumptive use computed over
Beyond that point, climate change begins to dominate other factors because global population and economic growth stabilise in the 2050s.
Significant relative increases in demand in developing countries (e.g. in central Africa) where
baseline water demand is very low. Indeed many poorer countries remain at low stress levels
for the next few decades despite a rapid acceleration in water use, highlighting significant
scope for resource mobilisation. As with all such projections, major uncertainties are associated with both the climate models used to derive water availability, and the assumptions linking demographic and economic change with water demand. The role of groundwater storage is also overlooked (see Section 2). Nonetheless, findings are useful in highlighting hotspots of water stress where competition for water is likely to be intense, and where the entitlements of domestic users – urban and rural ‐ will need to be defended against other claims (see below).
Climate variability and change – impacts on water resources and services
The impacts of climate change on water‐dependent services will be felt through a complex mix of slow
onset trends (e.g. warming), changes in variability (daily to seasonal and decadal), fluctuations in mean
conditions (places may become wetter or drier) and changes in the frequency and intensity of extreme events (droughts and floods). However, we also know that climate models typically fail to show how key elements of the hydrological cycle will evolve at the spatial and temporal scales needed for planning (53).
This is partly because of the difficulties of downscaling global and regional models to the local level,
but also about attribution. Untangling the climate signal from what the IPCC term ‘confounding’
factors (e.g. land use change, water withdrawals) is hampered by the shortage of observational data
in developing countries needed to establish baselines and project impacts. The climate observing
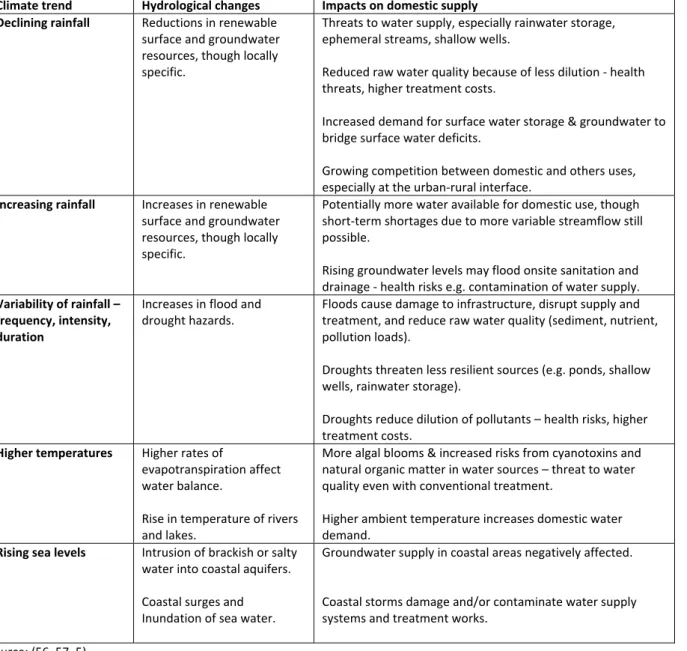
system for Africa, in particular, is in a worse state than in any other continent and is deteriorating (54). So what can we say about likely impacts on water availability, quality and services? Table 1 provides a summary of water‐related hazards and risks to drinking water services, both urban and rural.
Where rainfall decreases, we might expect to see a reduction in renewable freshwater resources and
vice versa. Reductions in water availability pose a particular risk to more basic water supply systems unable to draw on significant storage (e.g. rooftop rainwater harvesting, springs, shallow dug wells). Increases in water availability may be broadly positive, though the risk of microbial contamination will likely increase if groundwater levels rise. For example, by reducing the distance (and hence travel time for pathogens) between the base of pit latrines and the water table. Impacts are by no means certain, however, and much will depend on local conditions, and specifically the relationship between evapotranspiration, soil moisture and land use change. Moreover, climate
model projections based on average rainfall years do not adequately capture the inter‐annual and
inter‐decadal variability that can positively or negatively affect water resources and water services.
The West African Sahel provides a case in point. Here, groundwater recharge and storage increased in
the latter part of the 20th Century despite a multi‐decadal drought. The reason was a shift from deep‐ rooted savannah to crop land that increased surface runoff and aquifer recharge (16). In terms of variability, climate models are broadly consistent in projecting increases in the proportion of total rainfall that falls in heavy events, increasing flood hazards (55, 27). As exposure to floods goes up – a clear trend over the last 50 years – socio‐economic losses will increase, especially in smaller catchments with high population densities (27). Flood damage already accounts for around one‐third
of the economic losses inflicted by natural hazards worldwide (ibid), and even localised flooding can
damage water supply infrastructure and expose water sources and distribution systems to serious
contamination.
The flip side is an increase in the frequency and/or duration of droughts, at least in those areas where rainfall is already low such as southern Africa (27). Droughts remain Africa’s most significant natural
hazard, though over the last 50 years there is no evidence that the frequency of surface and
groundwater droughts has changed (48).
Table 1. Water‐related climate hazards and impacts on drinking water services Climate trend Hydrological changes Impacts on domestic supply Declining rainfall
Reductions in renewable
surface and groundwater
resources, though locally
specific.
Threats to water supply, especially rainwater storage,
ephemeral streams, shallow wells.
Reduced raw water quality because of less dilution ‐ health
threats, higher treatment costs.
Increased demand for surface water storage & groundwater to
bridge surface water deficits.
Growing competition between domestic and others uses,
especially at the urban‐rural interface. Increasing rainfall
Increases in renewable
surface and groundwater
resources, though locally
specific.
Potentially more water available for domestic use, though
short‐term shortages due to more variable streamflow still
possible.
Rising groundwater levels may flood onsite sanitation and
drainage ‐ health risks e.g. contamination of water supply. Variability of rainfall –
frequency, intensity, duration
Increases in flood and
drought hazards.
Floods cause damage to infrastructure, disrupt supply and
treatment, and reduce raw water quality (sediment, nutrient,
pollution loads).
Droughts threaten less resilient sources (e.g. ponds, shallow
wells, rainwater storage).
Droughts reduce dilution of pollutants – health risks, higher
treatment costs. Higher temperatures Higher rates of
evapotranspiration affect
water balance.
Rise in temperature of rivers
and lakes.
More algal blooms & increased risks from cyanotoxins and
natural organic matter in water sources – threat to water
quality even with conventional treatment.
Higher ambient temperature increases domestic water
demand.
Rising sea levels
Intrusion of brackish or salty
water into coastal aquifers.
Coastal surges and
Inundation of sea water.
Groundwater supply in coastal areas negatively affected.
Coastal storms damage and/or contaminate water supply
systems and treatment works.
Source: (56, 57, 5).
The combination of changes in streamflow and rising temperatures is also expected to have broadly
negative impacts on freshwater ecosystems and water quality (27). Higher water temperatures
encourage algal blooms and increase risks from cyanotoxins and natural organic matter in water
sources. Increased runoff results in greater loads of fertilisers, animal wastes and particulates; in
meanwhile, reduce the capacity of rivers to dilute, attenuate and remove pollution and sediment.
Reductions in raw water quality pose risks to drinking water quality, even with conventional
treatment, though the extent and nature of changes remain uncertain and very dependent on rainfall
seasonality, land cover and soil management practices (ibid).
While the longer‐term impacts of climate change on WASH are a clear concern, a preoccupation with
projections can divert attention away from existing threats, particularly in areas with high seasonal
and inter‐annual variability. Indeed there is little value scrutinising climate projections to the end of the century for rural WASH programmes that prioritise household or community‐based system with a design life of 10‐20 years (57). For major investments in storm drains, sewerage or other long term infrastructure, the situation is clearly different. The impact of ‘normal’ seasonality on the reliability and level of services people receive is frequently over‐looked, and not captured in the most often quoted binary (functional/non‐functional) data on performance. Yet discontinuity of supply can lead to households spending more time and covering additional distances to reach an alternative source, if available. And since rural users in particular may collect water on a daily basis, even short duration failures impose hardship. If unimproved sources are used in the interim, even for short periods, many of the benefits associated with continuous access to safe water are jeopardised (39). In Sierra Leone, up to 40% of water points either fail completely towards the end of the dry season, or provide insufficient water for basic needs (58). In Ethiopia, detailed water audits have shown how even in ‘covered’ communities, households can struggle to meet water requirements recommended
for emergency situations, particularly in the dry season (59). Increasing (seasonal) collection times
affected the poorest households most severely, as they had the least labour to release, the fewest assets to collect and store water, and the least cash to pay for it. They were also more likely to forego income‐generating activities in favour of water collection, and more likely to see the condition of their livestock deteriorate because of poor water access (ibid). The recent El Niño‐triggered drought of 2015‐16 has also raised questions about the resilience of existing water services. In Ethiopia alone, around nine million people were affected by acute water shortages (60).
Changes in water demand and load – the urbanisation challenge
Globally, 54% of the population now reside in urban settlements. By 2050, 66% of the world’s
population is projected to be urban, with nearly 90% of the increase concentrated in Africa and Asia (61). Moreover, most of the growth will occur not in the world’s mega‐cities, but in smaller towns and
cities of less than one million people where close to half of the world’s urban dwellers reside (ibid).
Some of key environmental risks associated with rapid urban growth are illustrated in Figure 3,
showing the evolution of water supply and wastewater and excreta disposal in a growing settlement
underlain by shallow groundwater. As the settlement expands, water supplies originally obtained from
shallow aquifers may no longer be sufficient, either because the available resource is too limited, or because of pollution. Public supply may then be tapped from deeper aquifers or, more often, drawn from aquifers or surface water sources in the city’s hinterland at increasing distance and cost. However, such sources usually have a competing prior use – typically agricultural.
Further city expansion may then lead to encroachment on peri‐urban well fields, leading to a new
wave of pollution risk (62, 52). While public utilities may again seek to develop new, more costly supplies or invest in treatment, households may continue to self‐supply increasingly polluted water
from within the city. Widespread groundwater contamination by petroleum products, chlorinated
viruses may be more localised because of die‐off, but can be similarly widespread where on‐site
excreta disposal via septic tanks, cesspits and pit latrines occurs in high‐density settlements. Many of the people using onsite sanitation in urban areas have neither connections to sewerage networks, or access to systems of faecal sludge management, particularly those that include treatment of waste before disposal (5). The scale and pace or urban growth in Asia and Africa is such that the development of infrastructure lags behind city expansion. Smaller towns are particularly disadvantaged. While large utilities have the potential to draw on significant human and financial capital to address vulnerabilities and invest in infrastructure, fast‐growing towns typically do not. They are effectively trapped in a transition zone where (rural‐style) community management is stretched beyond its limits and larger, professionalised utilities have yet to emerge (63). In India, many better‐off urban households self‐supply groundwater as a coping response for dealing with poor municipal supply (64, 65). Poorer households, on the other hand, have no option but to rely
on unregulated private vendors or, if more fortunate, standpipes. Meanwhile the water (and
pollution) footprint of cities extends out into rural areas, bringing rural and urban users and sometimes
adjacent states into conflict (66, 67). In China, city planners in the water‐scarce north are experimenting with trading systems designed to reallocate agricultural water along the Yellow River to thirsty towns and cities downstream (68). As in India, environmental stresses have taken on a political hue. Widespread water degradation has fuelled civil unrest, threatening the legitimacy of the party‐state (69). The resource challenges affecting growing towns in SSA are less well documented. However, recent research in Ethiopia (70) shows how local and basin‐scale conflicts can arise in a relatively water
abundant country. In the Awash valley, for example, the claims of urban, industrial, energy and
irrigation users are increasingly interdependent. The combined annual diversions for upstream sugar cane irrigation account for over 75% of water releases from the Koka dam and schemes are expanding. At the same time, rapidly growing downstream towns are struggling for water, with utilities unable to deliver more than a few hours of service per day (ibid). Adjustment pressures in each case are proving difficult to resolve, although China is making progress through its ‘command and control’ bureaucracy (68, 69). Shared concerns over climate change may present an opportunity for different sector actors, including those involved in WASH, to make the case for investment in water resources management.
Figure 3. Evolution of water supply and wastewater disposal in a growing settlement Source: (62).
Managing for sustainability and equity – three priorities for the new
development era
In this concluding section, we turn our attention to some of the steps needed to safeguard both existing gains and future entitlements as pressures on resources accelerate.
A key contention is that the higher levels of service associated with on‐plot access will not be achieved
with a business‐as‐usual approach to delivery that treats WASH as a distinct ‘sector’, and assumes
quantity and quality needs can be met in isolation from other demands. Neither can many hard to
reach areas and groups, unserved or poorly served at present, be reached without much better
information on resources than most countries currently have.
Priority 1 – Invest in water resource assessment and monitoring. In most parts of the world, water
resources remain poorly understood, and monitoring systems are unable to track the impacts of
economic, demographic and climate change.
Global metrics of the kind reviewed in this chapter can be a useful starting point for talking about
pressures and trends. In particular, they can draw attention to the range of pressures affecting water availability (less so quality), and likely ‘hot spots’ where adjustment pressures between users and uses
may be particularly acute. In the African context, they have also allowed us to highlight the
development potential of groundwater ‐ at least up to a point.
But what exactly is that ‘point’? When it comes to local planning and investment decisions, global or
national metrics are no substitute for more granular basin and/or aquifer scale information on
development potential, sustainability and risks. And although much can be done on the back of
individual water supply programmes and projects to collect data, incentives for data collection,
synthesis and use are often lacking. Yet we know that more systematic assessment and monitoring of
resources is needed to guide decisions. For example, we still do not know enough about where
groundwater resources could provide at‐house levels of supply, or how multi‐village schemes could be developed from higher‐yielding sources supporting discrete areas of a network, with the potential to supply others to avoid network‐critical failures. Nor do we know enough about how intensive water development to support commercial agriculture or the growth of towns might impact smaller (rural) domestic users, or the ecosystem services that poorer households, in particular, are dependent on. We also note that there is at least some evidence to suggest that geographical disparities in access to
water services can reflect ‘easier’ and more ‘difficult’ environments, at least in more complex
hydrogeological and meteorological contexts. In short, easier environments are cherry‐picked in an effort bump‐up results and demonstrate value for money, a risk that may increase with results‐based financing modalities. Difficult areas are avoided because of high costs and low drilling success rates,
irrespective of demand. Here again, even modest investment in resource assessment can pay
dividends in terms of higher drilling success rates and in locating higher‐yielding, more resilient sources.
Priority 2 – Recognise that degrading water quality poses at least as great a risk to drinking water as
over‐exploitation. In rapidly growing and transforming economies, the nature of pollution risk changes;
resources can easily be ‘written off’ if industrial discharges, in particular, are not controlled.
While the global conversation on water tends to fixate on scarcity and over‐exploitation, the pollution
of drinking water sources – or potential sources of drinking water – may be a more significant problem.
While data are scarce, we know that water resources can become too contaminated to safely use or
economically treat long before abstraction even begins, or the symptoms of pollution are first
more widespread threat of salinisation (from irrigation returns) and urban‐industrial pollution to current and future users, including domestic.
For rivers, streams and lakes, water quality degradation often occurs through direct discharge of waste
to the river. This can take the form of sewerage, or industrial effluent. These point sources of pollution
are relatively easy to identify, but require regulation and enforcement measures to control, and
sufficient environmental flows to dilute and disperse remaining contaminants. Diffuse pollution
(which also impacts groundwater) can be more difficult to identify and manage, and requires a
catchment‐wide approach to mitigate. Intensive agriculture in particular can present risks, releasing nutrients and sediment to water resources that can lead to a rapid decline in ecological status. Controlling the use of fertilisers and pesticides, in combination with ‘buffer strips’ in the landscape that intercept sediments and contaminants, can be effective – with monitoring and enforcement. In Europe, the introduction of point source and diffuse control measures has led to improvements in the quality and status of many highly degraded rivers. Groundwater is at risk of pollution if the natural capacity of the soil, unsaturated zone, or confining layers of an aquifer are insufficient to contain and attenuate contaminant loads. Since the movement of water in the ground is generally slow, pollution of groundwater may not be detectable for decades,
but may remain a problem for decades after the polluting activity has stopped (71). How seriously
groundwater is polluted depends on the nature of the aquifer and overlying unsaturated zone and soil, hence control measures typically rely on land use planning linked to vulnerability mapping,
together with systematic programmes for identifying polluting activities and monitoring water
sources. Looking ahead, we know that on‐site sanitation will remain the norm in most developing countries. The adoption of risk‐based approaches (e.g. water safety plans) to the siting of drinking water sources and latrines can be effective in preventing microbial contamination of water supplies, as can relatively simple adaptations to latrine and sanitation design. As economies and populations grow, however, new threats will emerge linked to agricultural intensification, industrialisation and urbanisation. One of the biggest challenges facing planners will likely be service delivery and pollution control in rapidly
expanding ‘rural’ towns. Effective fecal sludge management will grow in importance alongside the
control of industrial activities ‐ to avoid the massive costs of resource degradation now faced in large parts of China and India.
Priority 3 – Engage in the wider conversation about water resources management – who gets what
as pressures on resources increase and climate change accelerates. Weak governance will exacerbate
existing inequalities and undermine progress towards universal access.
The SDGs set a high bar of ‘safely managed’ water and sanitation services. For drinking water, the clear
implication is that households with on‐plot access will use significantly more water than those with only ‘basic’ or ‘intermediate’ access. This is obviously good for health and livelihoods – if water is available on a sustainable basis, and if the claims of poorer domestic users can be defended against other interests.
Our review of global trends has highlighted hot spots, where basins are (or maybe) over‐exploited or
approaching closure, but also major development opportunities. For water‐stressed areas,
adjustment pressures within and between sectors may be intense, and while climate change may
exacerbate problems, the main drivers of change will likely be socio‐economic. Even in these areas, it would be wrong to assume that scarcity is simply a ‘natural’ phenomenon: indicators of water stress offer little insight into why, for example, people living in the slums of Mumbai face shortages of clean water while their neighbours in high‐income suburbs irrigate their lawns.
Our main argument here, however, is about avoiding some of the more damaging inequalities in
access to water that can emerge through a combination of growing demand and weak governance.
Take Sub‐Saharan Africa. Here, the mobilisation of water for power, food production, industry and
domestic use is a clear priority. But building the hard infrastructure of storage and conveyance needs to be matched with investment in the ‘soft plumbing’ of rights, rules and incentives. Without it, there is a risk that water will be captured by powerful interests – in commercial agriculture or industry for example. The result may be good for headline GDP, but not for the livelihoods of poorer people with a stake but no voice in water allocation. For mainly fast‐growing economies, progression up the water
service ladder, and the ability to sustain hard‐won gains, will increasingly depend on an ability to
manage water resources for a range of competing interests, with domestic use a clear priority.
Building robust institutions and frameworks for managing water remains a long‐term goal in most
countries, not always helped by a pre‐occupation with idealised forms of ‘integrated’ management. So what needs to change? Perhaps the main priority is for those working on WASH to play a much
more active role in wider policy and planning debates around water allocation and protection. In short,
about how, and for whom, water resources are developed and managed, beyond wistful visions of ‘water security for all’. There will be few quick wins. Investment in institution building – registration systems, water accounting, rights, allocation licensing, pollution control – does not generate the kind of short term, measurable results that many now favour, but will be essential in realising the goal of universal access.
References
1. Melamed C, Scott A and Mitchell T. Separated at birth, reunited in Rio? A roadmap to bring
environment and development back together. ODI Background Note, May 2012.
2. Mason N, Calow R. Water security: from abstract concept to meaningful metrics ‐ an initial
overview of options. ODI Working Paper 357. London: Overseas Development Institute, 2012.
3. UNDESA. World Population Prospects: The 2017 Revision, Key Findings and Advance Tables.
Working Paper No. ESA/P/WP/248 Department of Economic and Social Affairs, Population
Division. New York: United Nations, 2017.
4. WHO/UNICEF Progress on Drinking Water, Sanitation and Hygiene: 2017. Update and SDG
Baselines. Geneva: World Health Organisation and the United Nations Children’s Fund (UNICEF), 2017.
5. Howard G, Calow RC, MacDonald AM, Bartram J. Climate change and water and sanitation: likely
impacts and emerging trends for action. Annual Review of Environment and Resources. 2016; 41: 253‐276.
6. Calow R, Mason N. The real water crisis: inequality in a fast changing world. London: Overseas
Development Institute, 2014.
7. Robins NS, Davies J, Farr JL, Calow RC. The changing role of hydrogeology in semi‐arid southern
and eastern Africa. Hydrogeology Journal. 2006; 14: 1483‐1492.
8. Smith M, Cross K, Paden, M, Laban P (eds). Spring – Managing groundwater sustainably. Gland,
Switzerland: IUCN, 2016.
9. WWAP. World Water Assessment Programme. The United Nations World Water Development
Report 3: Water in a Changing World. Paris: UNESCO, 2009.
10. Giordano M. Global Groundwater? Issues and Solutions. Annual Review of Environment and
Resources. 2009; 34: 153‐178.
11. Gleick PH (ed), Water in Crisis: a Guide to the World’s Fresh Water Resources. New York: Oxford University Press, 1993.
12. Taylor R. Rethinking water scarcity: the role of storage. EoS. 2009; 90: 237‐238.
13. Gleeson T, Wada Y, Biekens MFP, van Beek LPH. Water balance of global aquifers revealed by
14. Vorosmarty CJ, McIntyre PB, Gessner MO, et al. Global threats to human water security and river biodiversity. Nature. 2010; 467: 555–561.
15. MacDonald AM, Bonsor, HC, Ó Dochartaigh BE, Taylor RG. Quantitative maps of groundwater
resources in Africa. Environmental Research Letters. 2012; 7: 024009.
16. Taylor R, Scanlon B, Doll P et al. Ground water and climate change. Nature Climate Change. 2013;
3: 322‐329.
17. FAO. FAO‐AQUASTAT database accessed August 2017, last updated November 2016.
18. Döll P. et al. Impact of water withdrawals from groundwater and surface water on continental
water storage variations. J. Geodyn. 2012; 59–60: 143–156. 19. Margat J, van der Gun J. Groundwater around the World: A Geographic Synopsis. London: CRC Press, 2013. 20. Carter RC, Parker A. Climate change, population trends and groundwater in Africa. Hydrological Sciences, 2009; 54: 676‐689. 21. Shah T, Burke J, Villholth K et al. Groundwater: a global assessment of scale and significance. In:
Water for Food, Water for Life: A Comprehensive Assessment of Water Management in
Agriculture. Molden D ed. London: Earthscan, 2007.
22. Molden D. ed. Water for Food, Water for Life: A Comprehensive Assessment of Water
Management in Agriculture. London: Earthscan, 2007.
23. Perry C. Efficient Irrigation; Inefficient Communication; Flawed Recommendations. Irrigation and
Drainage. 2007; 56: 367‐378.
24. Waughray D ed. Water Security: The Water‐Food‐Energy‐Climate Nexus. The World Economic
Forum Water Initiative. Washington: Island Press, 2013.
25. WWAP. World Water Assessment Programme 2015. The United Nations World Water
Development Report: Water for a Sustainable World. Paris: UNESCO, 2015.
26. ERD. Confronting scarcity: Managing water, energy and land for inclusive and sustainable growth.
European Report on Development 2011/12. Brussels: European Union, 2012.
27. Cisneros J, Oki T, Arnell N, et al. Freshwater Resources. In: Climate Change 2014: Impacts,
Adaptation and Vulnerability. Part A: Global and Sectoral Aspects. Contribution of Working Group
11 to the Fifth Assessment Report of the Intergovernmental Panel on Climate Change. IPPC.
Cambridge: Cambridge University Press, 2014.
28. Luck M, Landis M, Gassert F. Aqueduct water stress projections: decadal projections of water
supply and demand using CMIP5 GCMs. Technical Note. Washington: World Resources Institute,
2015.
29. World Bank. A water secure world for all. Water for development: responding to the challenges.
Washington DC: World Bank, 2015.
30. Famiglietti, JS. The global groundwater crisis. Nature Climate Change. 2014; 4: 945‐948.
31. UNICEF Strategy for Water, Sanitation and Hygiene, 2016‐2030. UNICEF New York, August 2016.
32. Richey AS, Thomas BF, Lo MH et al. Quantifying renewable groundwater stress with GRACE. Water
Resources Research. 2015; 51: 1‐22.
33. Alley WM, Konikow L. Bringing GRACE down to Earth. Ground Water. 2015; 53: 826‐829.
34. MacDonald AM, Bonsor HC, Ahmed KM et al. Groundwater quality and depletion in the Indo‐
Gangetic basic mapped from in situ observations. Nature Geoscience. 2016; 9: 762‐766.
35. MacDonald AM, Calow RC. Developing groundwater for secure rural water supplies in Africa.
Desalination. 2010; 248: 546‐556.
36. World Bank. The missing link in sanitation service delivery: a review of faecal sludge management
in 12 Cities. Washington DC: World Bank, 2014.
37. Ross I, Scott R, Joseph R. Faecal Sludge Management: Diagnostics for Service Delivery in Urban
Areas. A case study in Dhaka, Bangladesh. World Bank Water and Sanitation Programme.