SPONSORED BY:
PREMIER
S P O N S O R S
MEDIA
I
I
n
n
t
t
e
e
r
r
n
n
a
a
t
t
i
i
o
o
n
n
a
a
l
l
T
T
r
r
a
a
d
d
e
e
O
O
u
u
t
t
l
l
o
o
o
o
k
k
Southern California Region 2015-2016
Los Angeles County Economic Development Corporation The Kyser Center for Economic Research 444 S. Flower St., 37th Floor, Los Angeles, CA 90071 Tel: 213-622-4300 | 888-4-LAEDC-1 | Fax: 213-622-7100
©2015 Los Angeles County Economic Development Corporation 444 S. Flower Street, 37th Floor., Los Angeles 90071
T: (213) 622-4300 | F: (213) 622-7100 | www.laedc.org
The LAEDC, the region's premier business leadership organization, is a private, non-profit 501(c)3 organization established in 1981.
The LAEDC provides economic development leadership to promote a globally competitive, prosperous and growing L.A. County economy to improve the health and well-being of our residents and communities and enable those residents to meet their basic need for a job.
Since 1996, the LAEDC has helped retain or attract more than 200,000 jobs, providing over $12 billion in direct economic impact from salaries and over $1.1 billion in property and sales tax revenues to the County of Los Angeles.
Regional Leadership
The members of the LAEDC are civic leaders and ranking executives of the region’s leading public and private organizations. Through financial support and direct participation in the mission, programs, and public policy initiatives of the LAEDC, the members are committed to playing a decisive role in shaping the region’s economic future.
Business Services
The LAEDC’s Business Development and Assistance Program provides essential services to L.A.
County businesses at no cost, including coordinating site searches, securing incentives and permits, and identifying traditional and nontraditional financing. The LAEDC also works with workforce training, transportation, and utility providers.
Economic Information
Through our public information and for-fee research, the LAEDC provides critical economic analysis to business decision makers, education, media, and government. We publish a wide variety of industry-focused and regional analysis, and our Economic Forecast report, produced by the Kyser Center for Economic Research, has been ranked No. 1 by the Wall Street Journal.
Economic Consulting
The LAEDC Institute for Applied Economics offers thoughtful, highly regarded economic and policy expertise to private- and public-sector clients. The group focuses on economic impact studies, regional industry analyses and economic issue studies, particularly in water, transportation, infrastructure, and workforce development policy.
Leveraging our Leadership
The LAEDC Center for Economic Development partners with the Southern California Leadership
Council to help enable public sector officials, policy makers, and other civic leaders to address and solve public policy issues critical to the entire region’s economic vitality and quality of life.
Global Connections
Our World Trade Center Los Angeles (WTCLA) works to support the development of international trade and business opportunities for Southern California companies as the leading international trade association, trade service organization and trade resource in Los Angeles County. It also promotes the Los Angeles region as a prime destination for foreign investment. For more information, please visit
R
EPORT PREPARED AND RESEARCHED BY
:
Robert A. Kleinhenz, Ph.D.
Chief Economist
Kimberly Ritter-Martinez
Economist
George Entis
Research Analyst
A
BOUT THE
K
YSER
C
ENTER FOR
E
CONOMIC
R
ESEARCH
The Kyser Center for Economic Research was named in November 2007 in honor of the LAEDC’s first chief economist, Jack Kyser. The Kyser Center’s economic research encompasses the Southern California region, which includes the counties of Los Angeles, Orange, Riverside, San Bernardino, San Diego and Ventura. The center also tracks developments and produces forecasts, studies, and reports on the California, national and international economies.
The economy of the greater Los Angeles region is driven by more than its famed entertainment industry. The region’s broad economic base also includes aerospace, automotive, biotechnology, fashion, manufacturing and international trade. The Kyser Center conducts research on the individual industries of the region to gain a better understanding of ongoing changes in the economy.
The Kyser Center is highly regarded for its accurate and unbiased assessment of the economy. Kyser Center economists are also sought-after public speakers and frequent contributors to media coverage of the economy. At the heart of the Kyser Center is its mission to provide information, insights, and perspectives to help business leaders, government officials and the general public understand and take advantage of emerging trends.
T
ABLE OF
C
ONTENTS
Executive Summary ...
1U.S. Outlook ...
3Los Angeles and Southern California Outlook ...
5Trade and Goods Movement in Southern California ... 7
Trade-related Infrastructure Projects ... 14
Industrial Real Estate and International Trade ... 18
International Outlook ...
21Los Angeles Customs District Top Trading Partners ...
27China ... 27 Japan ... 29 South Korea ... 31 Taiwan ... 33 Vietnam ... 35 Germany ... 37 United Kingdom ... 38 Canada ... 38 Mexico ... 39
Statistical Appendix ...
40LAEDC Kyser Center for Economic Research 1 International Trade Outlook 2015-16
E
XECUTIVE
S
UMMARY
The U.S. economy expanded at a solid pace in 2014, while in most other regions of the world, economic activity lagged behind expectations. Aside from GDP, most economic indicators indicated that the momentum of the U.S economy carried into the first quarter of 2015. The divergence in outlooks between the United States and the world’s other major economies has caused the U.S. dollar to strengthen vis-à-vis most major currencies. The strong dollar, together with the sharp drop in oil prices, has disrupted global trade and investment flows. U.S. imports continue to outstrip exports, with the value of imports exceeding exports by 20% last year.
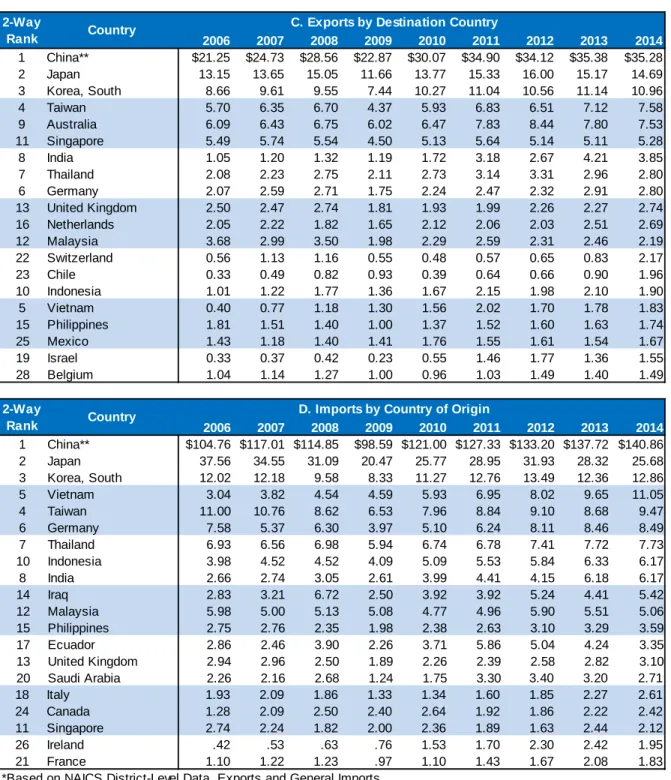
In 2014, total international trade at the national level grew modestly, rising by 3.1%. In the Los Angeles Customs District (LACD), the value of two-way trade increased by 0.5% to $416.6 billion, a new record high. While this was largely due to activity at the San Pedro Bay ports, Los Angeles International Airport (LAX) also contributed $96.3 billion in air cargo, with imports totaling $47.2 billion and exports valued at $49.1 billion. The LACD consistently ranks first in the nation in terms of two-way trade value.
The San Pedro Bay ports of Los Angeles and Long Beach comprise the largest port complex in the Western Hemisphere. Los Angeles County and the rest of Southern California serve as the largest transportation hub in the U.S. Over 40% of the nation’s inbound containers pass through the ports of Los Angeles and Long Beach.
In spite of problems with port congestion and the West Coast labor dispute, the San Pedro Bay ports had their third best year on record, while transportation and warehousing employment increased for the fourth consecutive year. The twin ports registered a 3.8% increase in container activity to 15.16 million containers last year, with 7.79 million loaded inbound containers, 3.54 million loaded outbound containers, and 3.83 million empties. Container throughput is expected to grow by 0.5% this year to 15.23 million and by 2.4% in 2016, hitting 15.60 million containers, with imports outperforming exports.
The largest export categories by value moving out of the LACD in 2014 were computers, peripherals, machinery, and parts; electrical equipment, TVs, and parts; aircraft, spacecraft, and parts; and medical, surgical, and dental instruments. The largest import categories by value moving into the LACD last year included computers, peripherals, machinery, appliances, and parts; electrical equipment, TVs, and electronic parts; motor vehicles, and parts; and apparel and accessories.
Note that the top two import categories are the same as the top two export categories. It is quite common for a country to import and export the same category of goods. Product differentiation is one reason why this occurs. Countries may specialize in manufacturing different grades of a product based on available technologies and workforce skills and then trade to satisfy domestic demand for other levels of quality. Variations in transportation costs and seasonal factors may also play a role.
The LACD’s trading partners mainly come from the Pacific Rim. China was the largest of the region’s trading partners last year with two-way trade valued at $176.14 billion or 42% of total LACD two-way trade, followed by Japan ($40.4 billion) and Korea ($23.8 billion),
LAEDC Kyser Center for Economic Research 2 International Trade Outlook 2015-16
with Taiwan and Vietnam rounding out the top five. However, the sixth largest trading partner was Germany with $11.3 billion.
Together, the goods movement and international trade industries are one of the most important economic engines in the Los Angeles County and Southern California economies. While trade-related employment can be found across a broad array of industries, jobs are concentrated in two industries: the transportation and warehousing industry and the wholesale trade industry. These two industries accounted for 638,000 jobs across the Los Angeles five-county region in 2014. About 40% of these jobs were concentrated in transportation and warehousing, while wholesale trade accounted for the balance.
Despite being the largest in the country, the San Pedro Bay port complex faces stiff competition from ports around the country. Both the Port of Los Angeles and the Port of Long Beach are investing billions of dollars in infrastructure to meet these challenges and to maintain their preeminence in the U.S. shipping industry.
The trade picture will be somewhat mixed over this year and next. The consumer sector in the U.S. is in the best shape since the recession as gauged by employment, incomes, access to credit, and improvement in household balance sheets. This will spur an increase in imports of goods as measured by container activity, but the strong dollar will mean a decline in the nominal dollar value of imports this year. The strength of the dollar along with weakness among the trading partners of the U.S. will also result in a decline in the value of exports. Things will turn around next year, with a 5% increase in imports and a 6% increase in exports, as Europe and other parts of the world see their economies improve. Here in Southern California, LACD two-way trade will essentially up marginally (+0.02%) in 2015 at $416.7 billion, with a 5.5% increase to $439.7 billion anticipated in 2016.
Looking beyond the next 18 months, the long-term trade prospects for Southern California are promising. Economic growth is expected to continue in the U.S. over the next several years, while the nation’s major trading partners should generally experience acceleration in their economies. Moreover, new trade agreements, either recently completed or in negotiation (e.g., the Trans-Pacific Partnership) will facilitate the expansion of trade in the coming years. Taken together with the region’s advantageous location, this bodes well, not only for the international trade sector, but for the entire regional economy.
International Outlook at a Glance
U.S. Real GDP Annual
% Change
Real U.S. Goods Annual % Change
Nominal U.S. Goods
Annual % Change LACD 2-way Trade ($Bil)
TEUs LA/LB (Mil) Exports Imports Exports Imports
2013 2.2% 2.8% 0.9% 2.0% -0.4% $414.5 14.60
2014 2.4% 4.0% 4.1% 2.7% 3.3% $416.6 15.16
2015f 2.5% 0.0% 4.5% -5.9% -5.2% $416.7 15.23
LAEDC Kyser Center for Economic Research 3 International Trade Outlook 2015-16
U.S.
O
UTLOOK
The U.S. economy generally carried momentum from last year into the start of 2015, despite a weak GDP report in the first quarter. The labor market saw a 2.3% year-to-year gain in wage and salary jobs that outpaced the annual 1.9% increase in 2014. The unemployment rate fell to 5.4%, placing it in the range of long-run normal unemployment rates. Meanwhile, every major industry added jobs in yearly terms during the first quarter of 2015.
What about that flat GDP reading for the first quarter? The 0.2% uptick was below expectations, but that was mainly due to temporary circumstances, such as harsh winter weather, a decrease in energy industry investments stemming from the plunge in oil prices, and disruption at the West Coast ports, a situation that was quite severe in January and February but had improved markedly by the end of March. With those one-time events in the rearview mirror, the economy should get back on track during the rest of the year with annual GDP growth of about 2.5%.
Consumer spending has risen in the last couple of years as a result of job and income gains, although the income gains have mainly been due to employment growth and longer hours rather than wage increases. While severe weather held back spending by households in the first quarter, consumer spending should accelerate from under 3% last year to a growth rate of 3.5% this year due to greater consumer optimism and rising purchasing power resulting from lower energy prices and a stronger dollar. Consumer spending may improve further with some easing of credit conditions.
Business investment spending (nonresidential fixed investment) registered a sizable 6% advance last year, led by purchases of industrial and transportation equipment along with noteworthy gains in structures and IT equipment. With the decline in energy prices, energy-related investment activity will decrease this year and next, but the overall picture will be marked by a modest uptick in investment spending this year and a larger increase next year. On the residential side, fundamentals have long implied a significant rise in new home construction, but the gains over the last couple of years have been disappointing. Whether fundamentals such as an increase in household formation materialize this year and contribute to the long-awaited surge in construction remains to be seen.
On the trade front (both goods and services), the real (or inflation-adjusted) value of imports jumped by 4% last year, the largest gain in three years. Real exports rose by just over 3%, roughly in line with the previous two years. U.S. imports continue to outstrip exports, with the value of imports exceeding that of exports by 20% last year.
More momentum in the U.S. economy should drive increases in the real value of imports over the next two years, while the real value of exports will hold steady due to the economic conditions of our key trading partners along with the strong dollar. However, both the value of imports and exports as measured in current dollars will decline this year as a result of the stronger dollar, turning around with gains of approximately 5% next year.
LAEDC Kyser Center for Economic Research 4 International Trade Outlook 2015-16
The contribution of government expenditures to the overall economy will be minimal this year, coming mainly from state and local government spending. Spending cuts at the federal level occurred in each of the last four years (2011-2014). State and local spending also fell in 2011 and 2012, but edged up during the last two years. While federal spending will effectively be flat in 2015, state and local spending will grow by roughly 1%, providing an incremental boost to GDP growth. State and local spending will make a similar contribution to GDP growth next year, with a slight offset coming from a projected decrease in federal spending in 2016.
Regarding monetary policy, the Federal Reserve Bank (the Fed) ended its efforts to keep long-term rates low (quantitative easing or QE) last fall, but it continues to keep a key short-term rate, the federal funds rate, near zero. The Fed would like to move the fed funds rate to a more neutral position (the long-run average is 3%) so that this policy tool will be available to stimulate the economy in future years if needed.
Low inflation continues to be a concern but should approach the Fed’s target of approximately 2% over the next year as workers experience wage gains. Given the strength of the domestic economy, the Fed would be inclined to raise the fed funds rate, but an increase may undermine the impact of rate cuts that major U.S. trading partners have implemented to combat weakness in their own economies. As it balances these risks, the Fed has made no moves to raise rates. This may change later in the year as the domestic economy continues to heat up and if the rest of the world sees faster growth than expected.
The outlook for this year and next is one of ongoing improvement in the overall domestic economy and the labor market. GDP will grow by roughly 2.5% this year and 2.8% in 2016. The nation’s industries will see job gains, with much of the new job creation occurring in health care, leisure and hospitality, professional and business services, and construction. The unemployment rate will edge down toward the 5% threshold. With a tighter labor market, more workers will experience wage gains that will outpace the rate of inflation. These fundamentals imply a growing demand for imports, many of which will pass through the local ports. On the other side of the trade equation, growth in exports will depend on economic gains among our trading partners, and to a lesser extent, the value of the U.S. dollar.
LAEDC Kyser Center for Economic Research 5 International Trade Outlook 2015-16
L
OS
A
NGELES AND
S
OUTHERN
C
ALIFORNIA
O
UTLOOK
During the first quarter of 2015, the Southern California economy generally stayed on track with last year’s growth trajectory. The region added wage and salary jobs at a 2.5% rate compared with the same period last year. Employment in Los Angeles County also expanded by 2.5%, slightly outpacing the 2.3% rate of growth recorded in 2014. Orange County’s 3.5% job gain through March exceeded last year’s growth rate by a full percentage point. The Inland Empire maintained a steady course by matching its robust 2014 growth rate of 4.3% in the first quarter of this year, while in Ventura County, employment increased by 1.7% during the first quarter, virtually unchanged from its 1.8% growth rate in 2014.
Unemployment rates (not seasonally adjusted) across the region have declined consistently and substantially over the past year. In Los Angeles County, the unemployment rate fell from 8.5% in March 2014 to 7.2% this March. Orange County’s rate in March was the lowest in the region at 4.4%, down from 6.0% a year earlier. The Inland Empire experienced the biggest drop, with the unemployment rate falling from 8.9% to 6.5% over the same period. Finally, Ventura County’s unemployment rate in March was 5.4%, down from 7.1% a year earlier.
Southern California’s major private-sector industries generally added jobs in year-to-year terms during the first quarter of 2015. The region by and large saw the largest job gains in health care, leisure and hospitality, professional, scientific, and technical services, and construction. Finally, in a sign of improving public-sector prospects, government employment exhibited significant gains.
By March, Los Angeles and Orange counties along with the Inland Empire had all surpassed their pre-recession peak employment levels, with Ventura County expected to do so later this year. To the extent that lower unemployment rates signify a tightening labor market, wage growth should be forthcoming in the Southern California region. Personal income and taxable sales are generally on the rise across the region, while other indicators show strength in key industries such as the goods movement, entertainment, and significant manufacturing sectors.
Single digit percentage increases in home prices prevailed across the region, with March median prices ranging from a low of $250,000 in San Bernardino County to a high of $580,000 in Orange County, where the market is within $66,000 of its record high from the housing boom of the 2000s. Sales had been showing year-to-year declines for several months, but in March all of the counties in the region saw yearly sales increases. Price gains continue to be driven in part by very tight inventories of homes for sale. On the demand side, affordability is trending down while tight lending standards continue to be a concern. New home construction permits rose substantially year-to-date through March 2015, a good sign for the year as a whole. Like the nation, new home construction should finally take off in Southern California in 2015 and 2016, but nothing is a foregone conclusion at this point.
LAEDC Kyser Center for Economic Research 6 International Trade Outlook 2015-16
On the commercial real estate side, the office market still suffers from high vacancies, but vacancy rates are falling and absorption has increased. Meanwhile, industrial space is at a premium, with demand coming from distribution and warehousing, manufacturing, and other activities.
Overall, the region will continue to see job gains through this year and into 2016. Health care, leisure and hospitality, professional and business services, and government will realize the largest job gains, with substantial advances occurring in construction as well. Goods movement (transportation and warehousing together with wholesale trade) will also generate a significant number of new jobs over the next two years as trade overall, and port activity in particular, reach record high levels.
Los Angeles County: The monthly unemployment rate in Los Angeles County fell to 7.2% in March 2015, 1.3 percentage points below the year-ago rate of 8.5%. For reference, the monthly unemployment rate averaged 8.0% from 2000 through 2014, and has exceeded the state rate by an average of 0.3 percentage points over the same period.
Los Angeles County has seen steady job gains so far this year, with a 2.5% year-to-year increase (103,000) to 4.31 million jobs. Many of those gains were concentrated in a handful of industries, led by year-to-year increases in leisure and hospitality (21,600 jobs), health care (20,600 jobs), government (13,500 jobs), and retail trade (10,100 jobs). The important goods movement sector added 9,900 jobs compared with a year ago, while professional and business services added 8,200 jobs. A handful of industries experienced losses amounting to 3,600 jobs in all.
The county economy is expected to follow the nation and state with continued expansion this year and next, adding wage and salary jobs at roughly a 2% rate each year. The unemployment rate will average 7.2% this year and fall to 6.6% in 2016, the lowest in nine years. Job growth will occur across most industries, led by gains in health care, leisure and hospitality, professional and business services, and government. Personal income will grow by 4.5% to 5.0% over this year and next, benefiting from anticipated wage gains and contributing to improvements in consumer-facing industries across the county.
LAEDC Kyser Center for Economic Research 7 International Trade Outlook 2015-16
T
RADE ANDG
OODSM
OVEMENT INS
OUTHERNC
ALIFORNIAThis section reports on the performance of various international trade indicators for Southern California in 2014. More detailed data tables can be found in the appendix.
Trade Values by Customs District
The value of two-way trade in goods (exports plus imports for consumption) that flowed through the Los Angeles Customs District (LACD) in 2014 was $416.7 billion, an increase of 0.5% compared with 2013. The LACD consistently ranks first in the nation in terms of two-way trade value. Total two-way trade for the United States reached nearly $4.0 trillion in 2014 and was up by 3.0% over 2013. Two-way trade through the LACD amounted to 10.5% of total U.S. trade in goods.
Trade in the LACD is dominated by imports. In 2014, total imports for consumption edged up by 0.3% to $288.3 billion, a new record high. Exports also reached a new peak, growing by 1.0% to $128.2 billion. Two-way trade though all three of California’s customs districts (Los Angeles, San Francisco and San Diego) increased by 2.0% to $608.4 billion.
Trade Values by Port
International trade data also allow for the analysis of trade values moving through individual seaports and airports around the nation. There are two sets of data that track imports. The general imports data reflect the value of merchandise unloaded at the various ports. Merchandise might enter through one port, but clear customs at another. There are a number of reasons why this might occur, including the use of free trade zones for further processing of imported goods. In Los Angeles, the value of unloaded merchandise is significantly higher than the value of goods that actually clear customs locally, which are recorded as imports for consumption.
$0 $100 $200 $300 $400 $500 2004 2006 2008 2010 2012 2014
Los Angeles New York Laredo Detroit Houston
Value of International Trade
at Nation’s Leading Customs Districts
Billions USD
LAEDC Kyser Center for Economic Research 8 International Trade Outlook 2015-16
Based on the value of two-way trade (using general imports data), the Port of Los Angeles was number one in the nation with a 2014 total of $291.3 billion. This was equivalent to 7.3% of the total value of two-way trade for the U.S. The bulk of the cargo handled by the Port of Los Angeles was imported goods with a value of $251.3 billion, or 86% of the port’s two-way trade. Following Los Angeles was Laredo, Texas, with a total value of $199.1 billion, of which 54% were imports, and New York’s JFK Airport, where the ratio of imports to exports was nearly even.
The Port of Long Beach ranked ninth nationally in 2014 with two-way trade valued at $104.5 billion — imports accounted for 64% of the total. Los Angeles International Airport was eleventh with $96.3 billion. Similar to JFK, imports and exports were nearly balanced (although exports had a slight edge).
Container Activity
In a very profound way, the introduction of shipping containers in 1956 changed the world. These colorful, and now ubiquitous, metal boxes made shipping cheap and in doing so transformed the world’s economy. Today, shipping containers form the core of the global goods movement system. Container operations began at the Port of Los Angeles in 1959 and at the Port of Long Beach in 1962.1 By 2014, containerized cargo made up 91% of the total tonnage handled by the ports of Los Angeles and Long Beach.
In 2014, the ports of Los Angeles and Long Beach retained their status as the nation’s two largest ports in terms of container throughput. Containers are measured in 20-foot equivalent units or TEUs. The most commonly used containers are 40 feet long, which equates to two TEUs. The Port of Los Angles handled over 8.3 million TEUs in 2014, an increase of 6.0% over the year, while container throughput in Long Beach edged up by
1
At the Port of Los Angeles, Matson Navigation made its first shipment of 20 cargo containers in 1959, and Sea-Land Services began container operations at the Port of Long Beach in 1962.
0.0 2.0 4.0 6.0 8.0 10.0 2004 2005 2006 2007 2008 2009 2010 2011 2012 2013 2014
New York Los Angeles Long Beach Savannah Oakland
International Container Traffic
at Nation’s Major Ports
Millions of TEUs
LAEDC Kyser Center for Economic Research 9 International Trade Outlook 2015-16
1.3% to 6.8 million TEUs. Following Los Angeles and Long Beach in the rankings, and unchanged from their 2013 ranking, were New York, Savannah, and Oakland. Rounding out the top ten were Norfolk, Tacoma, Houston, Charleston and Seattle.
How do the San Pedro Bay ports stack up against ports elsewhere in the world? The roster of the world’s top container ports in 20132 (latest data available) showed:
Shanghai was the largest port in the world, handling 33.6 million TEUs, while number two Singapore reported 32.6 million TEUs.
Shenzhen (China) was third at 23.3 million TEUs, with Hong Kong right behind at 22.4 million. Hong Kong used to be China’s largest port but has lost share in recent years as more ships head north to China’s mainland ports.
Busan (Korea) was in fifth place, recording 17.7 million TEUs in 2013, followed by Chinese ports Ningbo-Zhoushan (17.3 million) and Qingdao (15.5 million).
Los Angeles/Long Beach combined claimed the number nine spot with 15.2 million TEUs.Chinese ports continue to grow in size and global importance, occupying seven of the top ten slots in the world port rankings in 2013.
West Coast Port Trends
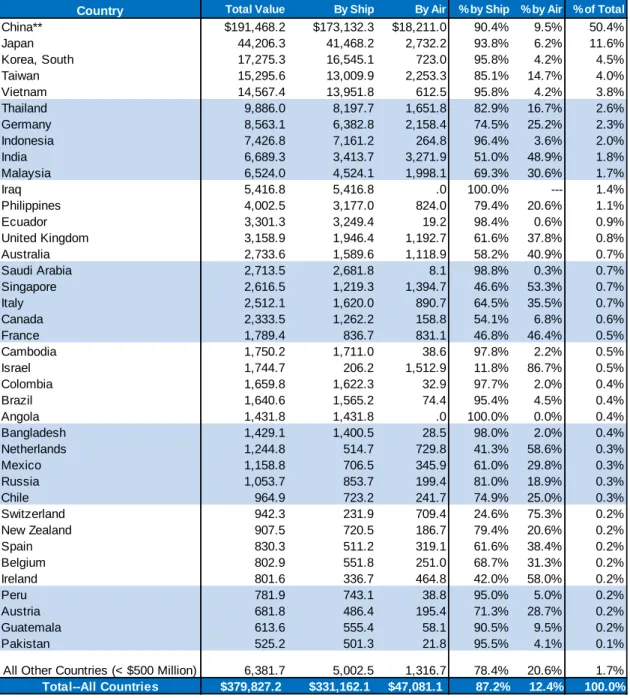
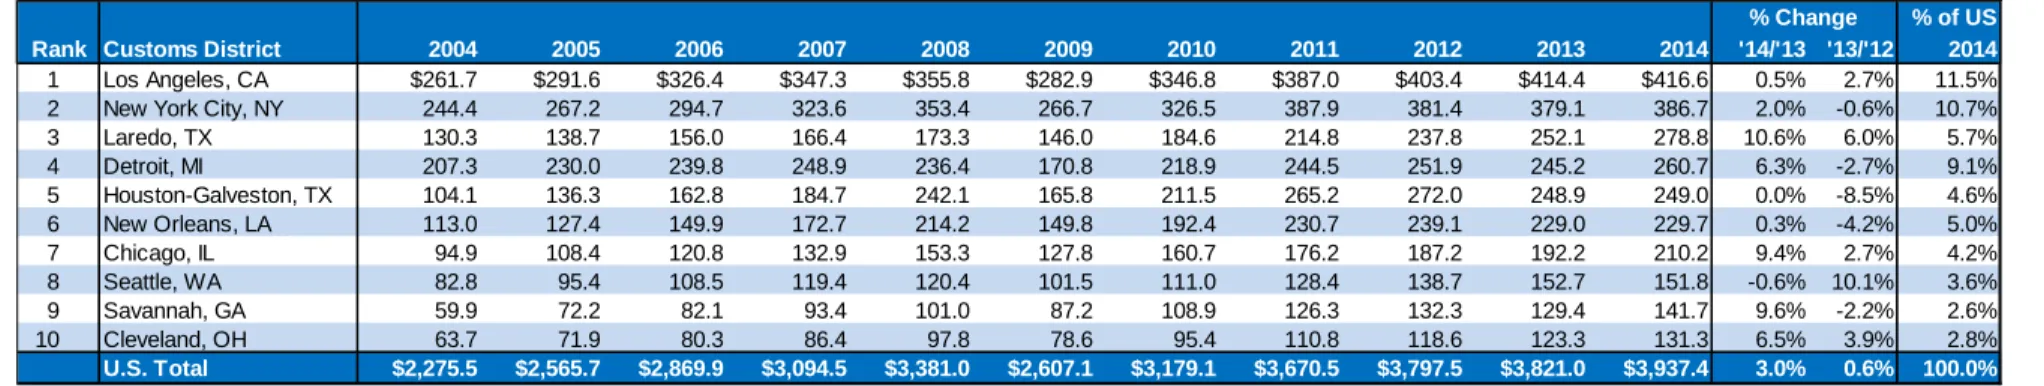
The Pacific Maritime Association compiles tonnage-based measures of activity at West Coast ports. In 2014, total tonnage moving through all West Coast ports combined increased by 1.9% (following a 1.6% decline in 2013) to 346.8 million short tons (2,000 lbs).
Cargo moving through Southern California’s ports increased by 1.7% to 221.0 million tons. Annual changes at the region’s ports ranged from a 0.4% decline at the Port of Long Beach to an increase of 6.6% at Port Hueneme. Tonnage at the Port of Los Angeles was up by 3.4%, and at the Port of San Diego, tonnage rose over the year by 3.7%. Ports in Northern California posted a 1.9% gain over the year with total tonnage increasing to 39.8 million tons, while ports in the Pacific Northwest recorded an overall gain of 2.5% to 86.0 million tons.
The shares of tonnage among all three regions was nearly unchanged from 2013 with 62.7% of total West Coast tonnage passing through Southern California, 11.5% through Northern California, and 24.8% through ports in the Pacific Northwest.
Alameda Corridor
The Alameda Corridor is a major component of the region’s intermodal infrastructure. The corridor consists of four dedicated rail lines running from the San Pedro Bay ports 20 miles north to the Burlington Northern Santa Fe and Union Pacific intermodal yards located east of downtown Los Angeles.
2
LAEDC Kyser Center for Economic Research 10 International Trade Outlook 2015-16
In 2014, the average daily number of trains running through the corridor was 47, up from 45 in 2013. This equates to an annual total of 17,061 trains. The number of trains making the 20 mile trip each day has increased steadily since 2009 (when the count fell to 36), but is still below the peak of 55 trains reached in 2006. Moving on these trains from the ports to the downtown rail yards were 4.7 million containers. An additional 525,000 containers made the trip around the corridor over the road by truck. The Alameda Corridor was designed to accommodate growth in port activity far into the future with a capacity of over 150 trains per day.
Airport Cargo Trends
Air cargo is generally a more costly mode of transportation. It is used primarily for smaller shipments or for lightweight, high-value products or in instances when quick delivery times are important. There are two ways by which goods are transported by air. In addition to the specialized international air cargo carriers, a large amount of freight moves alongside luggage in the cargo holds of international passenger flights. At Los Angeles International (LAX), more than half of all cargo that arrives and departs does so in the cargo bays of passenger planes.
In 2014, the value of general imports arriving in the LACD by air totaled $47.1 billion, while $331.2 billion moved by sea. Exports by air were valued at $46.1 billion in 2014 compared with waterborne exports valued at $78.6 billion. By volume, international air cargo tonnage moving through LAX increased by 6.9% in 2014 to 1,150,793 tons. The gain was the result of increases in both import tonnage (6.9%) and export tonnage (4.6%).
International cargo operations at the Los Angeles/Ontario International Airport (ONT) are considerably smaller than at regional giant LAX. However, the volume of international airfreight at ONT climbed by 8.2% in 2014 to 46,156 tons. Import activity at ONT was up by 9.7%, while export volume increased by 5.3%.
Product Trade Trends
The top export commodities moving out of the Los Angeles Customs District in 2014 were:
Computers, peripherals, machinery, appliances, and parts with a value of $17.1 billion; 64% of these items left by ship.
Electrical equipment, TVs, and electronic parts with a value of $14.2 billion; the majority of these products (73%) moved by air.
Aircraft, spacecraft, and parts had a value of $10.2 billion; 58% of which shipped by air.
Medical surgical and dental instruments with a value of $8.7 billion, with 77% moving as air cargo.Other high volume/high value commodities that were exported through the Los Angeles Customs District included natural pearls, precious stones, and metals ($8.2 billion); motor vehicles and parts ($7.1 billion); plastics ($6.2 billion); and meat and meat products ($3.4 billion).
LAEDC Kyser Center for Economic Research 11 International Trade Outlook 2015-16 Computers, Peripherals, Machinery, Appliances, Parts, 13.3% Electrical Equipment, TVs, Elecontric Parts, 11.1% Aircraft, Spacecraft, Parts, 7.9% Medical, Surgical, Dental Instruments, 6.8% Natural Pearls, Precious Stones, Metals, 6.4% Motor Vehicles, Parts,
5.5% Plastics, Items Made
of Plastic, 4.9% Meat and Meat
Products, 2.7% Miscellaneous Chemical Products,
2.6% Fruits and Nuts, 2.3%
Other, 36.5%
Source: U.S. Bureau of the Census
2014 Exports Through The L.A.C.D.
(Share of Total)
Total Exports: $128.2 Bn
2014 Imports Entering the L.A.C.D.
(Share of Total) Computers, Peripherals, Machinery, Appliances, Parts, 18.7% Electrical Equipment, TVs, Electronic Parts, 17.6% Motor Vehicles, Parts, 9.0% Refined Oil Products, Natural Gas, 5.2% Apparel, Accessories (Knit or Crochet), 4.8% Furniture, Bedding, Lamps, 4.0% Footwear, Parts, 3.9% Apparel, Accessories, (Not Knit or Crochet), 3.6% Toys, Games, Sports Equipment, 3.1% Plastics, Plastic Items, 2.7% Other, 27.4% Total Imports: $379.8 Bn
Source: U.S. Bureau of the Census The top import (general) commodities arriving into the Los Angeles Customs District in
2014 were:
Computers, peripherals, machinery, appliances, and parts with a value of $71.0 billion; 81% of these items arrived by ship.
Electrical equipment, TVs, and electronic parts valued at $66.7 billion; with 80% arriving as waterborne cargo.
Motor vehicles and parts valued at $34.3 billion; almost all of which arrived by sea.
Apparel and accessories with a value of $31.9 billion.Other significant import commodities include refined oil and natural gas ($19.8 billion); furniture, bedding, and lamps ($15.2 billion); and footwear ($14.7 billion).
It may seem counterintuitive that several of the top export commodity categories are the same as the top imports. It is actually quite common for a country to import and export the same category of goods. Product differentiation is one reason why this occurs. Countries may specialize in manufacturing different grades of a product based on available technologies and workforce skills and then trade to satisfy domestic demand for other levels of quality. Variations in transportation costs and seasonal factors may also play a role in trade patterns.
LAEDC Kyser Center for Economic Research 12 International Trade Outlook 2015-16 62.0% 59.9% 58.6% 18.5% 18.1% 16.5% 16.6% 19.2% 22.1% 2.9% 2.9% 2.8% 0 100 200 300 400 500 600 700 800 2004 2009 2014
Los Angeles County Orange County Inland Empire Ventura County
Trade-related Employment
with employment shares by county Wholesale Trade/Transportation/WarehousingSource: California EDD, LMID Employment, thousands
Trade in Services
The data in this report cover trade in goods and do not include international trade in services. Historically, it has been difficult to document and measure trade in services. Information is readily available at the national level, but much less so at the state or local level. Fortunately, the Brookings Institute has undertaken to remedy this situation at least in regard to exports. Exports of services from the Los Angeles metropolitan region in 2012 (latest data available) were valued at $37.4 billion compared with goods exports of $56.5 billion. That equates to a ratio of 39.9% services exports to 60.1% goods exports. For the U.S. as a whole, the ratio is 29.1% services to 70.9% goods.
The largest service-exporting industries in the Los Angeles metro area were:
Film and music industry royalties: $7.0 billion, or 7.4% of total exports from the Los Angeles metro area
Financial services: $2.8 billion, 3.0%
Management and consulting services; $2.6 billion, 2.8%
Entertainment services: $2.5 billion, 2.6%
IT royalties: $2.3 billion, 2.5%Additionally, regional universities and colleges export educational services when they enroll foreign students as do hospitals that admit foreign patients.
Goods Movement and Trade-related Employment:
International trade is one of the pillars of theSouthern California economy. One way to gauge the importance of trade to the regional economy is to examine employment trends. While trade-related employment can be found across a broad array of industries, including trade finance, insurance, logistics services, etc., jobs are concentrated in two primary industry sectors: transportation and warehousing, and wholesale trade (hereafter referred to as trade-related employment). In 2014, there were 638,000 jobs in these two industries across the Los Angeles five-county region.3 About 40% of these jobs were in transportation and warehousing while wholesale trade accounted for 60% of trade-related employment in the region.
3
Separate research by the LAEDC identifies key industry clusters in the local economy which are useful in describing and understanding the structure of the economy. The “trade” cluster is one of the largest industry clusters in the local economy. While cluster analysis more precisely defines industries, it is based on data (QCEW) that are published with a considerable lag. In this report, the goods movement and trade employment figures are based on industries that are a part of the trade cluster, but the data source is the Current
LAEDC Kyser Center for Economic Research 13 International Trade Outlook 2015-16 Wholesale Trade 2004 2009 2014 04-09 % ∆ 09-14 % ∆
Los Angeles County 213,400 204,800 223,500 -4.0% 9.1%
Orange County 82,600 79,600 81,700 -3.6% 2.6%
Inland Empire 45,700 49,000 59,000 7.2% 20.4%
Ventura County 12,000 12,100 13,000 0.8% 7.4%
Total: 353,700 345,500 377,200 -2.3% 9.2%
Transporation and Warehousing 2004 2009 2014 04-09 % ∆ 09-14 % ∆
Los Angeles County 148,600 138,200 150,600 -7.0% 9.0%
Orange County 25,700 23,900 23,300 -7.0% -2.5%
Inland Empire 51,300 61,000 81,800 18.9% 34.1%
Ventura County 4,700 4,300 5,100 -8.5% 18.6%
Total: 230,300 227,400 260,800 -1.3% 14.7%
Total Trade-related Employment 2004 2009 2014 04-09 % ∆ 09-14 % ∆
Los Angeles County 362,000 343,000 374,100 -5.2% 9.1%
Orange County 108,300 103,500 105,000 -4.4% 1.4%
Inland Empire 97,000 110,000 140,800 13.4% 28.0%
Ventura County 16,700 16,400 18,100 -1.8% 10.4%
Total: 584,000 572,900 638,000 -1.9% 11.4%
Source: California EDD, LMID CES Series
Over the 10 year period between 2004 and 2014, total trade employment increased by 9.2% across the region, but this figure masks growth divergences across the different counties. In Los Angeles, trade-related employment was up by 3.3% over this period, while in Orange County employment fell by 3.0%. In Ventura County, trade-related jobs increased by 7.1%. The most significant change occurred in the Inland Empire, where job counts surged by 45%. During the first quarter of 2015, trade-related employment continued to trend up, with a gain across the region of nearly 28,400 jobs compared with the first quarter of 2014. In the Inland Empire, trade-related employment increased by 13,600 jobs (10.1%), followed by Los Angeles with a gain of nearly 9,900 jobs (2.7%). The disparity in employment growth across the region led to a shift in shares of employment by county as well. In 2004, 62.0% of regional trade-related employment was concentrated in Los Angeles County, while the Inland Empire share was 16.6%. Over the last 10 years, Los Angeles, Orange and Ventura counties all gave up employment share to the Inland Empire. By 2014, the share of trade-related employment in Los Angeles fell to 58.6%, and in the Inland Empire it increased to 22.1%.
LAEDC Kyser Center for Economic Research 14 International Trade Outlook 2015-16
T
RADE-R
ELATEDI
NFRASTRUCTUREP
ROJECTSInfrastructure plays a crucial role in the flow of international trade. A highly developed intermodal transportation system is an important determinant of a country’s competitiveness. Efficient logistics reduce the cost of transportation and thus the costs of production. Time-to-market and delivery reliability depends as much on infrastructure within borders as transportation services between borders. The competitive advantage conferred on a region by a superior transportation system attracts investment and promotes economic growth.
Additionally, the development of new trade-related infrastructure and upgrades to existing facilities generate immediate jobs, especially in engineering and construction-related fields. After the completion of a project, the increased capacity and efficiency of the region’s goods movement system leads to the creation of new permanent jobs.
The goods movement and transportation industry in the United States is highly competitive. Although the ports of Long Beach and Los Angeles have long dominated U.S. maritime transportation services to and from Asia, they are increasingly subject to competition from Gulf and East Coast ports. The widening of the Panama Canal and the expanded use of routes from South East Asia through the Suez Canal will direct more traffic from Asia to the East Coast. Additionally, congestion stemming from inadequate infrastructure is causing some shippers to consider alternatives. Both ports are keenly aware of this and are investing billions in infrastructure improvements.
Recognizing that maintaining a modern goods movement system requires constant attention, public and private entities are investing in infrastructure projects designed to address current operating inefficiencies, capacity constraints, and environmental concerns related to Southern California’s goods movement system as well as anticipated future growth. The region’s competitive edge in international trade depends on sustaining a state-of-the-art transportation system, one that allows goods to move through the region efficiently and inexpensively, reducing congestion and minimizing environmental costs.
Port of Long Beach
The Port of Long Beach (POLB) is in the midst of a decade long, $4.5 billion capital improvement program. Although some projects utilize state, federal, and county transportation funds, revenues generated by port operations will support the bulk of the planned projects. The port’s capital improvement plan includes redevelopment of existing terminals, new wharfs, improvement of the railroad system, and a major bridge replacement.
The Middle Harbor redevelopment project will combine two outmoded shipping terminals into one modern and highly efficient container terminal. The nine-year program (started in 2011) is adding on-dock rail capacity (from 10,000 linear feet to 75,000), shore power hookups, and a new, longer wharf to move twice the cargo with half the air pollution. In 2012, Orient Overseas Container Line (OOCL) and its subsidiary, Long Beach Container Terminal (LBCT), signed a $4.6 billion, 40-year lease for the new Middle Harbor container terminal. This was the largest deal of its kind for any U.S. seaport. The
LAEDC Kyser Center for Economic Research 15 International Trade Outlook 2015-16
first phase of the $1.3 billion project is set to open by the end of 2015. The completed project will be fully operational by 2019 and is expected to create up to 14,000 permanent jobs in Southern California.
The POLB is also working on a multi-year renovation of the ITS Container Terminal located at Pier G. The port has added a new terminal administration and operations complex, a new maintenance and repair facility, and a new West Arrivals building. A new on-dock rail yard has also been completed (nearly doubling the terminal’s on-dock rail capacity). To date, more than $470 million in improvements have been completed, with more on the way in the form of additional shore power facilities and container space. Construction of the Gerald Desmond replacement bridge is currently underway. The new bridge will be higher to allow additional clearance for the newest generation of large cargo ships and wider to ease the flow of cars and trucks across the bridge. The new bridge is expected to be completed between late-2017 to mid-2018 at a cost of $1.3 billion.
Other infrastructure improvements at the Port of Long Beach include:
Green Port Gateway: The Green Port Gateway is the first of four rail construction projects underway. The $83.7 billion project will realign railroad tracks and roadway near Ocean Boulevard and add a Pier F Rail Support Yard to serve the Middle Harbor terminal. Anticipated completion is summer 2015. The Green Port Gateway is part of the larger San Pedro Bay Ports Rail Enhancement Program, which also includes several projects by the Port of Los Angeles and the Alameda Corridor Transportation Authority.
Anaheim Street Improvement: The POLB in partnership with the Long Beach Public Works Department has repaved Anaheim Street in West Long Beach from the Los Angeles River to Ninth Street to improve the driving surface for motorists. The project also includes improvements for sidewalks, bus stops, access for the disabled, and landscaping.
I-710 Corridor Project: The Long Beach Freeway (I-710) is a vital transportation artery, linking the Port of Long Beach (and the Port of Los Angeles) to regional intermodal facilities and the nation beyond. It serves both commuters and goods movement. The heavily traveled freeway is strained by population and economic growth and subject to serious congestion and safety issues. The Los Angeles County Metropolitan Transportation Authority (Metro) is heading a regional effort to study the potential environmental impacts of improvement projects on the freeway. The Port of Long Beach is one of several agencies funding the study.
On-Dock Rail Facility: Port staff is currently working a draft environmental impact report for a proposal to redevelop an existing rail yard on Pier B that will alleviate rail bottle necks in the port. The upgraded facility would allow additional on-dock rail use at the port, thus reducing truck trips.LAEDC Kyser Center for Economic Research 16 International Trade Outlook 2015-16 Port of Los Angeles
The Port of Los Angeles (POLA) is in the midst of a five-year, $1.0 billion capital improvement program that is focused on updating terminals and increasing rail capacity. A $370 million project to deepen the main channel to a depth of 53 feet was completed in March 2013.
Expansion plans include the terminal for TraPac (a unit of Japan-based Mitsui O.S.K. Lines). This five-year $325 million program will extend TraPac’s wharves, deepen adjacent water depths, add a new on-dock rail facility, install cranes, and upgrade 50 acres of backlands. Expected completion is late summer 2016. Three rail infrastructure projects totaling $252 million related to the TraPac expansion have already been completed.
Construction has begun on a berth-improvement project for Yang Ming Lines (a Taiwanese shipping company). The POLA is investing $122 million in improvements at the terminal, including construction of a new 1,260-foot wharf, deepening the waters around the wharf, and expanding the West Basin Intermodal Container Transfer Facility. Expected completion is mid-2016.
Last year, the POLA and the Army Corps of Engineers released a draft Environmental Impact Statement/Environmental Impact Report on a proposed $65 million berth improvement project by Yusen Terminals Inc. (YTI). The YTI plan calls for deepening the waters around the wharf and improving terminal facilities. The project will also involve additional on-dock rail capacity. The project is designed to be carried out in two phases commencing July 2015 with a scheduled completion date of May 2017.
The Southern California International Gateway (SCIG) is a planned near-dock rail facility jointly developed by the Port of Los Angeles and the BNSF Railroad. The $550 billion facility, as currently configured, would divert 1.5 million containers annually from trucks to trains through the Alameda Corridor, reducing freeway congestion and improving regional air quality. After eight years in the development process, the project was approved by the Los Angeles City Council in May 2013. However, court challenges brought by local opposition citing concerns over air quality and traffic impacts on adjacent Long Beach neighborhoods continue to block the start of construction.
In addition to these larger infrastructure projects, both ports carry out work on an ongoing basis to upgrade existing terminal facilities, over-the-road access, and security as well as environmental mitigation and community improvements.
Airports
Los Angeles World Airports (LAWA) is in the second year of its 2014-2018 Capital Improvement Plan, a planning document that lists proposed upgrades to LAWA facilities. Improvements worth nearly $4 billion are included in the plan for Los Angeles International (LAX). Planned projects will upgrade runways and terminals (including seismic improvements), mitigate traffic and congestion, and make improvements to IT systems, safety, security, and utilities. Recently completed projects include the Tom Bradley International Terminal Modernization ($737 million), the Terminal 6 Renovation
LAEDC Kyser Center for Economic Research 17 International Trade Outlook 2015-16
($238 million), the Runway Status Lights Project ($7.0 million) and the Central Utility Plant Replacement ($438 million).
Highways
The Schuyler Heim Bridge Replacement and SR-47 Expressway Project is a joint project between the Alameda Corridor Transportation Authority (ACTA) and Caltrans. The project is divided into two segments. Segment I is the replacement of the seismically deficient bridge over the Cerritos Channel. This portion of the project is currently under construction and is being administered by Caltrans. Segment II will provide an expressway connection between the north side of the Heim Bridge and Alameda Street at Pacific Coast Highway. The ACTA will administer Segment II, but as of the time of this writing, this phase of the project has been postponed indefinitely.
A New Era of Cooperation between the Ports of Los Angeles and Long Beach
The first two months of 2015 were marked by docks piled high with containers and a line of ships waiting at anchor outside the ports of Los Angeles and Long Beach unable to unload their cargo. Port operations slowed to a crawl as the International Longshore and Warehouse Union, which represents 20,000 dockworkers on the West Coast, and the Pacific Maritime Association, representing employers at 29 ports, continued protracted contract negotiations. Shortages of chassis also played a role creating the backlog of unloaded cargo, as did capacity constraints arising from the arrival of super-sized container ships that can discharge over 19,000 TEUs at one time.
By the end of February, the eight-month dispute between labor and management ended with a tentative agreement which was ratified in May. Meanwhile, the Port of Los Angeles brought together the three major chassis providers and a terminal operator and convinced all parties involved to share the chassis by creating a pool system. At the same time, the Port of Long Beach came up with a plan to augment usage during peak hours by creating a chassis fleet of its own.
Additionally, the Federal Maritime Commission (FMC), which regulates U.S. seaports, agreed to allow the two ports to work more cooperatively on projects to reduce congestion (e.g., adopting container tracking technologies to increase the speed at which a container can go from ship to terminal to rail or truck). The working agreement allows the ports to discuss and exchange information regarding railroad coordination, trucking issues, vessel operations, and other matters. Moving forward, the ports of Los Angeles and Long Beach will have the authority to collaborate on the funding, establishment, and construction of port-related transportation projects, port-related infrastructure projects, environmental programs, and safety and security programs. Prior to FMC approval, cooperation between the two ports was limited by antitrust statutes that required the two neighboring ports to compete for business. The two ports must still compete for business but will now be able to work together to reduce congestion and cargo delays, improve the transportation network, and reduce pollution caused by port-related activities.
LAEDC Kyser Center for Economic Research 18 International Trade Outlook 2015-16 $0.20 $0.30 $0.40 $0.50 $0.60 $0.70 $0.80 1q07 3q07 1q08 3q08 1q09 3q09 1q10 3q10 1q11 3q11 1q12 3q12 1q13 3q13 1q14 3q14 1q15
Los Angeles County Orange County Inland Empire
Warehouse/Distribution Rental
Rates
Source: Cushman and Wakefield
Rental rates per square foot
I
NDUSTRIALR
EALE
STATE ANDI
NTERNATIONALT
RADE4 IntroductionIndustrial real estate is a valuable link in the flow of international trade. While it is obvious that the ships, railways, and trucks used to transport goods are part of the goods movement system, the locations used by firms to sort, package, and consolidate products are an important part of that system as well. In this context, an adequate supply of industrial land with ready access to the region’s transportation infrastructure facilitates trade and enhances regional competitiveness.
As larger and larger container ships call on the local ports, the importance of having an adequate supply of industrial land has become strikingly apparent. The ports of Long Beach and Los Angeles have both deepened their channels and upgraded terminals to accommodate the world’s largest container ships. The remaining challenge posed by these super-sized ships is shore-side. Both ports are now scrambling to develop additional land for sorting and staging the 19,000 TEUs that can now arrive on a single ship.
Regional Outlook
Expanding international trade, increased industrial production, and rising consumer spending on retail goods (particularly e-commerce) are driving up demand for industrial space across the nation. Southern California has emerged as the clear front-runner and is leading the national industrial real estate market recovery. Industrial vacancy rates continue to fall across the region, and rental rates are firming in response to tight supply. Responding to declining inventories, dwindling rent concessions, and low interest rates, new speculative developments are on the rise. The Southern California industrial real estate market consists of three primary regions: Los Angeles County, the Inland Empire, and Orange County.
4 The LAEDC wishes to thank Cushman and Wakefield for providing the data cited in this section.
0.0% 2.0% 4.0% 6.0% 8.0% 10.0% 12.0% 14.0% 16.0% 1q07 1q08 1q09 1q10 1q11 1q12 1q13 1q14 1q15 Los Angeles County Orange County Inland Empire
Industrial Vacancy Rates
Source: Cushman and Wakefield Quarterly Averages
LAEDC Kyser Center for Economic Research 19 International Trade Outlook 2015-16 Los Angeles County: In addition to its position as the nation’s leading manufacturing
hub, the Los Angeles County industrial real estate market is driven by the region’s dominant position in the U.S. goods movement network. Los Angeles County is the second largest industrial market in the U.S. after Chicago and is currently enjoying strong market fundamentals: declining vacancy rates, rising rents, and a robust development pipeline.
During the first quarter of 2015, total leasing activity increased by 31.7% compared with the same period last year, while net occupancy gains totaled 2.1 million square feet, up by nearly 47% over the same period with gains in every submarket throughout the county. There were 10 leases for warehouse/distribution space signed in the first quarter ranging from 150,700 square feet up to 338,300 square feet.
The overall vacancy rate was 3.3% in the first quarter compared with the year-ago rate of 3.4%. At the end of the first quarter, 1.1 million square feet of new product was delivered. There was another 1.9 million square feet of new construction in the pipeline, which represents just 0.2% of existing space in the county.
There is a huge demand for Class A space, especially properties near mass distribution markets, ports, and freeways, but land for development is scarce and expensive. Because of high demand and tight supply, rental rates are trending up. In the first quarter, direct asking rents edged up by 1.7% to $0.61 per square foot from $0.60 during the first quarter of 2014. Since 2010, when rental rates fell to their lowest point, asking rents have increased by 22%. In spite of a lack of supply, high investor demand resulted in an increase in investment sales of 66.7% during the first quarter compared with a year ago. Los Angeles County is experiencing significant drops in vacancy and availability. With relatively little new product being delivered, the region will continue to see increases in net occupancy and higher rental rates.
Inland Empire: Historically, leasing activity in the Inland Empire is weakest in the first quarter. Not so this year. During the first three months of 2015, leasing activity topped 9.1 million square feet, an increase of 64% compared with the first quarter of 2014 and the third highest quarter of leasing activity on record. The three largest lease transactions during the first quarter ranged from 533,000 to 840,000 square feet, all of which were for warehouse/distribution space. Overall, the market achieved 3.3 million square feet in occupancy gains, marking 22 consecutive quarters of positive absorption.
During the first quarter of 2015, the industrial vacancy rate in the Inland Empire was 6.1%, unchanged from the same period a year ago. On the other hand, direct asking rents increased over the year by 7.3% to $0.44 per square foot. Long dominated by large big-box facilities, demand for smaller-sized product (less than 500,000 square feet) is starting to firm. At the end of the first quarter, there were 15 buildings under 500,000 square feet in development.
Strong demand for space increased total development activity in the Inland Empire to 17.6 million square feet of new product under construction, the most on record and up by 12% compared with the previous quarter. Moreover, the pace of new construction is not
LAEDC Kyser Center for Economic Research 20 International Trade Outlook 2015-16
expected to slow any time soon with both speculative and build-to-suit projects anticipated to break ground in the coming months. By the end of the second quarter, an additional 6.5 million square feet, including three speculative buildings of over 1.0 million square feet, will come on line. This large delivery of new product may temporarily raise vacancy rates, but strong demand will keep absorption positive and vacancy rates should drop back to current levels by year end.
As investor and user interest in new state-of-the-art facilities grows, large distribution hubs like the Inland Empire will see significant new construction over the next two years, while vacancy rates will continue to decline even with the addition of new supply.
Orange County: During the first quarter of 2015, the industrial vacancy rate in Orange County edged down to 3.8% from the year ago rate of 3.9%, making Orange County one of the tightest industrial real estate markets in the nation. Competition for limited space resulted in a decline in leasing activity of 19.5% over the year to 2.6 million square feet. The low vacancy rate and limited supply also led to net absorption turning negative by nearly 270,000 square feet in the first quarter of this year (down from 295,000 square feet of occupancy gains in the first quarter of 2014).
Despite the occupancy losses during the first quarter, the market has absorbed 5.8 million square feet of space since 2011, and there were seven significant new lease transactions recorded in the first quarter of 2015 ranging from over 110,000 square feet to nearly 400,000 square feet, all of which were for warehouse/distribution space. Countywide, rental rates have improved, rising by 2.7% in the first quarter to $0.75 per square foot compared with the same period a year ago. Activity varied widely by submarket. For example, in the Greater Airport area, the vacancy rate fell to 3.3%, the lowest in the county, and recorded an occupancy gain of 100,700 square feet.
Year-to-date first quarter, no new developments have been completed, but there is approximately 1.0 million square feet of new product under construction, most of which is located in North County with additional space being developed in the West County and South County submarkets. The lack of available space, particularly high quality buildings, is holding back leasing activity. That should turn around as new, modern space is delivered. Although the year got off to a rough start, occupancy gains are expected to return to the market as 2015 continues to unfold. With one of the lowest vacancy rates in the nation, asking rental rates and sales prices are expected to increase this year and next.
Outlook
The outlook for industrial space in Southern California is increasingly upbeat, especially for warehouse and distribution facilities. As the economy continues to expand, activity in the sectors that drive demand for industrial land will increase: international trade, retail trade/e-commerce, manufacturing, wholesaling, and distribution. Demand for new state-of-the-art distribution facilities is on the upswing, and interest in a broader range of property sizes is growing. Further improvements in vacancy and lease rates will depend on trade and manufacturing activity, but given the forecast for stronger economic growth over the next two years, conditions will support continuing improvement for Southern California’s industrial real estate markets.
LAEDC Kyser Center for Economic Research 21 International Trade Outlook 2015-16
I
NTERNATIONAL
O
UTLOOK
Global growth is expected to increase by 3.5% in 2015, accelerating to 3.8% in 2016. These figures, released in April by the International Monetary Fund (IMF), reflect a slight upward revision from their January projections based on a reassessment of prospects in China, Russia, the euro zone, and Japan. Weaker activity in some of the major oil exporting countries due to the sharp drop in oil prices was also factored into the revised IMF projections.
Among the major advanced economies, the United States is the clear front-runner. Unemployment continues to decline and inflation pressures are muted. The economy is projected to expand by 2.5% this year and by 2.8% in 2016 with domestic demand supported by job and income growth, lower oil prices, and a monetary policy stance that will remain accommodative even as interest rates begin to rise sometime later this year. The one area of weakness will be net exports due to the appreciation of the U.S. Dollar. There are some signs that growth in the euro zone may be on the upswing, but in Japan, two years of Abenomics have produced mixed results at best. China and many other emerging market economies, which have previously enjoyed rapid expansion, are also struggling with slower growth. Even so, emerging market and developing economies will be responsible for 70% of global growth in 2015.
In the U.S., the Federal Reserve is widely expected to begin normalizing monetary policy sometime this year via interest rate hikes. Elsewhere, many advanced economies have turned to more accommodative monetary policy to counter slow growth and/or falling rates of inflation. In contrast, central banks in some developing nations that have experienced significant currency depreciation have had to raise interest rates in an attempt to stabilize their currencies. The divergence in the outlook for monetary policy between the United States and the world’s other large economies has caused the U.S. Dollar to strengthen vis-à-vis most major currencies. As a consequence, global trade and investment flows have been disrupted.
Regions
Euro zone: The euro zone economy has struggled over the past two years — real GDP grew by only 0.9% in 2014 — but the region appears to be getting back on track. The priority now is to boost growth and inflation while ensuring fiscal stability. The sharp drop in petroleum prices has led to stronger growth in real incomes, and that should support an increase in consumer spending. Likewise, the decline in the value of the euro will boost growth in exports. Private investment remains weak due to persistent economic slack, policy uncertainty, and tight credit conditions. Recent developments in Greece and Russia have dampened confidence. The drop in oil prices also contributed to a decline in the inflation rate. In order to forestall a deflationary spiral, the European Central Bank has undertaken its own program of quantitative easing. Although risks of prolonged low growth and low inflation remain, the euro zone is expected to grow by 1.5% in 2015, accelerating slightly to 1.6% in 2016.
LAEDC Kyser Center for Economic Research 22 International Trade Outlook 2015-16 Asia and Pacific: Growth in the Asia Pacific Region is moderating, but it is still expected
to outperform the rest of the world over the near- to mid-term. While the Chinese economy is shifting to a more sustainable pace, growth is projected to pick up elsewhere in the region. This reflects the boost from lower world oil prices, stronger demand for the region’s exports, and generally accommodative monetary policy.
Real GDP growth in China has slowed over the past few years. The 7.4% annual increase in 2014 was the slowest in more than 20 years. Much of the growth in China after the global financial crisis was fueled by excessive borrowing. But now, home prices are falling, and both residential and nonresidential investment is declining. To some extent, the slowdown is by design. The Chinese government recognizes that the high growth rates of recent years, fueled in part by excesses in real estate, credit, and investment, are unsustainable. In addition to financial sector reforms, there is an effort underway to move the economy to one that is more consumer-driven and less dependent on investment and exports.
The Chinese government has announced a target GDP growth rate of 7.0% in 2015. The IMF is forecasting 6.8% this year and 6.3% in 2015. There has been a lot of talk about a “hard landing” in China, but it seems more likely that the restructuring of the economy will be well managed. Still, slower growth in China has a number of important implications for the rest of emerging Asia, which depends on China to absorb much of its export volume. Although the South Korean economy lost momentum toward the end of 2014, GDP grew at an annual rate of 3.3%, compared with 3.0% in 2013. Business investment spending has been a drag on the economy, with Korean firms keeping a close eye on the direction of trade. Korea’s two largest trading partners are China and Japan, both of which have been on a slowing trend. A falling rate of inflation prompted the Korean central bank to cut interest rates twice last year and again in March in order to encourage price growth and to help increase consumer spending by making it easier for households to borrow. Amidst concerns that Korean exports are becoming less competitive, the government is attempting to move the economy from a fast-follower model to that of a first mover by concentrating on original R&D and innovation in the advanced manufacturing, aerospace, and pharmaceutical sectors, among others. Korean GDP is forecast to match last year’s growth rate of 3.3% in 2015 and accelerate to 3.5% in 2016.
The Taiwanese economy has experienced continuous growth since the end of the global financial crisis but at rates slower than achieved over the previous decade. In 2014, the economy expanded by 3.7%. With 25% of its exports going to China, growth in Taiwan will be constrained by the slowdown of its largest trading partner. Even so, GDP growth is expected to reach 3.8% in 2015 and 4.1% in 2016.
Latin America and the Caribbean: Last year was the fourth consecutive year in which regional growth slowed, coming in at just 1.3%. Declines in private business investment led the downturn. In the commodity exporting nations of the region, falling prices are widening current account deficits. Elsewhere, countries that are net importers of oil and other commodities are getting a boost from lower prices. At the same time, solid U.S. growth is providing an outlet for other types of exports from the region. In Brazil, business
![TABLE 3B: Total Tonnage at the West Coast Ports Tonnage [thousands] in short tons [2,000 lbs]](https://thumb-us.123doks.com/thumbv2/123dok_us/1765471.2750718/50.1188.103.885.401.545/table-total-tonnage-west-coast-ports-tonnage-thousands.webp)
![TABLE 4: Comparative Tonnage of Major West Coast Ports Tonnage [thousands] in short tons [2,000 lbs]](https://thumb-us.123doks.com/thumbv2/123dok_us/1765471.2750718/52.1188.94.1015.208.391/table-comparative-tonnage-major-coast-ports-tonnage-thousands.webp)