Using Data Fusion and Web Mining to Support Feature Location in Software
Meghan Revelle, Bogdan Dit, and Denys Poshyvanyk
Department of Computer Science The College of William and Mary Williamsburg, Virginia, USA {meghan, bdit, denys}@cs.wm.edu
Abstract—Data fusion is the process of integrating multiple sources of information such that their combination yields better results than if the data sources are used individually. This paper applies the idea of data fusion to feature location, the process of identifying the source code that implements specific functionality in software. A data fusion model for feature location is presented which defines new feature location techniques based on combining information from textual, dynamic, and web mining analyses applied to software. A novel contribution of the proposed model is the use of advanced web mining algorithms to analyze execution information during feature location. The results of an extensive evaluation indicate that the new feature location techniques based on web mining improve the effectiveness of existing approaches by as much as 62%.
Keywords-feature location; data fusion; information retrieval; dynamic analysis; web mining
I. INTRODUCTION
Software systems are constantly changing and evolving in order to eliminate defects, improve performance or reliability, and add new functionalities. When the software engineers who maintain and evolve a system are unfamiliar with it, they must go through the program comprehension process. During this process, they obtain sufficient knowledge and understanding of at least the part of the system to which a change is to be made. An important part of the program comprehension process is feature or concept location [1, 2], which is the practice of identifying the source code that implements a functionality, also known as a feature1. Before software engineers can make changes to a feature, they must first find and understand its implementation.
For software developers who are unfamiliar with a system, feature location can be a laborious task if performed manually. In large software systems, there may be hundreds of classes and thousands of methods. Finding even one method that implements a feature can be extremely challenging and time consuming. Fortunately for software engineers in this situation, there are feature location techniques that automate, to a certain extent, the search for a feature’s implementation.
Existing feature location techniques use different tactics to find a feature’s source code. Approaches based on
1
A feature is sometimes also referred to as a concept or a concern. In this work, the term “feature” is used.
information retrieval (IR) leverage the fact that identifiers and comments embed domain knowledge to locate source code that is textually similar to a query describing a feature [24]. Dynamic feature location techniques collect and analyze execution traces to identify a feature’s source code based on set operations [31] or probabilistic ranking [1]. Static approaches to feature location rely on following or analyzing structural program dependencies [6, 27].
The state of the art in feature location involves integrating information from multiple sources. Researchers have recognized that combining more than one approach to feature location can produce better results than standalone techniques [11, 13, 18, 22, 25, 33]. Generally in these combined approaches, information from one source is used to filter results from another. For instance in the SITIR (SIngle Trace and Information Retrieval) approach to feature location [22], a single execution trace is collected, and then IR is used to rank only the methods that appear in the trace instead of all of the system’s methods. Thus, dynamic analysis is used as a filter to IR, and filtering is one way to combine information from several sources to perform feature location. Instead of using filtering, PROMESIR (Probabilistic Ranking of Methods Based on Execution
Scenarios and Information Retrieval) [25] combines the opinions of two “experts” (scenario-based probabilistic ranking [1] and IR [24]) using an affine transformation.
The idea of integrating data from multiple sources is known as data fusion. The sources of data have their individual benefits and limitations, but when they are combined, their drawbacks can be minimized and better results can be achieved. Data fusion is used heavily in sensor networks and geospatial applications to attain better results in terms of accuracy, completeness, or dependability. For example, the position of an object can be calculated using an inertial navigation system (INS) or global positioning system (GPS). An INS continuously calculates the position of an object with relatively little noise and centimeter-level accuracy, though over time the position data will drift and become less accurate. GPS calculates position discretely, has relatively more noise, and meter-level accuracy. However, when data from an INS and GPS are used together in the proper proportions, the GPS data can correct for the drift in the INS data. Thus the fusion of INS and GPS data produces more accurate and dependable results than if they were used separately.
Inspired by the benefits of using data fusion to integrate multiple sources of information, this work applies data
fusion to feature location. This paper presents a data fusion model for feature location that is based on the idea that combining data from several sources in the right proportions will be effective at identifying a feature’s source code. The model defines different types of information that can be integrated to perform feature location including textual, execution, and dependence. Textual information is analyzed by IR, execution information is collected by dynamic analysis, and dependencies are analyzed using web mining. Applying web mining to feature location is a novel idea, but it has been previously used for other program comprehension tasks, such as identifying key classes for program comprehension [32], ranking components in a software repository [19], and recommending related API calls [29]. Software lends itself well to web mining approaches, because like the World Wide Web, software can be represented by a graph, and that graph can be mined for useful information such as the source code that implements a feature.
This paper makes the following contributions:
• A data fusion model for feature location is defined that integrates different types of information to locate features using IR, dynamic analysis, and web mining algorithms.
• An extensive evaluation of the feature location techniques defined in the model.
• Results that show that the new feature location techniques have better effectiveness than the state of the art in feature location. Statistical analysis indicates that this improvement is significant.
In addition, all of the data used in the evaluation is made freely available online2, and other researchers are welcome to replicate this work. Making the data available will help facilitate the creation of feature location benchmarks.
The remainder of this paper is structured as follows. Section II introduces the data fusion model for feature location. Section III outlines the evaluation methodology, and Section IV discusses the results. Related work is summarized in Section V, and Section VI concludes.
II. ADATA FUSION MODEL FOR FEATURE LOCATION
The feature location model presented here defines several sources of information, the analyses used to derive the data, and how the information can be combined using data fusion. A. Textual Informaion from Information Retrieval
Textual information in source code, represented by identifier names and internal comments, embeds domain knowledge about a software system. This information can be leveraged to locate a feature’s implementation through the use of IR. Information retrieval is the methodology of searching for textual artifacts or for relevant information within artifacts. IR works by comparing a set of artifacts to a query and ranking these artifacts by their relevance to the query. There are many IR techniques that have been applied in the context of program comprehension tasks such as the Vector Space Model (VSM) [28], Latent Semantic Indexing
2 http://www.cs.wm.edu/semeru/data/icpc10-data-fusion/
(LSI) [10], and Latent Dirichlet Allocation (LDA) [4]. This work focuses on evaluating LSI for feature location, and the notation IRLSI is used to denote that LSI is the IR method
used to instantiate information retrieval analysis in the model. IRLSI follows five main steps [24]: creating a corpus,
preprocessing, indexing, querying, and generating results.
Corpus creation. To begin the IR process, a document granularity needs to be chosen so a corpus can be formed. A document lists all the text found in a contiguous section of source code such as a method, class, or package. A corpus consists of a set of documents. For instance in this work, a corpus contains method-level granularity documents that include the text of each method in a software system.
Preprocessing. Once the corpus is created, it is preprocessed. Preprocessing involves normalizing the text of the documents. For source code, operators and programming language keywords are removed. Additionally, identifiers and other compound words are split (e.g., “featureLocation” becomes “feature” and “location”). Finally, stemming is performed to reduce words to their root forms (e.g., “stemmed” becomes “stem”).
Index the corpus. The corpus is used to create a term-by-document matrix. The matrix’s rows correspond to the terms in the corpus, and the columns represent documents (i.e., source code methods). A cell mi,j in the matrix holds a
measure of the weight or relevance of the ith term in the jth document. The weight can be expressed as a simple count of the number of times the term appears in the document or as a more complex measure such as term frequency-inverse-document frequency. Singular Value Decomposition (SVD) [28] is then used to reduce the dimensionality of the matrix by exploiting the co-occurrence of related terms.
Issue a query. A user formulates a natural language query consisting of words or phrases that describe the feature to be located (e.g., “print file to PDF format”).
Generate the results. In the SVD model, each document corresponds to a vector. The query is also converted to a vector, and then the cosine of the angle between the two vectors is used as a measure of the similarity of the document to the query. The closer the cosine is to one, the more similar the document is to the query. A cosine similarity value is computed between the query and each document, and then the documents are sorted by their similarity values. The user inspects the ranked list, generally only reviewing the top results to decide if they are relevant to the feature.
B. Execution Information from Dynamic Analysis
Execution information is gathered via dynamic analysis, which is commonly used in program comprehension [9] and involves executing a software system under specific conditions. For feature location, these conditions involve running a test case or scenario that invokes a feature in order to collect an execution trace. For example, if the feature of interest in a text editor is printing, the test case or scenario would involve printing a file. Invoking the desired feature during runtime generates a feature-specific execution trace.
Most existing feature location techniques that employ dynamic analysis use it to explicitly locate a feature’s
implementation by analyzing patterns in traces post-mortem [1, 13, 25]. The model presented in this work takes a different approach to applying dynamic analysis for feature location. Information collected from execution traces is combined with other data sources instead of being analyzed itself. Execution information is integrated with other information by using it as a filter, as in the SITIR approach [22] where methods not executed in a feature-specific
scenario are pruned from the ranked list produced by IRLSI.
The model in this work takes a similar approach to using execution information (denoted as “Dyn”) as a filter. By extracting information from a single trace, the sequence of method calls can be used to create a graph where nodes represent methods and edges indicate method calls. This graph is a subgraph of a static call graph that only contains methods that were executed. The edges in the graph can be weighted or weightless. When weights are used, they can be derived from execution frequency information captured by a trace. For instance, Figure 1 shows a portion of an execution trace where method x calls method y two times and calls method z three times. This trace is represented by a graph where the weight of the edge from x to y is 2/5, and the weight of the edge from x to z is 3/5. Alternatively, instead of normalizing the edge weights, the values on the edge from x to y can be 2, and the weight of the edge from x to z can be 3. When dynamic execution information is used in either of these ways, it is denoted with the “freq”subscript, referring to the fact that execution frequency information is used. If no weights are placed on the edges of a graph, this is denoted with the “bin” subscript, referring to the fact that only binary information about a method’s execution is used.
C. Dependence Information from Web Mining
Web mining is a branch of data mining that concentrates on analyzing the structure of the World Wide Web (WWW) [8]. The structure of the WWW can be used to extract useful information. For instance, search engines use web mining to rank web pages by their relevance to a user’s query. Web mining algorithms view the WWW as a graph. The graph is constructed of nodes, which represent web pages, and edges, which represent hyperlinks between pages.
Software can also be represented as a graph – a call graph. Nodes represent methods, and edges correspond to relationships or dependencies among methods. Therefore, web mining algorithms can be naturally applied to software to discover useful information from its structure, such as key
classes for program comprehension [32], component ranks in software repositories [19], and statements that can be refined from concept bindings [21]. This work explores whether web mining can also be applied to feature location, either as a standalone technique or used as a filter to an existing approach to feature location. Two web mining algorithms are discussed below.
1) HITS
The Hyperlinked-Induced Topic Search (HITS) [20] algorithm identifies hubs and authorities from a graph representing the WWW. Hubs are pages that have links to many other pages that contain relevant information on a topic. These pages with pertinent information are known as authorities. Good hubs point to many good authorities, and good authorities are pointed to by many hubs. Thus, hubs and authority are defined in a mutually recursive way. Let hp
stand for the hub value of page p and ap represent the
authority value of p. The hub and authority values of p are defined in Equation 1, where i is a page connected to p, and n is the total number of pages connected to p.
1 n i p i
h
a
==
∑
and 1 n i p ia
h
==
∑
(1)To start, HITS initializes all hub and authority values to one. Then, the algorithm is run for a given number of iterations (or until the values converge), during which the hub and authority values are updated according to Equation 1. The values are normalized after each iteration.
A slight variation of the HITS algorithm allows weights to be added to the links between pages. Weighted links denote relative importance. Let wi→p represent the weight of
the link between i and p. The formulas for hubs and authorities now become:
1 n p i p i i
h
w
→a
==
∑
⋅
and 1 n i p p i ia
w
→h
==
∑
⋅
. (2)When using software to construct a graph instead of the WWW, the nodes and edges can be determined from a static call graph or dynamic execution trace. This work concentrates on constructing graphs from execution traces and leaves the exploration of statically-constructed graphs for future work. Nodes in the graph correspond to methods, and edges represent dependencies (calls) between methods. If weights are placed on the graph edges, dynamic execution frequency can be used3. Otherwise, if no weights are used, binary dynamic information is used.
Using either frequency or binary dynamic information to construct a method call graph, the HITS algorithm can potentially be used for feature location in two ways. First, the methods in a graph can be ranked by extending the concepts of hubs and authorities to source code. Hub methods are those that call upon many other methods, while authority methods are called by a large number of other methods. Intuitively, hubs do not perform much functionality themselves but delegate to others, and authorities actually perform specific functionalities. Ranking
3 The HITS algorithm does not require edge weights to be normalized, so
the execution frequency values are used without normalization.
Figure 1. An example of an execution trace translated into a graph with execution frequency weights on the edges. Xe is the entry to method X, and
Xr is the return from method X.
methods in a software system by either their hub or authority values is a novel feature location technique. The notation WMHITS(h,freq), WMHITS(h,bin), WMHITS(a,freq), WMHITS(a,bin) is
used, where WM refers to web mining, HITS(h) and HITS(a) stand for hub and authority scores respectively, and the “freq” and “bin” subscripts denote how dynamic information is used to weight the graph’s edges.
The second way in which the HITS algorithm can be used for feature location is as a filter. Instead of directly using the hub and authority values to rank methods, those rankings can be combined with other information. The intuition is that the methods with high hub values will be methods that are more general purpose in nature and not specific to a feature, i.e., methods in “god” classes. Conversely, methods with high authority values may be highly relevant to a feature. Therefore, top-ranked hub methods and bottom-ranked authority methods can be filtered from the results of other techniques such as IRLSIDynbin. The “top” superscript is used
to represent when the top-ranked methods are filtered, and “bottom” superscriptstands for the case when the bottom-ranked methods are filtered. The evaluation investigates the best method of filtering by hub and authority values.
2) PageRank
PageRank [5] is a web mining algorithm that estimates the relative importance of web pages. It is based on the random surfer model which states that a web surfer on any given page p will follow one of p’s links with a probability of β and will jump to a random page with a probability of
(1-β). Generally, β = 0.85. Given a graph representing the WWW, let N be the total number of pages or nodes in the graph. Let I(p) be the set of pages that link to p, and O(p) be the pages that p links to. PageRank is defined by the equation
( )
1
( )
( )
|
( ) |
j I pPR j
PR p
N
O j
β
β
∈−
=
+
∑
. (3)PageRank’s definition is recursive and must be iteratively evaluated until it converges.
Like HITS, PageRank can be applied to software if a system is represented by a graph where nodes are methods executed in a trace and edges are method calls. In the PageRank algorithm, edges always have weights. When binary execution information is used, the weight of all the outgoing edges from a node is equally distributed among those edges (e.g., if x has three outgoing edges, their weight will each be 1/3). Otherwise, execution frequency information can be used for the edge weights. PageRank requires normalized values, so the execution frequency values are normalized, as in the example in Figure 1.
Like HITS, PageRank can be used to directly rank and
locate a feature’s relevant methods or as a filter to other sources of information. When used directly as a feature location technique, it is denoted as WMPR(freq) or WMPR(bin),
referring to the use of frequency or binary execution information to create a graph. PageRank, applied to software, is an estimate of the global importance of a method within a system. Therefore, methods that have global significance within a system will be ranked highly. Methods relevant to a specific feature are unlikely to have high global importance, so they may be ranked lower in the list. The evaluation examines PageRank as a feature location technique.
Since PageRank identifies methods of global importance, instead of using it as a standalone feature location technique, it can be used as a filter to be combined with other sources of information. Pruning the top-ranked PageRank methods from consideration may produce better feature location results. The “top” and “bottom” superscripts denote that the top and bottom results returned by PageRank are filtered. The evaluation explores the best way to use PageRank as a filter.
D. Fusions
Data fusion combines information from multiple sources to achieve potentially more accurate results. For feature location, this model has defined three information sources derived from three types of analysis: information retrieval, execution tracing, and web mining. This subsection outlines the feature location techniques instantiated within the model that are evaluated. Table I lists all of the techniques.
Information Retrieval via LSI. This feature location technique, introduced in [24], ranks all methods in a software system based on their relevance to a query. Only one source of information is used, so no data fusion is performed. This approach is referred to as IRLSI.
Information Retrieval and Execution Information. The idea of fusing IR with dynamic analysis is used by the SITIR approach and is the state of the art of feature location techniques that rank program elements (e.g., methods) by their relevance to a feature. A single feature-specific execution trace is collected. Then, LSI ranks all the methods in the trace instead of all the methods in the system. Thus dynamic information is used as a filter to eliminate methods that were not executed and therefore are less likely to be relevant to the feature. In this work, this technique is abbreviated IRLSIDynbin and represents the baseline for
comparison. Note that the IRLSIDynfreq approach is not
evaluated. It filters the same methods as IRLSIDynbin because
it only matters whether a method was executed or not.
Web Mining. The HITS and PageRank algorithms can be used as feature location techniques that rank all methods
TABLE I. THE FEATURE LOCATION TECHNIQUES EVALUATED.
IR & Dynamic
Analysis Web Mining IR, Dyn, & HITS*
IR, Dyn, & PageRank*
IRLSI WMHITS(h,bin) WMHITS(h,freq) IRLSIWMHITS(h, bin)top IRLSIWMHITS(h, bin)bottom IRLSIWMPR(bin)top
IRLSIDynbin WMHITS(a,bin) WMHITS(a,freq) IRLSIWMHITS(h, freq)top IRLSIWMHITS(h, freq)bottom IRLSIWMPR(bin)bottom
WMPR(bin) WMPR(freq) IRLSIWMHITS(a, bin)top IRLSIWMHITS(a, bin)bottom IRLSIWMPR(freq)top
IRLSIWMHITS(a, freq)top IRLSIWMHITS(a, freq)bottom IRLSIWMPR(freq)bottom
in an execution trace using either binary or frequency information. Web mining has not been applied to feature location before; therefore all of the approaches involving web mining are novel. Table I lists all the feature location techniques based on web mining.
Information Retrieval, Execution Information, and Web Mining. Applying data fusion, IR, execution tracing, and web mining can be combined to perform feature location. This work proposes the use of web mining as a filter to IRLSIDynbin’s results in order to eliminate methods
that are irrelevant. Each web mining algorithm can be applied to binary or execution frequency information. If the results returned by a standalone web mining technique rank methods that are relevant to a feature at the top of the list, then methods at the bottom of the list can be filtered from consideration. However, since the standalone web mining techniques are based on dynamically-constructed call graphs, the resulting rankings could be similar across many different features, meaning the top-ranked results are not relevant to the feature. In this case, those top-ranked results are eliminated from consideration. For example, IRLSIWMHITS(h, bin)top is a feature location technique that uses IR to rank all of
the executed methods by their relevance to a query. A graph is constructed using binary execution information from a trace, and the methods in the graph are ranked according to their HITS hub values. Finally, the top methods from the HITS hub rankings are pruned from IRLSIDynbin’s results. In
this technique, methods with high HITS hub values are filtered. Table I lists all of the feature location techniques
that filter IRLSIDynbin’s results using HITS or PageRank.
III. EXPERIMENTAL EVALUATION
This section describes the design of a case study to assess the feature location techniques defined by the data fusion model. The evaluation seeks to answer the following research questions:
RQ1 Does combining a web mining algorithm with an existing approach to feature location improve its effectiveness?
RQ2 Which web-mining algorithm, HITS or PageRank,
produces better results?
The answers to these research questions will help reveal the best instantiation of the data fusion model.
A. Systems and Benchmarks
The evaluation was conducted on two open source Java software systems: Eclipse and Rhino. Eclipse4 is an integrated development environment. Version 3.0 has approximately 10K classes, 120K methods, and 1.6 million lines of code. Forty-five features from Eclipse were studied. The features are represented by bug reports submitted to Eclipse’s online issue tracking system5. The bug reports are change requests that pertain to faulty features. The bug reports provide steps to reproduce the problem, and these
4
http://www.eclipse.org/ 5
https://bugs.eclipse.org/
steps were used as scenarios to collect execution traces. Table II lists information about the size of the collected traces. The short descriptions in the bug reports were used as the queries for IR. The bug reports also have submitted patches that detail the code that was changed to fix the bug. The modified methods are considered to be the “gold set” of methods that implement the feature. Since their code had to be altered to correct a problem with the feature, they are likely to be relevant to the feature. These gold set methods are used as the benchmark to evaluate the feature location techniques. This way of determining a feature’s relevant methods from patches has also been used by other researchers [22, 23, 25].
The other system evaluated is Rhino, a Java implementation of JavaScript. Rhino6 version 1.5 consists of 138 classes, 1,870 methods, and 32,134 lines of code. Rhino implements the ECMAScript specification7. The Rhino distribution comes with a test suite, and individual test cases in the suite are labeled with the section of the specification they test. Therefore, these test cases were used to collect execution traces for 241 features. The text from the corresponding section of the specification was used to formulate IR queries. For the gold set benchmarks for each feature, the mappings of source code to features made available by Eaddy et al. [12] were used. They considered the sections of the ECMAScript documentation to be features and associated code with each following the prune dependency rule [12] which states: “A program element is relevant to a [feature] if it should be removed, or otherwise altered, when the [feature] is pruned.” Their mappings are made available online8 and have been used in several other research evaluations [11, 12].
The position of the first relevant method from the gold set was used to evaluate the feature location techniques and is referred to as the effectiveness measure [25]. Techniques that rank relevant methods near the top of the list are more effective because they reduce the number of false positives a developer has to consider. The effectiveness measure is an accepted metric to evaluate feature location techniques. It is
6 http://www.mozilla.org/rhino/ 7 http://www.ecmascript.org/ 8 http://www.cs.columbia.edu/~eaddy/concerntagger/
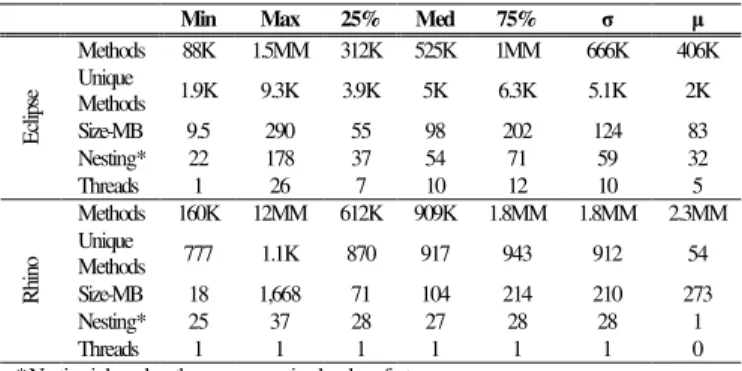
TABLE II. DESCRIPTIVE INFORMATION ON THE EXECUTION TRACES. THE COLUMNS REPRESENT THE MINUMUM, MAXIMUM, LOWER QUARTILE, MEDIAN, UPPER QUARTILE, MEAN, AND STANDARD DEVIATION.
FOURTY-FIVE TRACES WERE COLLECTED FOR ECLIPSE, AND 241 FOR RHINO.
Min Max 25% Med 75% σ µ
Methods 88K 1.5MM 312K 525K 1MM 666K 406K Unique Methods 1.9K 9.3K 3.9K 5K 6.3K 5.1K 2K Size-MB 9.5 290 55 98 202 124 83 Nesting* 22 178 37 54 71 59 32 E cl ip se Threads 1 26 7 10 12 10 5 Methods 160K 12MM 612K 909K 1.8MM 1.8MM 2.3MM Unique Methods 777 1.1K 870 917 943 912 54 Size-MB 18 1,668 71 104 214 210 273 Nesting* 25 37 28 27 28 28 1 R hi no Threads 1 1 1 1 1 1 0
used here instead of precision and recall to be consistent with previous approaches [22, 25] and because feature location techniques have been shown to be better at finding one relevant method for a feature as opposed to many [26].
B. Hypotheses
Several null hypotheses were formed to test whether the performance of the baseline feature location technique improves with the use of web mining. The testing of the hypotheses is based on the effectiveness measure. Two null hypotheses are presented here; the other hypotheses can be derived analogously.
( ) 0,WMPR bin
H
There is no significant difference betweenthe effectiveness of WMPR(bin) and the
baseline (IRLSIDynbin).
( ) 0,IRLSIWMPR bintop
H
There is no significant difference betweenthe effectiveness of IRLSIWMPR(bin)top and
the baseline (IRLSIDynbin).
If a null hypothesis can be rejected with high confidence, an alternative hypothesis that states that a technique has a positive effect on the ranking of the first relevant method can be supported. The corresponding alternative hypotheses to the null hypotheses above are given. The remaining alternative hypotheses are formulated in a similar manner.
( ) , PR bin
A WM
H
The effectiveness of WMPR(bin) issignificantly better than the baseline. ( )
, LSI PR bintop
A IR WM
H
The effectiveness of IRLSIWMPR(bin)top
is significantly better than the baseline. C. Data Collection and Analysis
The primary data collected in the evaluation is the effectiveness measure. For each feature location technique, there are 45 data points for Eclipse and 241 for Rhino, one for each feature. Descriptive statistics of the effectiveness measure for each system are reported that summarize the data in terms of mean, median, minimum, maximum, lower quartile, and upper quartile.
The feature location techniques can also be evaluated by how many features they can return at least one relevant
result. Many of the techniques in the model filter methods from consideration, and some of those methods may belong to the gold set. It is possible for a technique to filter out all of a feature’s gold set methods and return no relevant results. Therefore, the percentage of features for which a technique can locate at least one relevant method is reported.
If a feature location technique ranks one of a feature’s relevant methods closer to the top of the list than another technique, then the first approach is more effective. Every feature location technique can be compared to every other technique in this manner, and the percentage of times the first technique is more effective is reported.
Data on whether one technique is more effective than another is not enough. Statistical analysis must be performed to determine if the difference between the effectiveness of two techniques is significant. The Wilcoxon Rank Sum test [7] is used to test if the difference between the effectiveness measures of two feature location techniques is statistically significant. Essentially, the test determines if the decrease in the number of false positives reported by one technique as compared to another is significant. The Wilcoxon test is a non-parametric test that accepts paired data. Since a technique may not rank any of a feature’s gold set methods, it would have no data to be paired with the data from another feature location technique. Therefore, only cases where both techniques rank a method are input to the test. In this evaluation, the significance level of the Wilcoxon Rank Sum test is α = 0.05.
IV. RESULTS AND DISCUSSION
This section presents the results of using the feature location techniques listed in Table I to identify the first relevant method of 45 features of Eclipse and 241 features of Rhino. Figure 2 and Figure 3 show box plots representing the descriptive statistics of the effectiveness measure for Eclipse and Rhino. The graphs for Eclipse and Rhino have different scales because Eclipse has more methods. Figure 2 plots the feature location techniques based on IR (T1), IR and
dynamic analysis (T2), and web mining as a standalone
approach (T3 through T8). Figure 3 shows the techniques that
combine IR, dynamic analysis, and web mining (T2 through
T13). IRLSIDynbin is also included in this figure for reference
since it represents the baseline for comparison. In Figure 2 and Figure 3, the diamonds represent the average
87% 87% 87% 87% 87% 87% 87% 100% T8 T7 T6 T5 T4 T3 T2 T1 0 2000 4000 6000 8000 10000 12000 14000 16000 18000 20000 100% 100% 100% 100% 100% 100% 100% 100% T8 T7 T6 T5 T4 T3 T2 T1 0 100 200 300 400 500 600 700 800 (a) Eclipse (b) Rhino
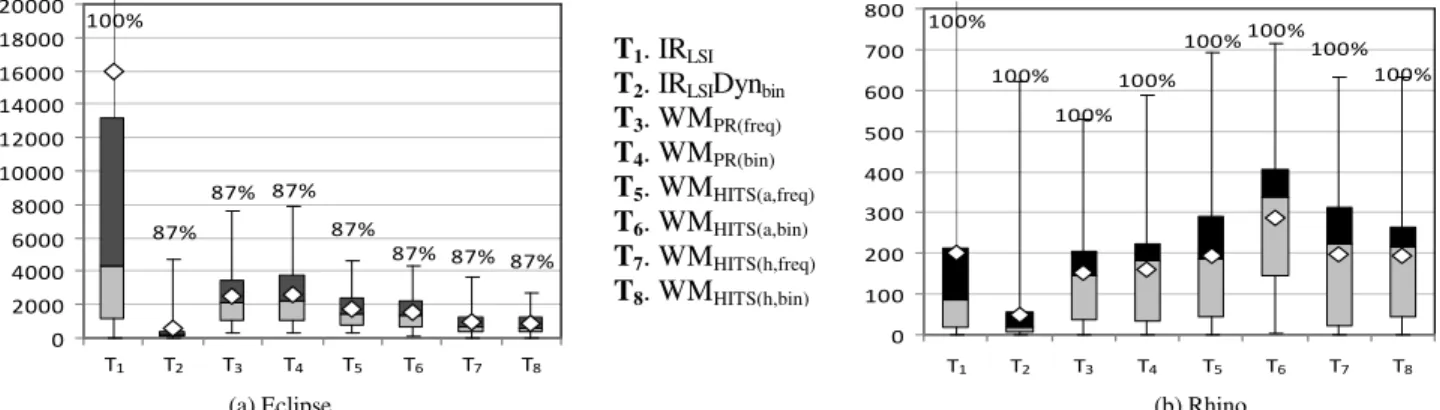
Figure 2. The effectiveness measure for the feature location techniques applied to 45 features of Eclipse and 241 features of Rhino. The values above the boxes represent the percentage of features for which the technique was able to locate at least one relevant method.
T1. IRLSI T2. IRLSIDynbin T3. WMPR(freq) T4. WMPR(bin) T5. WMHITS(a,freq) T6. WMHITS(a,bin) T7. WMHITS(h,freq) T8. WMHITS(h,bin)
effectiveness measure. The dark grey and light grey boxes stand for the upper and lower quartiles, respectively, and the line between the boxes represents the median. The whiskers above and below the boxes denote the maximum and minimum effectiveness measure. In some cases, the maximum is beyond the scale of the graphs. The figures also report for each feature location technique, the percentage of features for which the technique was able to identify at least one relevant method.
The box plots in Figure 2 show that using web mining as a standalone feature location technique produces results that are comparable to IRLSI even though no query is used.
However, these techniques are less effective than the state of the art, no matter the web mining algorithm used. The feature location techniques based on PageRank, HITS hub values, or HITS authority values are not as effective as IRLSIDynbin. Overall, there is little difference between the
use of binary and execution frequency information. PageRank was the least effective, followed by HITS authorities and HITS hubs. It is surprising that ranking methods by their hub values is more effective than ranking them by their authority values. Intuitively, hubs are methods that delegate functionality to authorities which actually implement it. Therefore, authorities should be more valuable for feature location, but this was not observed.
Even though feature location techniques based on standalone web mining are not more effective than the state of the art, when web mining is used as a filter to the baseline, the results significantly improve in some cases. Figure 3 presents box plots of the effectiveness measure of the techniques that used web mining to filter IRLSIDynbin’s
results. The filters prune either the top or bottom methods ranked by a web mining algorithm. The threshold for the percent of methods to filter was selected for each technique individually such that at least one gold set method remained in the results for 66% of the features. In Eclipse, IRLSIWMHITS(h,freq)bottom had the best effectiveness measure on
average. In Rhino, IRLSIWMHITS(h,bin)bottom was the most
effective technique. In fact, all of the techniques that use web mining as a filter are more effective than IRLSIDynbin in
Eclipse by 13% to 62% on average. In Rhino, most of the IR plus web mining techniques have an average effectiveness 1% to 51% better than IRLSIDynbin except for
IRLSIWMHITS(a,freq)bottom, IRLSIWMHITS(h,freq)top,
IRLSIWMHITS(a,bin)bottom, and IRLSIWMHITS(h,bin)top. These results
help answer RQ1 because they lend strong support to the fact that integrating the ranking of methods using web mining with information retrieval is a very effective way to perform feature location. In regards to RQ2, the techniques based on HITS were generally more effective than the PageRank approaches, so HITS, used either as a standalone technique or as a filter, seems better suited to the task of feature location.
In addition to measuring the effectiveness of each of the feature location techniques, the new approaches based on web mining were directly compared to IRLSI and IRLSIDynbin.
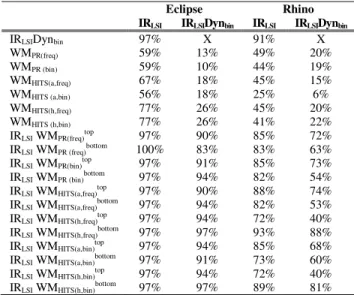
Table III shows for each new technique, the percent of times its effectiveness measure is better than that of the existing approaches9. The table shows a different view of the data presented in Figures 2 and 3. It shows on a case-by-case basis, which feature location technique is more effective. The data in this table is derived from the subset of methods that are ranked by both techniques, while Figures 2 and 3 show data for all methods. In Table III, if one approach ranks a method and another does not, the method is not included in the reported data. The table shows that feature location techniques based solely on web mining never have better effectiveness than IRLSIDynbin. On the other hand, the
techniques that use web mining as a filter routinely rank methods closer to the top of the list than IRLSIDynbin. This
finding also helps answer RQ1: combining web mining with existing approaches improves their effectiveness. RQ2
addresses which of the two web mining algorithms is more effective. Based on the results in Table III, the techniques
9
The online appendix includes complete data on the performance of each feature technique compared to all the others.
83% 75% 77% 86% 90% 75% 70% 81% 71% 67% 77% 68% 100% T13 T12 T11 T10 T9 T8 T7 T6 T5 T4 T3 T2 T1 0 50 100 150 200 250 300 (a) Eclipse (b) Rhino
Figure 3. The effectiveness measure for the feature location techniques that combine information retrieval and web mining. The top and bottom percentages in brackets have two values. The first value is the percentage used in Eclipse, and the second is the percentage used in Rhino. The values above
the boxes represent the percentage of features for which the technique was able to locate at least one relevant method. T1. IRLSIDynbin
T2. IRLSIWMPR(freq)top [40, 60]% T3. IRLSIWMPR(freq)bot [20, 70]% T4. IRLSIWMPR(bin)top [40, 60]% T5. IRLSIWMPR(bin)bot [10, 70]% T6. IRLSIWMHITS(a,freq)
top [30, 70]%
T7. IRLSIWMHITS(a,freq)bot [40, 60]% T8. IRLSIWMHITS(h,freq)top [10, 70]% T9. IRLSIWMHITS(h,freq)bot [60, 50]% T10. IRLSIWMHITS(a,bin)
top [20, 70]%
T11. IRLSIWMHITS(a,bin)bot [40, 40]% T12. IRLSIWMHITS(h,bin)top [10, 70]% T13. IRLSIWMHITS(h,bin)bot [70, 60]%
73% 73% 73% 71% 80% 69% 71% 67% 73% 76% 67% 69% 87% T13 T12 T11 T10 T9 T8 T7 T6 T5 T4 T3 T2 T1 0 100 200 300 400 500 600 700
based on HITS are more effective than the PageRank techniques.
A. Statistical Analysis
The Wilcoxon Rank Sum test was used to test if the difference between the effectiveness measures of two feature location techniques is statistically significant. Table IV shows the results of the test (p-values) for all of the techniques based on web mining as compared to IRLSIDynbin
and if the null hypotheses can be rejected based on the p-values. In the table, statistically significant results are presented in boldface. None of the approaches in which web mining is used as a standalone technique have statistically significant results. However in Eclipse, all of the feature location techniques that employ web mining as a filter have significantly better effectiveness than IRLSIDynbin. Likewise
in Rhino, most of the approaches that use web mining as a filter have statistically significant results with a few exceptions. Therefore, the null hypotheses for these approaches without significant results for both systems cannot be rejected. However, for the techniques with statistically significant results for both Eclipse and Rhino, their null hypotheses are rejected, and there is evidence to suggest that the corresponding alternative hypotheses can be supported. These feature location techniques have significantly better effectiveness than the baseline technique.
B. Discussion
The findings of the evaluation show that combining web mining with an existing feature location technique results is a more effective approach (RQ1). Additionally in the context of feature location, HITS is a more effective web mining algorithm than PageRank (RQ2). The most effective techniques evaluated were IRLSIWMHITS(h,freq)bottom and
IRLSIWMHITS(h,bin)bottom. The results indicate that filtering
bottom-ranked hub methods from IRLSIDynbin's results is the
most effective approach. For instance, for one feature in
Eclipse, IRLSI ranked the first relevant method at position
1,696, and for IRLSIDynbin, the best rank of a relevant method
was at position 61. IRLSIWMHITS(h,bin)bottom, on the other hand,
ranked the first relevant method to the feature at position 24. Filtering the bottom HITS hub methods eliminated 37 false positives from the results obtained by the state of the art technique. Examining the results in detail reveals why. Methods with high hub values call many other methods, while methods that do not make many calls have low hub values. These bottom-ranked hub methods are generally getter and setter methods or other methods that do not make any calls and perform very specific tasks. The IRLSIWMHITS(h,bin)bottom technique prunes these methods from
the results since they are not relevant to the feature, thus improving effectiveness.
C. Threats to Validity
There are several threats to validity of the evaluation presented in this work. Conclusion validity refers to the relationship between the treatment and the outcome and if it is statistically significant. Since no assumptions were made about the distribution of the effectiveness measures, a non-parametric statistical test was used. The results of the test showed that the improvement in effectiveness of most of the web mining based feature location techniques over the state of the art is significant.
Internal validity refers to if the relationship between the treatment and the outcome is casual and not due to chance. The effectiveness measure is based on the position of a feature’s first relevant method, and the relevant methods are defined by a gold set. In Eclipse, the gold set was defined by bug report patches. These patches may contain only a subset of the methods that implement a feature, and sometimes the methods were not implemented until a later version. In Rhino, the gold set methods were defined manually by other researchers who were not system experts. Thus, relevant methods could be missing from the gold sets of each system. This threat is minimized by the fact that the patches were approved by the module owners and the Rhino data has been previously used by other researchers [11, 12].
TABLE III. FOR EACH FEATURE LOCATION TECHNIQUE LISTED IN A ROW, THE PERCENTAGE OF TIMES ITS EFFECTIVENESS MEASURE IS BETTER
THAN THE TECHNIQUE IN THE CORRESPONDING COLUMN IS GIVEN.
Eclipse Rhino IRLSI IRLSIDynbin IRLSI IRLSIDynbin
IRLSIDynbin 97% X 91% X
WMPR(freq) 59% 13% 49% 20% WMPR (bin) 59% 10% 44% 19% WMHITS(a,freq) 67% 18% 45% 15% WMHITS (a,bin) 56% 18% 25% 6% WMHITS(h,freq) 77% 26% 45% 20% WMHITS (h,bin) 77% 26% 41% 22%
IRLSI WMPR(freq)top 97% 90% 85% 72%
IRLSI WMPR (freq)bottom 100% 83% 83% 63%
IRLSI WMPR(bin)top 97% 91% 85% 73%
IRLSI WMPR (bin)bottom 97% 94% 82% 54%
IRLSI WMHITS(a,freq)top 97% 90% 88% 74%
IRLSI WMHITS(a,freq)bottom 97% 94% 82% 53%
IRLSI WMHITS(h,freq)top 97% 94% 72% 40%
IRLSI WMHITS(h,freq)bottom 97% 97% 93% 88%
IRLSI WMHITS(a,bin)top 97% 94% 85% 68%
IRLSI WMHITS(a,bin)bottom 97% 91% 73% 60%
IRLSI WMHITS(h,bin)top 97% 94% 72% 40%
IRLSI WMHITS(h,bin)bottom 97% 97% 89% 81%
TABLE IV. THE RESULTS OF THE WILCOXON TEST. Eclipse Rhino Null Hypothesis WMPR(freq) 1 1 Not Rejected
WMPR (bin) 1 1 Not Rejected
WMHITS(a,freq) 1 1 Not Rejected
WMHITS (a,bin) 1 1 Not Rejected
WMHITS(h,freq) 1 1 Not Rejected
WMHITS (h,bin) 1 1 Not Rejected
IRLSI WMPR(freq)top < 0.0001 < 0.0001 Rejected
IRLSI WMPR (freq)bottom 0.004 0 Rejected
IRLSI WMPR(bin)top < 0.0001 < 0.0001 Rejected
IRLSI WMPR (bin)bottom < 0.0001 0.74 Not Rejected
IRLSI WMHITS(a,freq)top 0 < 0.0001 Rejected
IRLSI WMHITS(a,freq)bottom < 0.0001 0.99 Not Rejected
IRLSI WMHITS(h,freq)top 0 1 Not Rejected
IRLSI WMHITS(h,freq)bottom < 0.0001 < 0.0001 Rejected
IRLSI WMHITS(a,bin)top < 0.0001 < 0.0001 Rejected
IRLSI WMHITS(a,bin)bottom < 0.0001 1 Not Rejected
IRLSI WMHITS(h,bin)top 0 1 Not Rejected
Another threat to internal validity pertains to the collection of data from IR and dynamic analysis. Information retrieval requires a query. The queries in this evaluation were taken directly from bug reports and documentation. It is possible that the queries used do not accurately reflect the features being located or that the use of different queries with vocabularies more inline with the source code would yield better results. However, using these default queries instead of queries formulated by the experimenters avoided the introduction of bias. Similarly, execution traces were collected for each feature based on either the bug reports or test cases. The collection of these traces may not have invoked all of a feature’s relevant methods or may have inadvertently invoked another feature. This is a threat to validity common to all approaches that use dynamic analysis. The use of test cases distributed with the software reduces this threat since the tests were created by the system’s authors.
External validity concerns whether or not the results of this evaluation can be generalized beyond the scope of this work. Two open source systems written in Java were evaluated. Eclipse is large enough to be comparable to an industrial software system, but Rhino is only medium-sized. Additional evaluations on other systems written in other languages are needed to know if the results of this study hold in general.
V. RELATED WORK
Existing feature location techniques can be broadly classified by the types of analysis they employ, be it static, dynamic, textual, or a combination of two or more of these. Chen and Rajlich [6] proposed the use of Abstract System Dependence Graphs (ASDG) as a means of static feature location, whereby users follow system dependencies to find relevant code. Robillard [27] introduced a more automated static approach that analyzed the topology of a system’s dependencies. Harman et al. [17] used hypothesis-based concept assignment (HB-CA) [15] and program slicing to create executable concept slices and found these slices can be used to decompose a system into smaller executable units corresponding to concepts (features) [3]. In this work, instead of using static information, textual and dynamic data are used to get results that are more tailored to a specific feature.
Software reconnaissance [31] is a well-known dynamic approach to feature location. Two execution traces are collected: one that invokes the feature of interest and another that does not. The traces are compared, and methods invoked only in the feature-specific trace are deemed relevant. Scenario-based probabilistic ranking (SPR) [1] is another dynamic feature location technique in which statistical hypothesis testing is used to rank executed methods. This work employs dynamic information for feature location, but uses it as a filter to textual information instead of directly locating a feature from pure dynamic analysis.
Textual feature location was introduced by Marcus et al. [24] when they applied LSI to source code. The approach has been extended to include relevance feedback [14], where users indicate which results are relevant, and a new query is automatically formulated from the feedback. Textual analysis of source code is not limited to LSI. Grant et al.
[16] employ Independent Component Analysis (ICA) for feature location. ICA is an analysis technique that separates a set of input signals into statistically independent components. For each method, the analysis determines its relevance to each of the signals, which represent features. This work relies on LSI as opposed to other analyses because LSI is the de facto standard.
In addition to these techniques based on a single type of analysis, there are many hybrid approaches. Both SITIR [22] and PROMESIR [25] combine textual and dynamic analysis. FLAT3 [30] provides tool support for SITIR. Eisenbarth et al. [13] applied formal concept analysis to execution traces and combined the results with an approach similar to ASDGs. Dora [18] and SNIAFL [34] incorporate information from textual and static analysis. Cerberus [11] is the only hybrid approach that combines static, dynamic, and textual analyses.
No existing feature location techniques rely on web mining. However, web mining has been used for other program comprehension tasks. Zaidman and Demeyer [32, 33] used the HITS algorithm on a dependence graph of a system weighted with dynamic coupling measures to identify the classes that are most important for understanding the software. SPARS-J [19] is a system that analyzes the usage relations of components in a software repository using a ranking algorithm that is similar to PageRank. Components that are generic and frequently reused are ranked highly. Li [21] also used a variant of PageRank called Vertex Rank Model (VRM) to refine concept bindings found using HB-CA. The VRM works on a dependence graph of concept bindings to identify statements that can be removed from the concept bindings without losing domain knowledge.
VI. CONCLUSION
This work has introduced a data fusion model for feature location. The basis of the model is that combining information from multiple sources is more effective than using the information individually. Feature location techniques based on web mining and approaches using web mining as a filter to information retrieval were instantiated within the model. A large number of features from two open source Java systems were studied in order to discover if feature location based on combining IR and web mining is more effective than the current state of the art and which of two web mining algorithms is better suited to feature location. The results of an extensive evaluation reveal that new feature location techniques based on using web mining as a filter are more effective than the state of the art, and that their improvement in effectiveness is statistically significant. Future work includes instantiating the model with different IR techniques and investigating using a static program dependence graph for web mining. All of the data used to generate the results presented in this paper is made publically available to other researchers who wish to replicate these case studies.
ACKNOWLEDGMENT
This work is supported by NSF CCF-0916260 and United States AFOSR FA9550-07-1-0030 grants. Any opinions, findings, and conclusions expressed herein are the authors’ and do not necessarily reflect those of the sponsors.
REFERENCES
[1] Antoniol, G. and Guéhéneuc, Y. G., "Feature Identification: An Epidemiological Metaphor", IEEE Trans. on Software Engineering, vol. 32, no. 9, Sept. 2006, pp. 627-641.
[2] Biggerstaff, T. J., Mitbander, B. G., and Webster, D. E., "The Concept Assignment Problem in Program Understanding", in Proc. of the Intl. Conference on Software Engineering,1994, pp. 482-498.
[3] Binkley, D., Gold, G., Harman, M., Li, Z., and Mahdavi, K., "An empirical study of the relationship between the concepts expressed in source code and dependence", The Journal of Systems and Software, vol. 81, 2008, pp. 2287–2298.
[4] Blei, D. M., Ng, A. Y., and Jordan, M. I., "Latent Dirichlet Allocation",
Journal of Machine Learning Research, vol. 3, 2003, pp. 993-1022. [5] Brin, S. and Page, L., "The Anatomy of a Large-Scale Hypertextual
Web Search Engine", in Proc. of the Intl. Conference on World Wide Web, 1998, pp. 107-117.
[6] Chen, K. and Rajlich, V., "Case Study of Feature Location Using Dependence Graph", in Proc. of the Intl. Workshop on Program Comprehension, 2000, pp. 241-249.
[7] Conover, W. L., Practical Nonparametric Statistics, Third ed., Wiley, 1998. [8] Cooley, R., Mobasher, B., and Srivastava, J., "Web mining: Information
and pattern discovery on the world wide web", in Proc. of the Intl. Conference on Tools with Artificial Intelligence, 1997.
[9] Cornelissen, B., Zaidman, A., Van Deursen, A., Moonen, L., and Koschke, R., "A Systematic Survey of Program Comprehension through Dynamic Analysis", IEEE Trans. on Software Engineering, vol. 99, no. 2, Apr. 2009, pp. 684-702.
[10] Deerwester, S., Dumais, S. T., Furnas, G. W., Landauer, T. K., and Harshman, R., "Indexing by Latent Semantic Analysis", Journal of the American Society for Information Science, vol. 41, no. 6, Jan. 1990, pp. 391-407.
[11] Eaddy, M., Aho, A. V., Antoniol, G., and Guéhéneuc, Y. G., "CERBERUS: Tracing Requirements to Source Code Using Information Retrieval, Dynamic Analysis, and Program Analysis", in Proc. of the Intl. Conference on Program Comprehension, 2008, pp. 53-62.
[12] Eaddy, M., Zimmermann, T., Sherwood, K., Garg, V., Murphy, G., Nagappan, N., and Aho, A. V., "Do Crosscutting Concerns Cause Defects?" IEEE Trans. on Software Engineering, vol. 34, no. 4, July-Aug. 2008, pp. 497-515.
[13] Eisenbarth, T., Koschke, R., and Simon, D., "Locating Features in Source Code", IEEE Trans. on Software Engineering, vol. 29, no. 3, March 2003, pp. 210-224.
[14] Gay, G., Haiduc, S., Marcus, A., and Menzies, T., "On the Use of Relevance Feedback in IR-Based Concept Location", in Proc. of the Intl. Conference on Software Maintenance, 2009, pp. 351-360. [15] Gold, N. E. and Bennett, K. H., "Hypothesis-based concept assignment
in software maintenance", IEE Proceedings-Software, vol. 149, no. 4, 2002, pp. 103-110.
[16] Grant, S., Cordy, J. R., and Skillicorn, D. B., "Automated Concept Location Using Independent Component Analysis ", in Proc. of the Working Conference on Reverse Engineering, 2008, pp. 138-142. [17] Harman, M., Gold, N. E., Hierons, R. M., and Binkley, D. W., "Code
Extraction Algorithms which Unify Slicing and Concept Assignment", in
Proc. of the Working Conference on Reverse Engineering, 2002, pp. 11-21.
[18] Hill, E., Pollock, L., and Vijay-Shanker, K., "Exploring the Neighborhood with Dora to Expedite Software Maintenance", in Proc. of the Intl. Conference on Automated Software Engineering, 2007, pp. 14-23. [19] Inoue, K., Yokomori, R., Yamamoto, T., Matsushita, M., and
Kusumoto, S., "Ranking significance of software components based on use relations", IEEE Trans. on Software Engineering, vol. 31, no. 3, March 2005, pp. 213- 225.
[20] Kleinberg, J. M., "Authoritative sources in a hyperlinked environment",
Journal of the ACM, vol. 46, no. 5, 1999, pp. 604-632.
[21] Li, Z., Identifying High-Level Dependence Structures Using Slice-Based Dependence Analysis, King's College London, 2009.
[22] Liu, D., Marcus, A., Poshyvanyk, D., and Rajlich, V., "Feature Location via Information Retrieval based Filtering of a Single Scenario Execution Trace", in Proc. of the Intl. Conference on Automated Software Engineering, 2007, pp. 234-243.
[23] Lukins, S., Kraft, N., and Etzkorn, L., "Source Code Retrieval for Bug Location Using Latent Dirichlet Allocation", in Proc. of the Working Conference on Reverse Engineering, 2008, pp. 155-164.
[24] Marcus, A., Sergeyev, A., Rajlich, V., and Maletic, J., "An Information Retrieval Approach to Concept Location in Source Code", in Proc. of the Working Conference on Reverse Engineering, 2004, pp. 214-223. [25] Poshyvanyk, D., Guéhéneuc, Y. G., Marcus, A., Antoniol, G., and
Rajlich, V., "Feature Location using Probabilistic Ranking of Methods based on Execution Scenarios and Information Retrieval", IEEE Trans. on Software Engineering, vol. 33, no. 6, June 2007, pp. 420-432. [26] Revelle, M. and Poshyvanyk, D., "An Exploratory Study on Assessing
Feature Location Techniques", in Proc. of the Intl. Conference on Program Comprehension, 2009, pp. 218-222.
[27] Robillard, M. P., "Topology Analysis of Software Dependencies", ACM Trans. on Software Engineering and Methodology, vol. 17, no. 4, Aug. 2008. [28] Salton, G. and McGill, M., Introduction to Modern Information
Retrieval, New York, McGraw-Hill, 1986.
[29] Saul, M. Z., Filkov, V., Devanbu, P., and Bird, C., "Recommending random walks", in Proc. of the ACM SIGSOFT Symposium on the Foundations of Software Engineering, 2007, pp. 15-24.
[30] Savage, T., Revelle, M., and Poshyvanyk, D., "FLAT3: Feature
Location and Textual Tracing Tool", in Proc. of the Intl. Conference on Software Engineering, 2010.
[31] Wilde, N. and Scully, M., "Software Reconnaissance: Mapping Program Features to Code", Software Maintenance: Research and Practice, vol. 7, no. 1, Jan.-Feb. 1995, pp. 49-62.
[32] Zaidman, A. and Demeyer, S., "Automatic identification of key classes in a software system using webmining techniques", Journal of Software Maintenance and Evolution: Research and Practice, vol. 20, no. 6, 2008, pp. 387-417.
[33] Zaidman, A., Du Bois, B., and Demeyer, S., "How Webmining and Coupling Metrics Improve Early Program Comprehension", in Proc. of the Intl. Conference on Program Comprehension, 2006, pp. 74-78. [34] Zhao, W., Zhang, L., Liu, Y., Sun, J., and Yang, F., "SNIAFL: Towards
a Static Non-interactive Approach to Feature Location", ACM Trans. on Software Engineering and Methodologies vol. 15, no. 2, April 2006, pp. 195-226.