University of Kentucky University of Kentucky
UKnowledge
UKnowledge
Theses and Dissertations--Physics andAstronomy Physics and Astronomy
2016
A Systematic Study of the Effect of Spin-Orbit Interaction on
A Systematic Study of the Effect of Spin-Orbit Interaction on
Properties of Tetravalent and Pentavalent Iridate Compounds
Properties of Tetravalent and Pentavalent Iridate Compounds
Jasminka TerzicUniversity of Kentucky, [email protected]
Digital Object Identifier: https://doi.org/10.13023/ETD.2016.488
Right click to open a feedback form in a new tab to let us know how this document benefits you. Right click to open a feedback form in a new tab to let us know how this document benefits you. Recommended Citation
Recommended Citation
Terzic, Jasminka, "A Systematic Study of the Effect of Spin-Orbit Interaction on Properties of Tetravalent and Pentavalent Iridate Compounds" (2016). Theses and Dissertations--Physics and Astronomy. 40. https://uknowledge.uky.edu/physastron_etds/40
This Doctoral Dissertation is brought to you for free and open access by the Physics and Astronomy at UKnowledge. It has been accepted for inclusion in Theses and Dissertations--Physics and Astronomy by an authorized
STUDENT AGREEMENT: STUDENT AGREEMENT:
I represent that my thesis or dissertation and abstract are my original work. Proper attribution has been given to all outside sources. I understand that I am solely responsible for obtaining any needed copyright permissions. I have obtained needed written permission statement(s) from the owner(s) of each third-party copyrighted matter to be included in my work, allowing electronic distribution (if such use is not permitted by the fair use doctrine) which will be submitted to UKnowledge as Additional File.
I hereby grant to The University of Kentucky and its agents the irrevocable, non-exclusive, and royalty-free license to archive and make accessible my work in whole or in part in all forms of media, now or hereafter known. I agree that the document mentioned above may be made available immediately for worldwide access unless an embargo applies.
I retain all other ownership rights to the copyright of my work. I also retain the right to use in future works (such as articles or books) all or part of my work. I understand that I am free to register the copyright to my work.
REVIEW, APPROVAL AND ACCEPTANCE REVIEW, APPROVAL AND ACCEPTANCE
The document mentioned above has been reviewed and accepted by the student’s advisor, on behalf of the advisory committee, and by the Director of Graduate Studies (DGS), on behalf of the program; we verify that this is the final, approved version of the student’s thesis including all changes required by the advisory committee. The undersigned agree to abide by the statements above.
Jasminka Terzic, Student Dr. Gang Cao, Major Professor Dr. Christopher Crawford, Director of Graduate Studies
A systematic study of the effect of spin-orbit interaction on properties of tetravalent and pentavalent iridate compounds
DISSERTATION
A dissertation submitted in partial fulfilment of the requirements for the degree of Doctor of Philosophy in the
College of Arts and Sciences at the University of Kentucky
By Jasminka Terzic Lexington, Kentucky
Director: Dr. Gang Cao, Professor of Physics Lexington, Kentucky
2016
ABSTRACT OF DISSERTATION
A SYSTEMATIC STUDY OF THE EFFECT OF SPIN-ORBIT INTERACTION ON PROPERTIES OF TETRAVALENT AND PENTAVALENT IRIDATE COMPOUNDS
Previous studies of iridates have shown that an interplay of strong SOI, Coulomb interaction U, Hund’s rule coupling and crystalline electric fields result in unexpected insulating states with complex magnetic states. The novel Jeff =1/2 insulating state first observed in Sr2IrO4 is a direct consequence of such an intriguing interplay and is one of the central foci of this dissertation study.
The work presented here consists of three projects: (1) Effects of Tb doping on Sr2IrO4 having tetravalent Ir4+(5d5) ions; (2) Emergence of unexpected magnetic states in
double-perovskite (Ba1-xSrx)2YIrO6 with pentavalent Ir5+(5d4) ions in the presence of
strong SOI, and (3) The coexistence of a charge and magnetic order in a magnetic dimer chain system, Ba5AlIr2O11, which has both tetravalent Ir4+ (5d5) and pentavalent Ir5+ (5d4)
ions.
A significant portion of this dissertation will focus on Tb doped Sr2IrO4. A central finding of this work is that slight Tb doping (3%) readily suppresses the antiferromagnetic state but retains the insulating state, indicating an unusual correlation between the magnetic and insulating states as a result of the presence of the strong SOI.
However, SOI is not the only significant phenomenon. The study on the double-perovskite (Ba1-xSrx)2YIrO6 revealed an exotic magnetic ground state, in sharp contrast to the anticipated singlet ground state in the strong SOI limit, raising an urgent question: is SOI as dominant as was initially anticipated in the iridates?
Finally, this study turns to a system containing both Ir4+ and Ir5+ ions, Ba5AlIr2O11. This system features dimer chains of two inequivalent octahedra occupied by tetravalent Ir4+ (5d5) and pentavalent Ir5+ (5d4) ions respectively. Ba5AlIr2O11 undergoes charge and magnetic order transitions at 210 K and 4.5 K, respectively.
SOI-driven physics is a rapidly evolving field with an ever growing list of theoretical proposals which have enjoyed very limited experimental confirmation thus far. This study has revealed a large range of interesting phenomena in the iridates that defy conventional theoretical arguments and that help to fill an experimental void in this field.
Keywords: spin-orbit interaction (SOI), iridates, double exchange, Mott insulator, Coulomb interaction, Hund’s rule coupling
Author’s signature: Jasminka Terzic Date: December 1, 2016
A SYSTEMATIC STUDY OF THE EFFECT OF SPIN-ORBIT INTERACTION ON PROPERTIES OF TETRAVALENT AND PENTAVALENT IRIDATE COMPOUNDS
By Jasminka Terzic
Director of Dissertation: Gang Cao Director of Graduate Studies: Christopher Crawford Date: December 1, 2016
iii
ACKNOWLEDGEMENTS
First and foremost I would like to extend my deepest appreciation to my advisor Prof. Gang Cao for his endless support and patience during my studies at University of Kentucky. The most I appreciated is his hands on approach and immense drive for research, which is very motivating and inspiring. His many hours spent working in lab have allowed for close learning experiences and discussions, which have resulted greatly in the knowledge I have today. I will forever be grateful for knowledge, training and support given to me by Prof. Cao over the last five years.
I would also like to express my gratitude to the members of my supervisory committee: Prof. Lance De Long for his teaching inside and out of the classroom and his continued guidance during my studies; to Prof. Ambrose Seo for his long standing collaboration and many published manuscripts and to Prof. Sean Parkin for his help in single-crystal structure work and his support in numerous questions and structure inquiries over the last several years. I appreciate all their contributions and knowledge they have given me during the last several years.
Over the course of my degree I have had the privilege of working and learning from many colleagues, who have become and stayed friends. Many are previous students, but especially Dr. Tongfei Qi, Dr. Oleksandr Korneta and Dr. Li Li, from whom I have learned the most. I also dearly appreciate the opportunity I had to work with post-doctoral fellow Dr. Shujuan Yuan and Dr. Wenhai Song during their extended visits to our lab.
I have also very much appreciated the collaboration with graduate students from the Department of Physics and Astronomy, including Dr. John Nichols, John Gruenewald, John Connell, Justin Woods, Justin Thompson, Maryam Souri to only name a few. Besides the emotional and moral support from all the colleagues in the department I can’t forget to thank all the office staff, as well as machine and electrical shop for support and their hard work to make all the things we envision happen quickly. For all this and more I am very grateful.
Finally, I would like to thank my family: my parents Jakub and Milica, and sister Dinka for so much support and understanding during the hardest times that have come over the last several years, but also for encouraging me to keep going and being there anytime I needed them. At this moment I couldn’t be more thankful for their support.
iv TABLE OF CONTENTS Acknowledgements ... iii Table of Contents ... iv List of Figures ... vi List of Tables ... ix Chapter 1. INTRODUCTION ...1
1.1 Correlated Electron Systems - Mott physics ...1
1.2 Interplay of strong spin-orbit interaction and electron correlation ...3
1.3 Spin-orbit coupled iridates ...4
1.4 Sr2IrO4 ...6
1.4.1 Underlying observations ...6
1.4.2 Chemical doping ...7
1.4.3 Remarkable effect of Tb doping ...11
1.5 Breakdown of Jeff = 0 singlet ground state ...11
1.6 Wide gap between experimental observations and theoretical proposals ...12
Chapter 2 EXPERIMENTAL METHODS ...13
2.1 Single Crystal Synthesis ...13
2.1.1 Flux method for single-crystal growth ...13
2.1.2 Floating zone method for single-crystal growth ...14
2.2 Materials structural characterization ...16
2.2.1 Powder X-ray diffraction ...16
2.2.2 Single-crystal X-ray diffraction ...18
2.2.3 Energy dispersive X-ray spectroscopy ...20
2.3 Magnetic properties measurements...21
2.4 Transport properties measurements ...22
2.5 Thermal properties measurements ...23
v
Chapter 3. THEORETICAL METHODS ...26
3.1 Crystal Electric Field Environment ...26
3.2 Spin Orbit Interaction ...27
3.3 Hund’s Rules ...28
3.4 The Jahn-Teller Effect ...29
3.5 Exchange Interactions ...30
3.5.1 Direct Exchange ...30
3.5.2 Indirect Exchange ...31
3.5.3 Superexchange ...32
3.5.4 Double Exchange ...33
Chapter 4 RESULTS AND DISCUSSION ...34
4.1 Decoupling of the Antiferromagnetic and Insulating States in Tb doped Sr2IrO4 ...34
4.1.1 Introduction ...34
4.1.2 X-ray absorption and neutron diffraction results ...35
4.1.3 Incommensurate magnetic order ...37
4.1.4 Anderson localization (variable range hopping) ...40
4.2 Breakdown of the spin-orbit imposed Jeff = 0 singlet state in double-perovskite iridates with Ir5+ (5d4) ions ...43
4.2.1 Introduction ...43
4.2.2 Crystal structure of (Sr,Ba)2YIrO6 ...43
4.2.3 Magnetic order in spite of expected Jeff = 0 singlet ground state ...46
4.3 Coexisting charge and magnetic ordering in the dimer-chain iridate Ba5AlIr2O11 ...53
4.3.1 Introduction ...53
4.3.2 Crystal structure of Ba5AlIr2O11 ...54
4.3.3 Existence of charge order in Ba5AlIr2O11 ...55
4.3.4 Magnetic order in Ba5AlIr2O11 ...56
Chapter 5 Conclusion ...60
References ...63
vi
LIST OF FIGURES
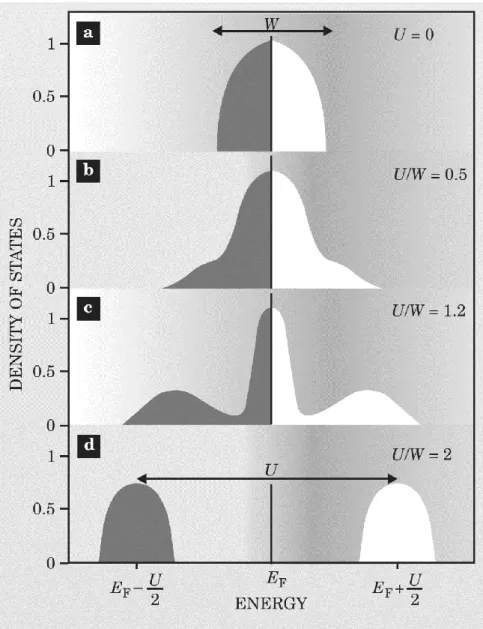
1.1 The Density of States as function of Coulomb Interaction U: (a) independent electron model with U = 0, Fermi level sits at middle of band, resulting in a metallic state, (b) when electrons weakly interact (small U) there is narrowing of the band however DOS still resembles that of independent electrons, (c) in strongly correlated electrons U > W the spectrum displays three peak structure, two Hubbard bands and quasiparticle peak at Fermi level, (d) when electron correlation is strong enough to cause quasiparticle peak to vanish transferring spectral weight to
the two Hubbard bands causing Mott metal-insulator transition ………... 2
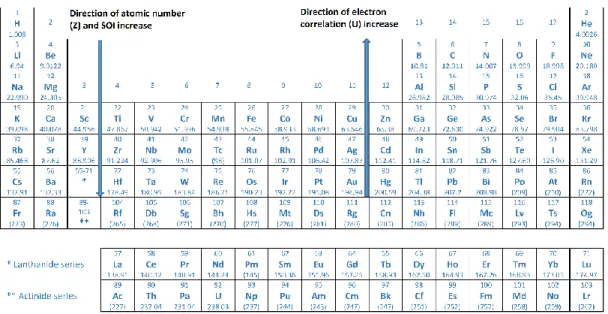
1.2 Periodic table trends of increase in spin-orbit interaction and electron correlation as a result of change in atomic number (Z) and orbital size respectively ………... 3
1.3 Graphic representation for 5d electron energy: (a) wide t2g band without SOI and U, (b) wide t2g band without SOI but unrealistically large U opening the gap, (c) with SOI but no U, (d) with both SOI and U resulting in Jeff = ½ insulating state, (e) 5d electron splitting by SOI and crystal field 5 1.4 Sr2IrO4 temperature dependence of: (a) the magnetization (left scale) and Curie-Weiss fitting (right scale), (b) the a- and c- axis resistivity ………... 6
1.5 Phase diagram of Ir-O-Ir bond angle θ as function of La3+ and K+ doping concentration in (Sr1-xAx)2IrO4 ………... 7
1.6 (a) a-axis resistivity ρa for (Sr1-xLax)2IrO4, (b) the c-axis resistivity, ρc for (Sr1-xLax)2IrO4, (c) the a-axis resistivity ρa and magnetization Ma for (Sr 1-xKx)2IrO4 ... 8
1.7 Lattice parameter changes as function of Rh concentration in Sr2Ir1-xRhxO4: (a) a- and c-axis, (b) unit cell volume and Ir/Rh-O-Ir/Rh angle …………... 9
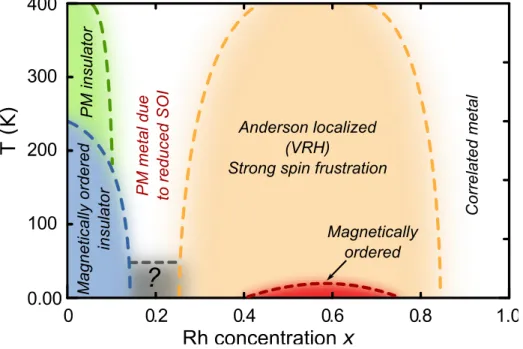
1.8 The phase diagram for Sr2Ir1-xRhxO4 (0≤ x ≤ 1) ………. 10
2.1 Flux-grown single crystals: (a) Sr2IrO4 and (b) Ba5AlIr2O11 ………. 13
2.2 A graphic diagram of optical floating-zone furnace operation ………... 14
2.3 Floating-zone furnace during operation ………... 15
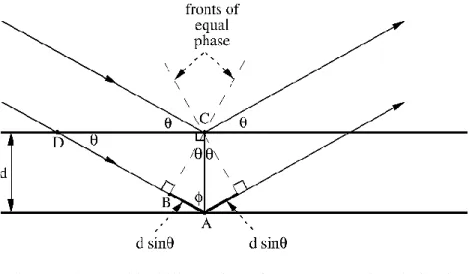
2.4 Graphical illustration of Bragg’s equation derivation ………... 17
2.5 Powder diffraction pattern for Sr2IrO4 obtained by measurement using Bruker D8 Advance Diffractometer ……….. 18
2.6 Single-crystal four-circle diffractometer operation schematic ……….. 19
2.7 Energy-dispersive X-ray spectroscopy operation principle ………... 20
2.8 EDX spectrum of single crystal Sr2Ir1-xRhxO4 ………... 21
2.9 DC SQUID illustration with sample moving through pick-up coils …….... 22
2.10 PPMS Heat Capacity Option Sample Platform thermal connections ……… 24
2.11 Frequency response of dielectric mechanisms ………... 25
3.1 Angular dependence of d-orbitals ……….... 26
3.2 Resulting orbital energies with octahedral crystal-field splitting ……….... 27
vii
3.4 The Bethe-Slater curve for direct exchange interaction ……… 31
3.5 The coefficient of indirect exchange as function of interatomic distance a.. 32 3.6 Double exchange mechanism between ions with different oxidation states
and ferromagnetic coupling ………... 33
4.1 The Tb concentration dependence of (a) a- and c-axis lattice parameters and unit cell volume V (right scale) and (b) c/a ratio and Ir-O-Ir bond angle θ
(right scale) ………... 34
4.2 (a) XANES results for x = 0.02 and 0.03 compared to previously studied Tb3+ and Tb4+ ions; (b) magnitude of complex Fourier transformation of the XAFS data (black line) and fit (red line); (c) real part of complex Fourier transformation of the XAFS data (black line) and fit (red line) ……… 35 4.3 XAFS data for discovery of Tb site substitution: (a) the magnitude of the
complex Fourier transform in real space, (b) the real part of the complex Fourier transform in real space, (c) XAFS in photoelectron momentum space, and (d) the back Fourier transform in photoelectron momentum space: (in all panels, black dots and lines represent XAFS data and simulations by red/green lines for Tb at Ir/Sr site)...
36 4.4 (a) Ma temperature dependence at μoH = 0.1 T for 0 ≤ x ≤ 0.03 and (b) Mc
temperature dependence at μoH = 0.1 T for 0 ≤ x ≤ 0.03 ………. 37
4.5 The temperature dependence for x = 0.03 of χa and χc; for χc-1on right scale:
(enlarged FC and ZFC low-temperature region for χa) ……….... 37
4.6 (a) The temperature dependence of Δχ-1 for 0 ≤ x ≤ 0.03, (b) Curie-Weiss temperature dependence on Tb concentration and effective moment
dependence on Tb concentration (right scale) ………... 38
4.7 Ma and Mc isothermal magnetization for 0 ≤ x ≤ 0.03 up to 14 T ………... 39
4.8 (a) Temperature dependence of the peak (1,0,2) for x = 0 and 0.005, inset: the rocking curve of the (1,0,2) peak for x = 0.005 at 5 K and 250 K, (b) Temperature dependence of the peaks (0.95,0,0) and (0,0.95,0) ………... 40 4.9 The temperature dependence of (a) the a-axis resistivity ρa and (b) the
c-axis resistivity ρc, (c) ln(ρa) vs T-1/2 for x = 0, 0.02 and 0.03 ………... 41
4.10 The specific heat C(T)/T vs T2 over temperature range 1.7 K<T<18 K for
0 ≤ x ≤ 0.03 ……….…….. 42
4.11 (a) The specific heat C(T)/T vs T for x = 0.03 at fields up to 14 T, (b) The specific heat C(T)/T vs μoH at T = 1.8 K and 4 K ……….... 42
4.12 The double perovskite Ba2YIrO6 crystal structure ………... 44
4.13 (a) The temperature dependence of lattice parameters and (b) oxygen coordinate (x,0,0) both for Ba2YIrO6 and Ba1.26Y0.74IrO6 ………. 45
4.14 (a) The crystal structure of double perovskite Sr2YIrO6, (b) flattened IrO6
octahedra, (c) replacement order of Y ions for Ir ions leads to face-centered cubic with geometrically frustrated edge-sharing tetrahedra …………... 46 4.15 Ba2YIrO6 temperature dependence of (a) magnetic susceptibility and 1/Δχ
(right scale) at μoH = 1 T and (b) low temperature susceptibility for 0.44 K
≤ T ≤ 4 K, (c) the isothermal magnetization at T = 0.5 and 0.8 K ……... 48 4.16 The Ba1.26Y0.74IrO6 temperature dependence of (a) magnetic susceptibility
and 1/Δχ (right scale) at μoH = 1 T and (b) low temperature susceptibility
viii
4.17 Ba2YIrO6 and Ba1.26Y0.74IrO6 thermal properties temperature dependence:
(a) the specific heat C(T) and (b) the entropy removal S(T) for Ba2YIrO6;
(c) specific heat C(T)and (d) the entropy removal S(T) for Ba1.26Y0.74IrO6 . 50
4.18 The low-temperature dependence of magnetic susceptibility for whole double perovskite series (Ba1-xSrx)2YIrO6 …………... 51
4.19 Isothermal magnetization at T = 0.5 K for the (Ba1-xSrx)2YIrO6 ……... 52
4.20 The single-crystal structure of Ba5AlIr2O11: (a) ac plane, (b) ab plane and
(c) characteristic single crystal with labeled b-axis ………... 53 4.21 The lattice parameters temperature dependence: (a) a, b and c-axis, (b) the
unit cell volume V, (c) Ir1-Ir2 bond distance and (d) the Ir1 thermal
displacement U ………. 54
4.22 The temperature dependence of (a) b-axis resistivity ρb, inset: ln ρb vs 1/T;
(b) a and b-axis dielectric constant, inset: b-axis low temperature dielectric
constant ………. 55
4.23 The illustration of proposed electrical dipoles, E and magnetic moments, M in ac- and ab-plane ………... 56 4.24 The temperature dependence of a-, b- and c-axis magnetization at μoH = 7T
and 1/Δχb (right scale) ………... 57
4.25 The temperature dependence of (a) the b-axis magnetic susceptibility and (b) b-axis magnetization for various pressures ………... 58 4.26 Thermal properties temperature dependence of (a) specific heat C(T) and
ix
LIST OF TABLES
1.1 Comparison of relevant d-electron energies ………. 4
4.1 Ba2YIrO6 structural parameters at 100 K ………..………... 44
4.2 (Ba0.63Sr0.37)2YIrO6 structural parameters at 100 K …………..……... 45
1 Chapter 1. INTRODUCTION
1.1 Correlated Electron systems - Mott physics
Early theoretical descriptions based on the filling of electronic bands (band picture) were successful in explaining properties of metallic, insulating or transitioning materials using the weakly interacting or non-interacting electron model. In 1937, however, reports surfaced that a number of materials with partially filled d-electron bands like NiO exhibited insulating or poor conducting properties, which contradicted the expectations of metallic behavior based on the previously successful band picture [1]. Band theory relied on treating an electron as weakly interacting, embedded in the mean field produced by the other electrons where the electron kinetic energy was significantly larger than their electron-electron (Coulomb) energy. However, electron-electron correlation has a much more substantial role with spin, charge, and orbital degrees of freedom having tremendous effects on material properties and a large number of unique behaviors. Electron correlation often leads to electron localization and is responsible for many phenomena such as ferromagnetism, antiferromagnetism, and superconductivity, including both insulating and metallic materials. Some of the more dramatic properties are significant responses to applied magnetic field (colossal magnetoresistance), large thermoelectric response, very high ordering temperatures and significant changes in resistivity across metal-insulator transitions [2]. Neville Mott was among the first who tried to explain the origin of insulating states in partially filled d- and f-orbitals as a result of strongly correlated electron interactions. He used a model with a single s-orbital at each lattice site where if fully occupied with spin up and spin down electrons, there would be strong Coulombic repulsion, which would open up a gap in the band that would be absent in the case of non-interacting electrons. This would result in splitting of the band into the Upper Hubbard Band (UHB), occupied by two electrons, and the Lower Hubbard Band (LHB) occupied by a single electron. In this case, even with one electron per site the LHB would result in an insulating state. Equation 1.1 is the simplest Hubbard Hamiltonian used to describe correlated electrons, taking into account only valence electrons near the Fermi level:
𝐻 = ∑ 𝑡𝑖𝑗𝑐𝑖𝜎†𝑐𝑗𝜎+ 𝑈 ∑ 𝑛𝑖↑𝑛𝑖↓ 𝑖
𝑖𝑗,𝜎
(1.1)
where first term represents kinetic energy, characterized by the hopping term tij, and the second term local Coulomb repulsion (σ = ↑ or ↓ indicates spin direction with i and j representing lattice sites each with localized electrons) [2]. The tij hopping term is what determines the bandwidth W and it is the competition between the bandwidth W and Coulomb interaction U that determines the properties of these materials. The simplified model of the effect of the relation between the two onto the density of states in the case of half filling, one electron per lattice site, is represented in Figure 1.1.
2
Figure 1.1: The Density of States as a function of Coulomb Interaction U: (a) independent electron model with U = 0, Fermi level sits at the middle of the band resulting in metallic state, (b) when electrons weakly interact (small U) there is narrowing of the band however the DOS still resembles that of independent electrons, (c) for strongly correlated electrons U > W, the spectrum displays three peaks: two Hubbard bands and a quasiparticle peak at the Fermi level, (d) when electron correlation is strong enough to cause the quasiparticle peak to vanish, spectral weight is transferred to the two Hubbard bands, thereby causing a Mott metal-insulator transition. [2]
Although initially Mott didn’t associate the insulating state with magnetic ordering, Slater later attributed the insulating state and band gap to the long-range magnetic order, more
3
precisely antiferromagnetic (AFM) order. However, the appearance of an insulating state without magnetic order has contradicted Slater’s band picture and the presence of the spin and charge gap indicated the possibility of a continuum between the Mott and the band insulator.
1.2 Interplay of strong spin-orbit interaction and electron correlation
Spin-orbit interaction is a relativistic effect that links the electronic orbital and spin angular momenta. The effect of strong spin-orbit interaction (SOI) in semi-conductors, which have weak electron correlation, has led to numerous exciting phenomena, such as the Anomalous Hall Effect (AHE), and more recently, topological insulators and metals
[3]. Nuclear charge can be suppressed by the fine structure constant. In the case of heavier atoms with large atomic number (and hence the large number of protons), the electric field produced by nuclear charge is significant and is substantial in iridates (Z = 77), which results in significant spin-orbit interaction. Atomic number increases as we move down the group in the periodic table, however at the same time for materials with large atomic number we observe more extended orbitals. In our case these are the d orbitals, and they cause an increase in radial separation between electrons, leading to a reduction in electron correlation U. The trend followed by electron correlation within the periodic table is opposite to that of atomic number, and increases as we move up the group in the periodic table Figure 1.2. Although most anomalous properties tend to be attributed to spin-orbit interaction in these materials, we will see that it is the competition between these relevant interactions that actually results in novel phases. These novel phases can be exquisitely sensitive to even slight perturbations induced by pressure, chemical doping and magnetic field.
Figure 1.2: Periodic table with trend of increase in spin-orbit interaction and electron correlation as a result of change in atomic number (Z) and orbital size respectively
4
Along with spin-orbit interaction, electronic ground states are also determined by electron correlation, which leads to localization of the electronic states, and the hopping parameter t, which represents kinetic energy of electrons hopping between atoms. There is an additional strong dependence of electronic states on the crystal structure, so its influence on the spin-orbit interaction and electron correlation need to also be investigated [4]. The effects of SOI and electron correlation have led to recent discoveries of new material phases
[5-6]. Spin-orbit and Coulomb interaction values for transition metals have been tabulated for comparison and are summarized in Table 1.1. While the spin-orbit interaction λso for 3d-elements is so minor that it can act as perturbation in comparison to Coulomb interaction U as we move down the periodic table to 5d-elements, we see that the two interactions are comparable not just to each other, but also to several other relevant energies in these materials like Hund’s coupling JH and crystal field Δ. As studies have been done on various 4d and 5d based oxides we could see that these energy scales vary slightly, resulting in a rich family of behavior [3].
Electron type U (eV) λso (eV) Interactions 3d 5.0-7.0 0.01-0.1 U > CF > λso
4d 0.5-3.0 0.1-0.3 U ~ CF > λso
5d 0.4-2.0 0.3-1.0 U ~ CF ~ λso
Table 1.1: Comparison of relevant d-electron energies [14]
1.3 Spin-orbit coupled Iridates
New phenomena observed in heavy transition metal oxides have attracted much of the attention due to the possibility of high temperature superconductivity, topological phases, quantum spin liquid, and other exotic states. These predicted new states are a result of the strong competition between Coulomb interactions, strong spin-orbit interaction, Hund’s rules and non-cubic crystal fields. As we will see when we look at the ground state of the compounds described in the following chapters, all iridates tend to be highly insulating, which as we discussed above, does not fit the conventional picture of materials with large extended d orbitals. In addition, the nature of extended 5d-orbitals in these materials should also result in fewer magnetic states compared to 3d based oxides. However, almost all iridates, particularly the layered Ruddlesden-Popper series Srn+1IrnO3n+1 and the hexagonal BaIrO3 exhibit antiferromagnetic order with low ordering moments but high transition temperatures. For example, 240 K for the single layer Sr2IrO4, 285 K for the double layered Sr3Ir2O7, 183 K for hexagonal BaIrO3 and 185 K for orthorhombic Sr0.94Ir0.78O2.68 [7-18]. The magnetic structures closely track lattice distortions as a result of the strong SOI [19-20].
Collaborative research between the Cao group and others led to a discovery of the novel Jeff = ½ insulating state, a result of a combined effect of the electron-electron correlation and SOI [7]. A critical underlying mechanism for the novel states in iridates is
5
the SOI that vigorously competes with U, non-cubic crystalline electric fields, and Hund’s rule coupling. The net result of this competition is to stabilize ground states that have exotic behavior. Without inclusion of the spin-orbit interaction, two possibilities arise; firstly, on its own, the strong octahedral crystal field of 10 Dq splits the wide 5d band into t2g (triplet) and eg (doublet) orbital states, where five 5d electrons partially fill the t2g band, leading to the metallic state depicted in Figure 1.3a. Since the energy gap between the t2g and eg states is too large, if electron filling is less than six we can ignore the eg doublet. Since most of the iridates studied have four or five d electrons, this can safely be implemented. An alternative case is where electron correlation is significantly larger than the bandwidth to the extent of being able to sufficiently open the gap to result in the insulating S = ½ Mott ground state as shown in Figure 1.3b. Now, although the latter gives rise to an insulating state, the strength of the Coulombic interaction would have to be strong enough (~10 eV) to overcome bandwidth, which as electron interaction is reduced for Ir atoms seems very unlikely (U ~ 0.4 - 2 eV). The newly proposed model includes the effect of both the strong spin-orbit interaction as well as electron correlation, as shown in Figure 1.3c-e. The SOI is a relativistic effect proportional to Z4 (Z = 77 for Ir), and has a strength of ~ 0.4 eV in the iridates (compared to ~ 20 meV in 3d materials), and splits the t2g bands
into states with the Jeff = 1/2 and Jeff = 3/2 character. Since Ir4+ (5d5) ions provide five 5d-electrons to bonding states, four of them fill the lower Jeff = 3/2 bands, and one electron partially fills the Jeff = 1/2 band where the Fermi level EF resides. The SOI yields a Jeff = 1/2 band that is so narrow that even a reduced U (~ 0.5 eV) operating within the extended 5d-electron orbitals is sufficient to open a gap Δ that stabilizes an insulating state in the iridates.
Figure 1.3: Graphical representation for 5d electron energy: (a) wide t2g band without SOI and U, (b) wide t2g band without SOI but unrealistically large U opening the gap, (c) with SOI but no U, (d) with both SOI and U resulting in Jeff = ½ insulating state, (e) 5d electron splitting by SOI and crystal field [7]
6 1.4 Sr2IrO4
1.4.1 Underlying observations
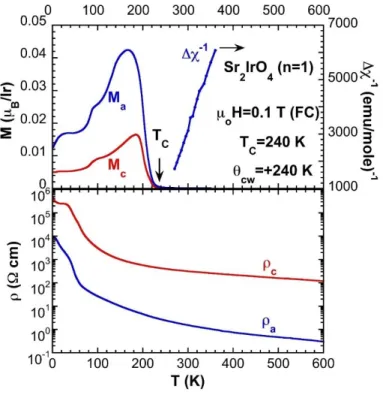
Sr2IrO4 is a single-layer member of the Ruddlesden-Popper series Srn+1IrnO3n+1, where n is the number of Ir-O layers in unit cell. It crystallizes as a reduced tetragonal structure (space-group I41/acd) due to rotation of the IrO6 octahedra by about 11° about the c-axis, also confirmed by neutron study of Sr2IrO4 [9-11, 21]. This crystal structure is similar to those of two known superconductors Sr2RuO4 and La2CuO4, drawing even more attention to a single-layer iridate. As mentioned earlier, most 5d electron based compounds, notably Sr2IrO4 and Sr3Ir2O7 tend to order at high temperatures, and the former is a weak ferromagnet, ordering with a Curie temperature of Tc = 240 K. Besides the ordering temperature at 240 K, we can observe in Figure 1.4 the additional two anomalies: one at TM1 ≈ 100 K and the other at TM2 ≈ 25 K, noticeable in both Ma and Mc measurements. Two anomalies have also been observed in our ac susceptibility data, which shows a frequency dependent peak at ~100K that could indicate magnetic frustration [9-11, 22-25]. We indeed see a decrease in magnetic anisotropy with the weakening of the signal in temperature dependence along the Ma direction and enhancement of the Mc signal, which indicates a changing magnetic structure below transition temperature.
Figure 1.4: Sr2IrO4 temperature dependence of: (a) the magnetization (left scale) and Curie-Weiss fitting (right scale), (b) the a- and c- axis resistivity
7
Although, as we will see in next section, that Sr2IrO4 can be easily driven to a metallic state by chemical doping, the pure compound electrical transport data shows a very insulating state for the whole temperature range from 1.7 K - 600 K. There are three distinct temperature regions closely following the regions bounded by transition temperatures in magnetic susceptibility data. When fitted to the activation law
𝜌(𝑇) ~ 𝑒∆⁄2𝑘𝐵𝑇 (1.2)
each region energy gap is as follows:
a) region I: 19 K < T < 26 K gives energy gap Δ = 18.4 meV b) region II: 26 K < T < 85 K gives energy gap Δ = 45.2 meV c) region III: 85 K < T < 350K gives energy gap Δ = 107.2 meV
where the region III value of Δ = 107.2 meV closely resembles the value measured optically 0.1 eV [7].
1.4.2 Chemical doping
Sr2IrO4, as mentioned above, crystallizes as a tetragonal structure with IrO6 octahedra that rotate about the c-axis, resulting in a larger unit cell volume by a factor of √2 x √2 x 2. There is a distortion of the in-plane Ir1-O2-Ir1 bond angle θ, which is very sensitive and critical for electron hopping, as slight changes to the bond angle can drive the very insulating Sr2IrO4 into a metallic state. One of the methods to alter the lattice distortion and bond angle is by chemical doping. Two very prominent examples are light doping with K+ and La3+ for Sr2+ at the A site. Besides the obvious doping with electrons and holes during this substitution, there are also significant differences in ionic size, which causes substantial changes in lattice parameters as K+ has an ionic radius of 1.38 Å, La 3+ is 1.03 Å and Sr2+ is1.18 Å. Changes in the bond angle as the doping level is increased can be seen in Figure 1.5.
Figure 1.5: Phase diagram of Ir-O-Ir bond angle θ as function of La and K doping concentration in (Sr1-xAx)2IrO4[24]
8
These changes in lattice parameters are directly reflected in electronic properties, where resistivity drops by a factor of 10-8 for La3+, and 10-10 for K+ as the doping level is increased to 4 and 2% respectively as shown in Figure 1.6. As the La3+ concentration is increased, the magnetic transition temperature decreases and fully vanishes while at the same time the metallic state is realized at 4%. However, the K+ doped sample although it reaches a metallic state at x = 0.02, the magnetically ordered state still persists at the same time (see Figure 1.6c) [24,26]. As we have seen in the parent compound, the magnetic transition temperature TC = 240 K does not show any anomaly in the electronic properties in this temperature region [27], whichindicates that there is no strong correlation between the electronic and magnetic properties, as anticipated. Similarly, decoupling between magnetic and transport properties is observed in (Sr0.98K0.02)2IrO4, where the metallic state is not accompanied by changes in magnetic state initiating more in depth look at the dependence of charge gap formation on magnetic interaction [28-29]. In the inset of Figure 1.6b there is an apparent drop below 10 K in resistivity which could imply sharp decrease in inelastic scattering below this temperature.
Figure 1.6: The a-axis resistivity ρa (a) and (b) the c-axis resistivity ρc for(Sr1-xLax)2IrO4, (c) the a-axis resistivity ρa and magnetization Ma for (Sr1-xKx)2IrO4 [24]
9
Unlike the tuning of lattice parameters and electron/hole doping we examined in the case of (Sr1-xAx)2IrO4 with A = K, La, we have also attempted to study the effect that the strength of SOI has on physical properties. To study this effect of altered strength of SOI, on the Ir site we have doped Rh4+ (4d5), and for comparison Ru4+ (4d4), which both have reduced SOI with the pure Sr2RhO4, which is a paramagnetic correlated metal with SOI of about 0.16 eV [31]. Since it is well known that Sr2RuO4 is a p-wave superconductor, we can see that the effect of strength of SOI is dependent on the electronic structure, lattice distortion, and Coulomb interaction. Sr2RhO4 is both electronically and structurally analogous to Sr2IrO4, including the rotation of the RhO6-octahedra about the c-axis but with smaller rotation of ~ 9.7° compared to 11° for Sr2IrO4. Since the ionic radius is significantly smaller for Rh4+ (0.600 Å) compared to 0.625 Å for Ir4+, it is no surprise that in Figure 1.7 we observe systematic changes in lattice parameters as the concentration changes in Sr2Ir1-xRhxO4 where (0 ≤ x ≤ 1).
Figure 1.7: Lattice parameter changes as function of Rh concentration in Sr2Ir1-xRhxO4: (a) a- and c-axis, (b) unit cell volume and Ir/Rh-O-Ir/Rh angle [34]
Although SOI is reduced as the Rh concentration is increased, no significant change in band filling is to be expected because the reduced SOI only reduces the band splitting, while the Fermi energy still lies between the Jeff = ½ and Jeff = 3/2 bands, and as result of disorder, easily leads to electron scattering [30-33]. Similar behavior is expected from Sr2Ir1-xRuxO4, however, unlike the Rh doping, instead of five 4d electrons Ru provides only four 4d electrons, resulting in additional hole doping into the t2g band as well as a reduction in SOI. This hole doping shifts the Fermi energy within the now reduced splitting between
10
Jeff = ½ and Jeff = 3/2 bands, placing the Fermi energy just inside the lower band and easily driving the system into a metallic state [34-35]. The density of states is increased at the Fermi energy and the scattering due to disorder has no significant consequence. Now, while the Ru doped system can easily be driven into a robust metallic state, Rh substitution features three distinct regions differing by Rh concentration in Sr2Ir1-xRhxO4:
Region I: 0 ≤ x ≤ 0.24 features reduction in resistivity by six orders of magnitude and even exhibits a metallic state above 50 K in a-axis resistivity. While the c-axis is reduced, it still demonstrates insulating behavior over the whole temperature range. In this range the magnetic order is reduced, and fully vanishes at x = 0.16.
Region II: 0.24 ≤ x ≤ 0.85 unexpectedly exhibits an increase in insulating state as the magnitude rises up to 107 Ω cm until it drops again at x = 0.75. In the temperature range between 2 K and 100 K, data can be fitted to the variable range hopping (VRH) model which describes low temperature conductivity in strongly disordered systems where ρ ~ exp (1/T)1/2, indicating presence of Anderson localization due to disorder.
Region III: 0.85 ≤ x ≤ 1 close to x=1 we observe the metallic state.
Figure 1.8 presents the phase diagram of the Sr2Ir1-xRhxO4 as a function of Rh concentration x, and its variation with temperature based on the results briefly discussed above. Rh doping effectively reduces SOI and enhances Hund’s rule coupling, which in turn competes with SOI. Although, the decrease in SOI brings on the decrease in resistivity and the vanishing of the magnetic transition temperature at x = 16 %, continued increase in Rh results in disorder on the Ir/Rh site and the mismatch between the energies of the Ir and Rh site in the octahedron impedes the hopping of the electrons between the two.
11
1.4.3 Remarkable effect of Tb doping: Sr2Ir1-xTbxO4
In our interest to study the effect of reduction of SOI on tetravalent Sr2IrO4, as well as the interaction between 4f and 5d electrons we have comprehensively studied the single crystals of Sr2Ir1−xTbxO4 (0 ≤ x ≤ 0.03). Our initial anticipation was for tetravalent Tb4+ (4f7) to occupy the Sr2+ site, however extended measurements using X-ray absorption spectra have proved that the Tb instead occupies the Ir4+ site and reduces SOI and tetragonal crystal electric field while enhancing Hund’s rule coupling. Although, it is no surprise that the slight doping of just 3% of Tb has already succeeded in full suppression of magnetic order, since this was already observed at 4% La3+ doping. What is unlikely is the persistent insulating state that seems to be decoupled from the antiferromagnetic order, and is unaffected by full AFM state suppression. One potential reason for preventing the metallic state from forming might be due to mismatch in energy levels between Ir and Tb ions. However, as described later in Chapter 4, that in addition to this decoupling of AFM order and the insulating state is the new spiral incommensurate magnetic order at just 3%, which is supported both by neutron measurements as well as by the large specific heat at low temperatures. More generally, this behavior manifests once again an unusual correlation between the magnetic and insulating states in the iridates.
1.5 Breakdown of Jeff = 0 singlet ground state
The properties of iridates have been driven by the distinctive combination of strong SOI, electron correlation, and crystal electric fields. This interplay of very comparable interaction energies has led to exotic complex magnetic states, and as a result, was the basis for the origination of Jeff = ½ Mott insulating state model which successfully described properties seen in most of the iridates thus far. Even though most of the studies were done on tetravalent Ir4+ ion based compounds, the few pentavalent compounds, such as nonmagnetic NaIrO3, also satisfied this model as the four 5d electrons available in pentavalent ion, in a strong SOI regime, would fill the lower band resulting in a Jeff = 0 singlet ground state. Recent work has shown that magnetic states in pentavalent Ir can arise due to competition between noncubic crystal fields, SOI, singlet-triplet splitting and exchange interactions [36-37]. However, as we will see in more detail in Chapter 4, our own study of double perovskite iridates, encompassing pentavalent Ir ions Sr2YIrO6 and (Ba1-xSrx)2YIrO6, both of which show exotic magnetic states at low temperatures indicate breakdown of the Jeff = 0 singlet ground state. The Sr2YIrO6 magnetic state below 1.3 K was attributed to the non-cubic crystal field due to strong distortion in the crystal structure which was not accounted for in the initial Jeff = ½ Mott state model. Nevertheless since we studied cubic (Ba1-xSrx)2YIrO6, which also orders magnetically, we suspected other possible origins to the magnetic moment in the pentavalent Ir systems: (1) possibility of overlap between the Jeff = ½ and Jeff = 3/2 bands due to increased electron hopping, (2) independent electron picture for SOI, electron hopping and crystal fields and (3) band structure effects where eg orbitals play no role, resulting in breakdown of theJeff = 0 state in cubic Ba2YIrO6. More details and discussion on this will be presented in Chapter 4.
12
1.6 Wide gap between experimental observation and theoretical proposals
Since the first discovery of iridates and the first observation of their unconventional properties, there has been extended theoretical work predicting possible exotic phases, of which most are yet to be experimentally realized. Due to competition between SOI and electronic correlations, many interesting properties are to be expected, including phases with unusual topological properties and exotic surface states, unconventionally magnetically ordered states and quantum spin liquids [38-44]. In addition, in layered cuprates charge doping to Mott insulators has induced high-temperature superconducting states, and theoretical predictions have already been made that similar high-temperature superconductivity could be realized in doped Sr2IrO4 or other iridates [45-47]. However, even though there has been successful doping to Sr2IrO4 and the system has been driven to metallic state, no superconducting state has yet been realized. Charge doping, both La and K into polycrystalline Ba2IrO4, in attempts to achieve superconductivity has also been unsuccessful. However, a semi-metallic state at above 15% La and K doping has been observed, as well as a pressure induced metallic state down to 4.2 K [48], while pressure even as high as 55 GPa has failed to induce any metallic state in Sr2IrO4 [49-51].
Additionally, complex magnetic behavior can be observed due to the combined effects of SOI and crystal-field stabilizing spin-orbit entangled magnetic moments, like those for Ir4+ ions at the center of IrO6 octahedra. These have been theoretically proposed to interact via strong-anisotropic exchange interaction, leading to large frustration effects forming new magnetic states, such as the quantum spin liquid, which led to extended experimental study of Na2IrO3 and Li2IrO3 as a potential candidates for the Kitaev model
[52-54]. The study of Dirac fermions has led to new research areas such as Weyl semi-metals and topological insulators. Since these require strong SOI for stability, there have been extended questions as to whether they could be observed in iridates or other electron-correlated materials. Of these, two have already been proposed as potential candidates as topological insulator Sr2IrRhO6 [55] and pyrochlore iridates as Weyl semi-metals [56]. However, most of the proposed candidate physical properties have yet to confirm theoretical predictions as direct observation of the proposals hasn’t been realized yet. The gap between experimental results and theoretical prediction has yet to be overcome.
13 Chapter 2. EXPERIMENTAL METHODS 2.1 Single crystal synthesis
Single crystals are arrays of a well-defined chemical motif that are periodic in three dimensions. Although their growth is generally much more difficult and time consuming than for poly-crystalline materials, there are many advantages - from uniformity in composition and anisotropy present in single crystals to the absence of grain boundaries which are obviously present in poly-crystalline samples. Besides these advantages in terms of physical properties measurement, high-quality single crystals are a must in many technological applications. There are various methods for single crystal growth, each with its own advantages for growth of certain type of materials. Some of the methods we used to grow single crystals are:
a) Growth from solution (flux method)
b) Growth from the liquid phase (floating zone method, Bridgman, etc.) and
c) Growth from gas phase (chemical vapor deposition, pulsed laser deposition, etc.). All three of these methods are different in their own way and produce single crystals of various sizes. Figure 2.1 shows some of the single crystals grown by flux method. The spatial extent for these single crystals is in millimeter range while for poly-crystalline samples, individual grain size tends to be in the micrometer range.
Figure 2.1: Flux grown single crystals: (a) Sr2IrO4 and (b) Ba5AlIr2O11
2.1.1. Flux method for single crystal growth
The flux method is solution growth at very high temperatures, close to and above 2000°C, hence it is suitable for growth of congruently as well as incongruently melting materials. Due to the high growth temperature, crucibles are chosen that can withstand high temperatures, have low reactivity with most fluxes and are highly resistive to most chemical attacks. Most commonly used crucibles for the flux method are high alumina (99.8% Al2O3) or platinum crucibles. The method for flux growth entails heating of the crucible containing flux mixed with solute to high enough temperature until all the solute materials have fully dissolved. Materials are held at this final temperature for several hours and then very slowly cooled down to room temperature. Single crystals grown by this method tend to be small in size but have very few impurities. Most issues arising from growth using the flux method is related to flux becoming embedded inside the crystals or
14
due to difficulty retrieving or separating grown single crystals from the flux. In order to prevent or remedy these obstacles, selection of proper flux choice is crucial. Besides the low melting temperature, the chosen flux should not form stable compounds with the solute and should be easily separated from the single crystals. The two most important advantages are that the range of materials that can be grown via the flux method is very large and flux grown crystals tend to show natural surfaces. Examples of single crystals studied in this work, Sr2IrO4 and Ba5AlIr2O11, are shown in Figure 2.1. The method for growth of each of these materials are explained below:
Sr2Ir1-xTbxO4 - single crystals were grown from non-stoichiometric quantities of
SrCl2, SrCO3, IrO2 and Tb4O7 using a self-flux variation of the technique. The constituents in powder form were ground together and placed in a platinum crucible in preparation for single crystal growth. The mixture was heated to 1470° C, to melt all the material, and it was maintained at the same temperature for over 20 hours. It was then cooled down to 1400° C at the rate of 2° C/hr and then cooled quickly to room temperature.
(Ba1-xSrx)2YIrO6 - single crystals were grown using the self-flux technique from
non-stoichiometric quantities of IrO2, BaCO3 and SrCO3, and Y2O3. The mixture of powdered constituents was heated up to 1440° C, where it was maintained for five hours and then slowly cooled down at 2° C/hr. Typical single crystals were approximately 1.0 x 1.0 x 0.5 mm3.
2.1.2 Floating zone method for single crystal growth
15
The floating zone method is another frequently used technique in our laboratory, using an NEC two-mirror model SCII-MDH-11020 floating-zone optical furnace. One of the most beneficial aspects of this method is successful growth of very large single crystals, as well as the exceptional purity of single crystals grown. The growth technique involves: (1) Initial preparation of several grams of polycrystalline material that we intend to grow in single crystal form. Stoichiometric amounts of the main constituents for the growth of desired compound are mixed and ground in powder form. The mixture is then placed into an alumina crucible and sintered to produce the polycrystalline form of the single crystal we intend to grow. At this point, most often methods like powder x-ray diffraction are used to ensure that the correct phase, free of impurities, has been produced.
(2) This polycrystalline powder is then pressed into a long rod using commercial latex balloons and sintered into a long rod, whose uniform density, shape and thickness are crucial for successful single crystal growth. The sintered rod, averaging about 7-8 cm in length is then cut into two parts. The longer part is hung on the upper shaft of the furnace (feed) and shorter one (seed) is attached to the bottom shaft (see Figure 2.2)
(3) A small uniform molten zone is maintained by surface tension between the feed material and the seed. The feed material rod is lowered at a very slow rate into the molten zone while both upper and lower shaft are slowly lowered out of the zone to facilitate cooling and single-crystal growth. Stability of the molten zone is critical to maintain uniform phase growth, limit defects, and suppress twinning in the crystal.
16
The growth atmosphere within the FZ furnace can be adjusted from vacuum to inert or to oxygen-rich to provide environmental control necessary for the materials to grow. One downside of the floating zone method is that for materials that have high vapor pressure it can be difficult to control loss of the material as high temperature is approached. One way to remedy this is to add excess material to compensate for the loss during growth, since the pressure that we can apply only reaches 0.97 MPaand this is often not enough to control the loss of high vapor materials. The most beneficial feature of the FZ method is that any impurity will prefer to stay in the molten zone, and will be pushed to the end of the feed material resulting in highly pure single crystals. There are several variables that can influence the quality of the grown single crystals besides the quality of the rod, which is often most critical parameter. Some of the others are (1) the rate at which the material is crystallized, as slow rates tend to yield large single crystals, but are not always favorable in the case of materials with high vapor pressure constituents (vide supra), (2) large temperature gradients that lead to cracks due to thermal stress and (3) rotation and the temperature of the molten zone. While rotation is necessary for uniform mixing, it can cause cracking if not well controlled; and although the temperature in the molten zone needs to be high enough to ensure full melting of the rod in the zone, if too high, it can cause cavitation in the zone and frequent discontinuities due to liquid material loss and bubbling, which causes deformities in the single crystals.
2.2 Materials structural characterization 2.2.1 Powder X-ray diffraction
In order to have a more comprehensive understanding of synthesis, structure and properties of materials it is important to know the arrangement of atoms inside the crystal structure of a material. There are many different methods that deliver structural information over varying distance scales, but the most comprehensive and detailed information is provided by methods which involve diffraction. In a diffraction experiment, an incident wave is directed onto the material while a detector collects sufficient diffraction maxima to either solve the structure or to act as a fingerprint via pattern matching. Since a diffraction pattern represents the range of periodicities in the material, at low angles we are able to observe diffraction peaks corresponding to long range periodic arrangement of atoms, while short-range periodic arshort-rangement is observed at high angles. The incident wave in a diffraction experiment must have a wavelength comparable to spacing between atoms, i.e., of the order of an ångström. Crystals that have unambiguous and precise atomic arrangements give sharp diffraction peaks. In addition to X-ray diffraction, there are also electron and neutron diffraction, which operate by different physical mechanisms, however, they all have one common requirement, and that is the fulfilment of the Bragg’s law:
17
In order to briefly describe derivation of Bragg’s law and to derive the conditions necessary to observe interference of waves scattered by the two planes as shown in Figure 2.4 it is instructive to look at the geometric construction of a simple structure consisting of two atomic planes separated by distance d.
Figure 2.4: Graphical illustration of Bragg’s equation derivation
As we can see from the image above, the incident angle for both parallel rays is θ, and the plane separation d determines the difference in path length between the two scattered rays. This path difference equals 2dsinθ, corresponding to the left hand side of the Bragg’s law, and to observe constructive interference this path difference needs to be equal to nλ, where n is an integer. Most of the diffraction patterns contain numerous diffraction peaks with different peaks corresponding to different inter-planar spacing, d.
In cases where powder polycrystalline samples are measured, there are randomly oriented crystals in large quantities in the sample, so all Bragg peaks are observed. From the diffraction peaks and angle θ we could determine the inter-planar spacing for each diffraction peak. Some of the more simple equations for the lattice parameters are presented below, corresponding to cubic, orthorhombic, and tetragonal crystal systems:
1 𝑑2 = ℎ2+ 𝑘2+ 𝑙2 𝑎2 (𝐶𝑢𝑏𝑖𝑐 𝑐𝑟𝑦𝑠𝑡𝑎𝑙 𝑠𝑦𝑠𝑡𝑒𝑚) 1 𝑑2 = ℎ2 𝑎2+ 𝑘2 𝑏2 + 𝑙2 𝑐2 (𝑂𝑟𝑡ℎ𝑜𝑟ℎ𝑜𝑚𝑏𝑖𝑐 𝑐𝑟𝑦𝑠𝑡𝑎𝑙 𝑠𝑦𝑠𝑡𝑒𝑚) 1 𝑑2 = ℎ2 + 𝑘2 𝑎2 + 𝑙2 𝑐2 (𝑇𝑒𝑡𝑟𝑎𝑔𝑜𝑛𝑎𝑙 𝑐𝑟𝑦𝑠𝑡𝑎𝑙 𝑠𝑦𝑠𝑡𝑒𝑚)
18
Even though determining lattice parameters for some crystals could be done by hand, most samples with large number of atoms, especially for lower symmetry, cannot. The easiest way to determine the majority or any impurity phase, is by comparing the obtained diffraction pattern to a database, which contains diffraction patterns for most crystalline materials made to date. One of the most common uses of powder X-ray diffraction method is for determining if there are any unknown crystals/phases within the sample. Discovering any additional peaks not corresponding to the known database pattern could indicate an impurity phase or additional crystals present in the material. One of the powder diffraction patterns from a polycrystalline Sr2IrO4 sample intended for use as a target in a pulsed laser deposition experiment is pictured below in Figure 2.5, with red lines indicating peaks from the database pattern.
Figure 2.5: Powder diffraction pattern for Sr2IrO4 obtained using Bruker D8 Advance Diffractometer
2.2.2 Single crystal X-ray diffraction
Although powder X-ray diffraction is frequently used in our laboratory, to get the most information from crystal and molecular structure, symmetry and packing, the use of single crystal x-ray diffraction is essential. For our single crystal structure determination we have used two different facilities, one at the University of Kentucky Chemistry Department
X-19
ray Facility, which has a Nonius Kappa CCD diffractometer with Mo Kα X-ray source and the Rigaku X-ray diffractometer equipped with a PILATUS 200 K hybrid-pixel-array detector at Oak Ridge National Laboratory.
In order to obtain enough information to solve the single-crystal structure several hundred to a few thousand images are obtained from various single crystal orientations. To be able to obtain all the images classical single crystal x-ray diffractometers used a four-circle goniometer. These four circles refer to four independent angles as seen in Figure 2.6 below. However, our single crystal x-ray diffraction measurements have been taken by the use of Kappa-type goniometer, where χ is replaced by κ which is coupled with Ω and ϕ in a three circle stage.
𝜙 − 𝑎𝑛𝑔𝑙𝑒 𝑜𝑓 𝑟𝑜𝑡𝑎𝑡𝑖𝑜𝑛 𝑎𝑏𝑜𝑢𝑡 𝑔𝑜𝑛𝑖𝑜𝑚𝑒𝑡𝑒𝑟 ℎ𝑒𝑎𝑑 𝑎𝑥𝑖𝑠 𝜒 − 𝑎𝑛𝑔𝑙𝑒 𝑜𝑓 𝑖𝑛𝑐𝑙𝑖𝑛𝑎𝑡𝑖𝑜𝑛 𝑜𝑓 𝑡ℎ𝑒 𝜙 𝑎𝑥𝑖𝑠
Ω − 𝑎𝑛𝑔𝑙𝑒 𝑜𝑓 𝑟𝑜𝑡𝑎𝑡𝑖𝑜𝑛 𝑜𝑓 𝑠𝑖𝑛𝑔𝑙𝑒 𝑐𝑟𝑦𝑠𝑡𝑎𝑙 𝑤𝑖𝑡ℎ 𝑟𝑒𝑠𝑝𝑒𝑐𝑡 𝑡𝑜 𝑝𝑟𝑖𝑛𝑐𝑖𝑝𝑎𝑙 𝑎𝑥𝑖𝑠 𝑜𝑓 𝑔𝑜𝑛𝑖𝑜𝑚𝑒𝑡𝑒𝑟 2𝜃 − 𝑡ℎ𝑒 𝑠𝑤𝑖𝑛𝑔 𝑎𝑛𝑔𝑙𝑒 𝑜𝑓 𝑡ℎ𝑒 𝑑𝑒𝑡𝑒𝑐𝑡𝑜𝑟
Figure 2.6: Classical single crystal diffractometer four circle operational schematic
The data collection process collects large number of diffraction peak images, most commonly using a CCD camera as a detector to collect all symmetrically inequivalent diffraction peaks and their intensities. These peaks/diffraction spots carry contribution from the atoms in the original object so it is necessary to collect all unique diffraction spots out to sufficient resolution in order to complete structural refinement. Based on the intensity of the diffraction patterns, information about electron density can be obtained. Atom locations correspond to electron density maxima.
The process of single crystal structure determination involves selection of a single crystal of regular shape (most preferred spherical) and small in size about 50 - 150 μm to ensure
20
absorption of x-rays within the single crystal is minimized. Visual inspection of several images of the diffraction pattern is usually sufficient to determine the quality of the sample and the possible presence of twinning inside the crystal. If the single crystal is of high enough quality, a full data set is collected. The number of images and angular rotation necessary depends on the symmetry of the crystal. Initial structure solution is typically done using SHELXS, SHELXT (or some other program), or by comparison to a related known structure. The final structure model is refined by full-matrix least-squares using programs such as SHELX-97 [57].
2.2.3 Energy Dispersive X-ray Spectroscopy
Unlike powder and single-crystal X-ray diffraction, which mainly focus on structure determination, energy dispersive x-ray spectroscopy (EDX) centers more on elemental analysis of the material. In this work, a Hitachi/Oxford 3000 EDX instrument was used. The technique entails charged electrons or X-rays being directed at the sample with enough energy to excite one of the bound electrons. This leaves an empty hole, which is subsequently filled by an electron from a higher energy level. As the electron from the higher energy level fills the hole, the energy difference can be released in form of an X-ray
[58]. An energy dispersive spectrometer can thus be used to determine the energy and the number of emitted X-rays, and since each element has its own characteristic set of peaks in electromagnetic atomic spectra, we can obtain information about the elemental composition of the sample. A schematic representation of the process is shown in Figure 2.7.
Figure 2.7: Energy-dispersive X-ray spectroscopy operational principle
Moseley’s relation (Equation 2.2) is often used to relate the transitions (in the relation represented by constants B and C) to the atomic number Z and the wavelength of the
L -> K results in emission of Kα M -> K results in emission of Kβ M -> L results in emission of Lα
21
characteristic X-ray beam. The subscripts α and β in the Figure 2.7 represent different families of transitions and the sample EDX spectrum is shown in Figure 2.8.
𝜆 = 𝐵
𝑍 − 𝐶2 (2.2)
Figure 2.8: EDX spectrum of single crystal Sr2Ir1-xRhxO4 discussed in this work 2.3 Magnetic property measurements
For most materials, the orbital angular momentum and its intrinsic spin are reflected in the temperature or field dependent magnetic signature. Certain materials, such as permanent magnets, can produce magnetic fields in the absence of external magnetic fields. Depending on the existence and alignment of magnetic moments with the applied external field, we can define three most commonly encountered types of magnetism: diamagnetism, paramagnetism, and ferromagnetism. Magnetic properties are a crucial component in the determination of the ground state of a material under study, and in addition to the other physical properties, they define the characteristics of a material.
Magnetization measurements performed in this work were taken using a Quantum Design MPMS-7T SQUID Magnetometer with a Helium-3 system, capable of reaching temperatures down to 0.44K. Some of the advantages of using the MPMS system are ease of temperature and magnet control, as well as the use of a unique superconducting SQUID amplifier system. The procedure for DC magnetization measurements includes sample mounting onto the quartz rod, which is located at the bottom of the measurement probe that is subsequently installed into the sample chamber. Upon proper loading, the sample is centered with respect to the pickup coils and is ready for measurements.
As the sample moves through the pickup coils, the SQUID measures the change in flux and converts the flux directly to voltage (see Figure 2.9). For our measurements, a 7 Tesla superconducting magnet is used to magnetize the sample while the pickup coils detect the sample magnetic moment.
22
Figure 2.9: DC SQUID illustration with sample moving through pickup coils [59]
The illustration of the DC SQUID pickup coils in Figure 2.9 shows the set of four superconducting coils. One set of two (center) are wound clockwise, while the two single coils, one each at bottom and the top of the pickup coils, are both wound counterclockwise. The rationale behind the specific winding order is to cancel the contribution from the MPMS superconducting magnet or any other contribution not coming from the sample. As the sample is moved through the pickup coils, magnetization of the sample induces an electromotive force inside the pickup coils and the amplified signal is detected by the SQUID electronics. The high sensitivity of the pickup coils of 10-8 emu enables measurement of very small single crystals in the temperature range of 1.7 K to 400 K, with an added low temperature option (iHelium-3 system), which supports temperatures down to 0.44 K [59].
2.4 Transport properties measurements
The transition metal oxides (TMO) studied in this work (see introductory Chapter) cover a wide range of electrical transport properties from insulators to metals and superconductors, all of which have been observed in TMO. A Quantum Design MPMS-7T has been used for our transport measurements to enable characterization in high magnetic field, and in the range 1.7 K to 400 K, with the electrical resistivity measurement facilitated by a Linear Research 700 AC bridge and the combined 2400 Keithley Sourcemeter and 2182 Keithley Nanovoltmeter for DC current measurements. For high temperature measurement up to 900 K we have used a Displex closed cycle Helium cryostat by Advanced Research System again in combination with set of Keithley meters.
Electrical resistivity was measured using the four-probe method, which relative to the more common two-probe method has the advantage of eliminating contribution from contact and wire resistance. The method includes two current leads attached such that the current passes fully through the cross sectional area, thus ensuring the same current, I, through the sample. Then the two adjacent voltage leads can be applied to measure potential difference without the inclusion of the contact or wire resistance, as no current passes through these voltage leads. From the voltage drop measured and the input current, I, we can determine sample resistance via Ohm’s law
23
𝑅 = 𝑉
𝐼 (2.3)
However, in order to characterize how strongly a sample opposes the flow of electrons as its intrinsic bulk property, we need to calculate electrical resistivity using the sample dimensions via the relation for electrical resistivity defined by
𝜌 = 𝑅𝐴
𝑙 (2.4)
where A is the cross sectional area of the sample, and l distance between the two voltage probes.
For our measurements, gold wires of 0.001 inch diameter were used for contact probes, with the contacts made using two component epoxy H20E. The sample is then secured to the measurement probe in the desired direction relative to the magnetic field by using GE varnish.
This has been the standard procedure used for all our measurements, but with the addition of using a high temperature ceramic to secure the sample to the measurement probe in the case of high temperature measurements, as GE varnish cannot withstand such high temperatures.
2.5 Thermal properties measurements
Heat capacity measurements historically have not been so common because they were much more difficult to execute, and less reliable compared to electrical transport. However, these days heat capacity measurements are fairly common due to the advent of instruments such as the Quantum Design Physical Property Measurements Systems (PPMS), which offers dilution refrigerator options for measurement from 400 K down to 0.05 K in magnetic fields of up to 14 T. The benefits of heat capacity measurement range from the ability to extract information about the magnetic, electronic and lattice properties, as well as information about density of states and energy levels when measured at low temperatures [60].
24
Figure 2.10: PPMS Heat Capacity Option Sample Platform thermal connections[51]
The measurement procedure involves sample attachment to the sample platform using thermal conducting Apiezon grease: type H for high and type N for low-temperature measurements. Prior to sample measurement, an addenda is measured with just grease applied to the sample platform to assess heat capacity of the system without the sample, and this is later subtracted from the experimental signal to ensure that the final sample measurement does not include any contribution from the grease. The QD Heat Capacity option uses a relaxation technique to fit the response of a measurement cycle of heating followed by a cooling period to the model that accounts for thermal relaxation of sample platform, as well as the sample itself. The response can be fitted to two different models:
(1) Simple model: this assumes that the sample and sample platform are in good contact and at the same temperature during measurement.
(2) Two-tau model: this is used when the sample has poor contact with the sample platform, resulting in a temperature difference between the two. This model accounts for any difference by simulating heat flow between the sample and sample platform, as well as sample platform and sample puck [60].
2.6 Dielectric measurements
A material is categorized as dielectric if the material has a propensity to store energy when an external electric field is applied. For example, if a DC voltage source is placed across a parallel plate capacitor, more charge is stored when a dielectric is placed between the plates compared to a capacitor with vacuum between the plates [61]. The relation between capacitance and dielectric constant is
𝐶 = 𝜅𝜀0𝐴

![Figure 1.6: The a-axis resistivity ρ a (a) and (b) the c-axis resistivity ρ c for(Sr 1-x La x ) 2 IrO 4 , (c) the a-axis resistivity ρ a and magnetization M a for (Sr 1-x K x ) 2 IrO 4 [24]](https://thumb-us.123doks.com/thumbv2/123dok_us/1793133.2756452/20.918.252.715.397.1026/figure-axis-resistivity-axis-resistivity-iro-resistivity-magnetization.webp)
![Figure 1.7: Lattice parameter changes as function of Rh concentration in Sr 2 Ir 1-x Rh x O 4 : (a) a- and c-axis, (b) unit cell volume and Ir/Rh-O-Ir/Rh angle [34]](https://thumb-us.123doks.com/thumbv2/123dok_us/1793133.2756452/21.918.322.707.484.804/figure-lattice-parameter-changes-function-concentration-volume-angle.webp)