Internet Access and Use by Farm Households
Ashok K. Mishra And
Robert P. Williams†
Paper for presentation at the 2006 AAEA annual meeting Long Beach, CA
July 23-26, 2006
Copyright 2006 [Mishra and Williams]. All rights reserved. Readers may make verbatim copies of this document for non-commercial purposes by any means, provided that this copyright
notice appears on all such copies.
† Ashok Mishra and Robert Williams are Ag. economists with the United States Department of Agriculture, Economic Research Service. The views presented in this manuscript represent those of the authors and do not necessarily reflect those of the USDA.
Internet Access and Use by Farm Households
Abstract
The Internet is a strategic technology because it has found application across virtually all sectors of the economy. The Internet has become an everyday part of rural life and is an important new technology in U.S. agriculture. This study uses information collected through the 2004
Agricultural Resource Management Survey (ARMS) to explore the adoption of computers with Internet access and Internet use by farm households. Results from this study suggest that adoption of computers with Internet access is positively related to age and educational level of the operator, off-farm business income, presence of a spouse, and regional location of the farm. Further, large farms and part-owner farms are more likely to adopt computers with Internet access. Internet use for the farm, household, or both is strongly related to the educational level of the operator and spouse, presence of teenagers in the household, farm size, and regional location of the farm.
Internet Access and Use by Farm Households
IntroductionOver the past five years, since the implementation of the E-government (E-Gov) initiative of the President’s Management Initiative, Federal agencies have been directed to provide citizens increased electronic access to the forms and documents required to do business with the government. While participation is not mandatory, citizens find it is both convenient and
efficient to access and submit forms and required information electronically to the Government. Agriculture, as a Federal Agency that deals with both a large and geographically dispersed clientele, has particularly sought means to promote use of E-Gov. Agricultural producers in all 50 States have the option of providing necessary data for participation in farm programs
electronically. The Farm Service Agency, a major provider of farm program payments to farmers, currently has 78 farm program forms available to farmers to complete and submit electronically via the Internet. Many other Federal Agencies that administer programs to the nation’s farmers have done likewise.
The Internet is a strategic technology in that it has found application across all sectors of the economy (Cohen et al., 2001). Farming and other agriculture related industries are no exception (Kinsey, 2001). While participation in Federal government programs is only one reason that America’s farmers use the Internet, it has promoted increased interest in Internet use among farmers. Data available from USDA’s Agricultural Resource Management Survey (ARMS), while not containing information regarding farmers’ electronic program participation, do enable researchers to evaluate farmers’ ability to access the Internet from their home or business location. It is important to note that the value of the Internet extends beyond its role in farming and economic activity to include the social realm as well. The Internet permits the
formation of online communities (or virtual communities) and access to cultural and social networks beyond an individual’s locality (Wellman et al., 1996). As a social entity, a family farm consists of a dual organizational structure—a farm business and a household consisting of the farm operator and family members. The implication for Internet adoption is that in addition to the farm business, the Internet has many uses for the farm household.
According to the U.S. Census Bureau approximately 62 percent of U.S. households owned a computer and nearly 75 percent of U.S. households with a phone line have access to the Internet (Feb. 2005 Neilsen//NetRatings Survey). Internet access was 66 percent in February 2004, a nine percentage point rise in one year. There has been steady penetration of the Internet into rural areas in recent years (Mishra and Park) and more than half of rural adults—52 percent- now go online. Rural residents are enthusiastic users of the Internet at an early stage in their adoption of the technology—45 percent of rural newcomers go online daily.
Rural areas are also home to farm households. The pattern of computer adoption and general Internet use by farm households is different than that of other households. Farm
households use computers for their farm businesses as well as for household purposes. In 2004 approximately 56 percent of all family farms had Internet access (Agricultural Resource
management Survey, ARMS). The 56 percent of family farms with access were comprised of 36.0 percent that had Internet access but did not make any Internet purchases while the
remaining 20 percent had Internet access and made purchases of farm supplies and equipment, household items, or a combination of farm and household items online (figure 1).
Previous studies have focused on computer adoption by farmers and Internet
adoption/use by farmers (Putler and Zilberman; Batte, Jones, and Schnitkey; Ortmann, Patrick, and Musser; Batte et al.). In general, these studies focused on computer adoption and its impact
on economic performance of the farm business (Batte (2004); Willimack, Lazarus and Smith; Lazarus, Streeter, and Jofre-Giraudo). However, the literature provides little or no evidence on various factors that impact Internet use for farming activities, household use, or both farming and household use. Further, although a number of arguments (and an equally impressive volume of empirical results) have addressed this issue, the existing empirical literature has taken a rather narrow approach to the problem. In particular, existing theoretical and empirical research has largely focused on the farm business as the relevant unit of analysis rather than the farm household. The decision-making framework may become much more complex and thus the implications more clouded when one broadens the consideration of policy impacts to include those impacts on the nonagricultural segments of the farm sector.
This study addresses these questions. In particular, this paper investigates; (1) the factors associated with adoption of computers with Internet access; and (2) identifies factors such as farm, operator, regional, and household characteristics that influence farm input and equipment purchases and household purchases once the computer with Internet access is established. The model emphasizes the role of human capital, namely education, on the probability of adopting Internet use. The need to analyze the contribution of the human factor in Internet adoption is due to the continuing rise on the number of U.S. farm operators with higher education1. The analysis is conducted on a national level with the unique feature of a larger sample than previously reported, comprising farms of different economic sizes and in different regions of the United States.
Data and Methods
(ARMS) conducted annually by the Economic Research Service and the National Agricultural Statistics Service. The survey collects data to measure the financial condition (farm income, expenses, assets, and debts) and operating characteristics of farm businesses, the cost of producing agricultural commodities, and the well-being of farm operator households.
The target population of the survey is operators of farm businesses representing agricultural production in the 48 contiguous states. A farm is defined as an establishment that sold or normally would have sold at least $1,000 of agricultural products during the year. Farms can be organized as proprietorships, partnerships, family corporations, nonfamily corporations, or cooperatives. Data are collected from one operator per farm, the senior farm operator. A senior farm operator is the operator who makes most of the day-to-day management decisions. For the purpose of this study, those operator households organized as nonfamily corporations or cooperatives and farms run by hired managers were excluded.
The 2004 ARMS also queried farmers on two issues related to computers and their use. First, the questionnaire asked farmers if the farm had access to a computer with Internet access. Secondly, if the Internet was used to buy farm equipment and/or inputs or household items. The first model is estimated using a logit regression model, estimating a likelihood-of-adoption (0,1) model that recognizes the 0,1 nature of computers with Internet access being adopted. Adoption of computers with Internet access by each farmer depends on a set of explanatory variables linked to the individual farm operation, demographic measures, and geographic factors unique to each farm region. The second model is estimated by a multi-logit procedure that
1 For example, while only 10 percent of the operators had attended or graduated from college (including graduate
estimates Internet use for: (1) farm purchases, such as equipment, inputs etc; (2) household purchases of goods and service; (3) or both farm and household purposes2.
Literature Review
Much of the literature in this area focuses on farmers’ use or adoption of computers. The studies in the literature are based on various survey data that are mostly localized3 (Iowa, New York, California, Ohio, and Great Plains) and somewhat different questions and arguments (Huffman and Mercier, 1991; Willimack, 1989; Lazarus and Smith, 1988; Putler and Zilberman, 1988; Batte et al.,1990; Ortmann, Particak, and Musser, 1994; Smith et al., 2004; Batte, 2005). In majority of the studies in the literature, choices are modeled in a qualitative form as a function of farm, operator, and financial characteristics (explanatory variables). Contrary to the trend,
Mishra and Park used count data analysis to study the number of Internet uses by farmers. In addition, many studies address net benefits (Batte et al.,1990; Amponsah, 1995; Hoag et al., 1999), types and number of applications (Putler and Zilberman, 1988; Batte et al.,1990).
Studies in the literature include farmer age, education level of the farm operator, and farm size as explanatory variables. Some studies have included farming experience as a replacement for farmer’s age (Hoag et al., 1999). It is argued that younger farmers are expected to have more familiarity with computers and a longer period to use the technology (Putler and Zilberman, 1988). Educated farmers are more likely to adopt a technology (in this case computers) since education represents greater capacity to learn and perhaps an indicator of prior experience with computers. Studies by Nelson and Phelps; Khaldi; and Wozniak (1989) use education as a measure of human capital to reflect the ability to adopt innovation (either technology or
2 The group with Internet access but no purchasing of farm input or household items is treated as the base group. 3 With the exception of Mishra and Park’s study. Their study uses national farm-level data from USDA.
insurance). Huffman’s (2001) review of human capital impacts on agriculture focuses on the effects of education on technology adoption. Batte et al. (1990) and Amponsah (1995) found that education had a positive effect on computer adoption and age had a negative impact on the number of applications and perceived benefits by farmers. Off-farm employment status of farmers is sometimes used as an explanatory variable as a proxy for experience with computers (Hoag et al., 1999; Huffman and Mercier, 1991; Mishra and Park, 2005). Mishra and Park argue that farmers with off-farm employment are more likely to have experience with computers and to seek information through the Internet.
In order to capture the scale of operation effect on computer adoption, studies have included farm size, as measured in acres or volume of sales (Mishra and Park, 2005), and farm income and expenditures (Amponsah, 1995; Hoag et al., 1999) as explanatory variables. Hoag et al., (1999) found positive impact of farm size (acres) on computer adoption. Further, their results also indicated that size had an inverted U-shaped impact, implying mid-sized farms were the most likely to adopt. Indicators such as number of farm enterprises or number of products produced and a diversification index were used in published studies to capture the impact of flexibility or more varied decision making processes on adoption of computers (Putler and Zilberman, 1988; Mishra and Park, 2005; Huffman and Mercier, 1991). Other indicators of management intensity include tenancy or farm ownership (Hoag et al., 1999; Batte, et al., 1990; Huffman and Mercier, 1991; Mishra and Park, 2005) and the existence of a formal record-keeping system (Amponsah, 1995; Batte et al., 1990).
The study by Mishra and Park is unique in several ways. First, their study uses large national farm-level data from the USDA. The dataset has several desirable properties, such as in addition to all the farm and operator characteristics, the data also has information on the spouses,
family size, financial characteristics, and work decisions of spouses. Second, using a count data method, is the first study of its kind, Mishra and Park studied how farm operators use the Internet rather than the adoption of computers. In particular their study investigates factors that affect the number of (different types of applications) applications that a farm operator performs using the Internet. Third, they use information on work habits of spouses on number of Internet
applications performed by the household. Finally, the authors included regional variables to capture the regional difference in number of Internet applications used by farmers in various regions of the United States.
This literature alludes to potential extensions of these analyses, which we pursue in this paper. The paper assumes that the decision making for farming, technology adoption, and other involves the household (operator and spouse), not just the farmer. First, our data is rich enough to capture the educational level of the farm operator and spouse. Second, we have information on the work decisions (farm and off-farm) of the farm operator and spouse. Third, the ARMS data collects information on the composition of the family, such as number of children in various age categories. Finally, we go a step further in analyzing Internet use by farm households.
Theoretical Framework
This section provides the theoretical framework related to technology adoption. First, the study investigates the factors that influence adoption on the farm/ranch of a computer with Internet access. This is accomplished via a straightforward logit model that is common in the adoption literature. The adoption of computers with Internet access is specified as:
Pi e Zi e X X nXn = + − = + − + + + + 1 1 1 1 (α β1 1 β2 2 ... β ) , (1)
where Pi is the probability that the farm has a computer with Internet access, and Zi is a weighted sum of a vector of farm and operator characteristics or factors (Xi) which are hypothesized to influence the adoption of a computer with Internet access decision.
Once it is established that a farm/ranch has a computers with Internet access then we are interested in finding out how such technology is used. Do the farm operators use this technology for the farm operation, such as purchase of farm inputs, equipment, and materials, or do they use it for purchase of household items. Further, the Internet could be used for both farm and
household activities. Finally, although the farm/ranch may have computers with Internet access but the households may choose not to use it for farm input purchases or purchasing household items (here possible use could be social, such as email, news, and other information search). In order to understand the range of possible uses of computers with Internet access one has to rely on a multi-logit model, which models responses based on two or more outcomes.
In the context of the general economic framework for analyzing technology adoption as was originally specified by McFadden (1981), consider a sample of N farm operators, each attempting to choose from among a set of M discrete technologies. Farmers are expected to choose or adopt the technology that has the largest discounted net returns, or utility4 (Rahm and Huffman, 1984; Huffman, 1985; Huffman and Mercier, 1991). Accordingly, let the following describe the expected utility (U) of the jth technology for the ith farm operator.
(
U k M k j)
Z i(
N)
Uij ≥max ik | =1,2,..., ; ≠ = i'βj +εij, = 1,2,.... (2) Where Zi is a (1x q) vector of the ith operator’s personal, farm, and enterprise attributes affecting the operator’s decision to choose technology j; βj is a vector of parameters associated with Zi; and εij is a stochastic component of the ith farmer’s objective function given the jth technology.
Since only the outcome of the farmer’s choice is observed and not Uij, the modeling of the farmer’s decision to choose from a set of M discrete technologies requires the creation of the following variables: ⎩ ⎨ ⎧ ≥ = ≠ = otherwise 0 ; ,...., 2 , 1 if 1 U U k M k j Iij ij ik (3)
Where Iij =1 if the ith farmer chooses the jth technology, and Iij =0 otherwise. The probability of the ith farmer selecting the jth technology is
(
)
(
)
(
Z Z k M k j)
ob j k M k U U ob I ob P k i j i ij ik ik ij ij ij ≠ = − ≤ − = ≠ = ≥ = = = , ,..., 2 , 1 ; Pr , ,..., 2 , 1 ; Pr 1 Pr ' 'β β ε ε (4)Under the assumption that the εij are independently and identically distributed, i.e.,
(
0, 2)
~ σ
εij N with a Weibull density function, McFadden (1974) has shown that the conditional probability for alternative j is:
(
)
(
)
(
)
;(
1,2,....)
, exp exp 1 Pr 1 ' ' M j Z Z I ob P M k i k j i ij ij= = = =∑
= β β (5)and the relative odds of choices are expressed using the following multinomial logit (MNL) model:
(
1,2,..., 1)
, ' = − = ⎟⎟ ⎠ ⎞ ⎜⎜ ⎝ ⎛ M j Z P P Log i jM iM ij β (6)Equation 6, which is estimated in this study using the maximum likelihood method, describes the logarithm of the odds in favor of choosing technology j relative to technology M. There are four distinguished uses of computer Internet access (M). In the first, I1, the Internet is used for farm 4 Incremental profit may be associated with risk management and effective decision making (Amponsah, 1995); reduce uncertainty (Feder and Slade, 1984), or improvements in human capital through allocative and productive
business activities (input purchase etc.); in the second, I2, the Internet is used to purchase
household items; I3, the Internet is used to purchase farm inputs and households items; and in the fourth, I4, the Internet is neither used for farm nor household purchases.
Computational issues
Since the primary data underlying the MNL regression model described above are from ARMS, which is a multiphase survey with its attending pre- and post-sampling complexity, any inference based on estimated parameters from classical statistical algorithms become suspect. This is because the estimation of the variances of these parameters becomes more complex when the structure of the sampling process is stratefied compared to when the variances of these estimates are based on simple random samples. To attend to this complexity, the regression model in (14) is estimated by means of maximum likelihood procedureswith corresponding standard errors being estimated based on the jackknife variance method (see Kott; Dubman). Under the delete-a-group jackknife approach, which is a method similar to bootstrapping, the original sample of surveyed farms representing all farms in the 48 contiguous states is divided by NASS into 15 nearly equal and mutually exclusive different subgroups. A re-sampling method with
replacement is then conducted by NASS which results in a set of 15 vectors of replicate weights. These vectors of replicate weights, in addition to the vector depicting the survey’s full sample weights (W) are then used in 16 MNL regressions. The first regression is based on W which yields the full sample estimateϑˆ, and the remaining 15 regressions are based on the 15 vectors of ‘replicate’ weights which, in turn, result in 15 vectors ofϑˆq(q=1,K ,15). The final
step involves the derivation of the jackknife variance-covariance matrix of regression coefficients as in the following:
), 'ˆ ˆ ( ) ˆ ( cov
ϑ&2(k+1)(k+1) =S ϑ&(k+1)(q)ϑ&(q)(k+1) (7) where S is a scalar representing the adjustment to the degrees of freedom for the jackknife procedure (here, S = 14/15), andϑ&ˆis a (k+1, q) matrix whose elements are the resultants of the difference of the kth parameter estimate based on the qth ‘replicate’ weight and the
corresponding kth parameter estimate based on the ‘full-sample’ weight. The square roots of the elements of cov ( . ) along the diagonal provide the appropriate standard errors to use in
hypotheses testing when data has the type of complex survey design structure as in ARMS.
Results
(A) Results for adoption of computers with Internet access
The effect of various farm, operator, regional location, and household characteristics on computer Intern access is reported in table 2.The log-likelihood ratio χ2 statistics [-2 log L],
which tests the joint significance for the independent variables included in the model, is significant at the 1 percent level of significance.Further,McFadden pseudo-R2 ,
ln ln 1 0⎥⎦ ⎤ ⎢ ⎣ ⎡ − = L LA
where ln LA is the value of the log-likelihood function when all the regressors are included in the estimation and ln L0 is the value of the log-likelihood function when regression is performed on the intercept only. This R2 will take the value 0 (indicating poor fit) if the model predicted occurrence of the event no better than a simple flip of a coin, and will equal to 1 if the model
predicts the event perfectly (see Amemiya, p. 1505; Maddala, p. 39)5. Table 2 shows that pseudo-R2 is 0.31 for the estimated model, indicating a good fit.
The coefficients of the farm operator’s age (OP_AGE) and education (OP_EDUC) have the expected signs and are statistically significant at 5 percent and 1 percent, respectively. Results indicate that young farm operators are more likely to adopt a computer with Internet access. These findings are consistent with Putler and Zilberman, who studied computer adoption on farms in California in the mid 1980s. This may be because younger farmers are expected to have more familiarity with computers and a longer period to use the technology. Further, older farm operators are likely to be less educated and may have a relatively short time horizon for their farming business. This effect is confirmed with a negative and statistically significant coefficient of the operator’s age squared term (OP_AGESQ) in the model (Table 2). The results show a classical inverted U-shaped curve. The estimated coefficient for OP_EDUC is positive and significant at the 5 percent level of significance. Increased education is expected to improve understanding of the complexities of production and financial relationships and therefore
increase demand for information. This is consistent with the arguments suggested by Welch; Nelson and Phelps; Rahm and Huffman. Additionally, increased education corresponds to an increased awareness of the capabilities to judge the usefulness to the business of computers and information gathered through them. These findings are consistent with Willimack; Putler and Zilberman; Lazarus and Smith; Batte (2004, 2005), who studied computer adoption using small survey data (usually farm level data in a specified county) .
The coefficient of the farm operator’s occupation (OP_OCUP) is positive and statistically significant at the 10 percent level. Results indicate that farm operators reporting farming as their
occupation are more likely to adopt computers with Internet access than their counterparts. A possible explanation is that operators of large farms generally indicate farming as their occupation and large farms are likely to adopt technology for productivity and efficiency
reasons. Further, Mishra and Park indicate that large farms are in constant search of information regarding marketing and production activities of the farm. Operators of large farms are also seeking information regarding new technology, extension related information, and
communication with other farmers in their region or across the country. The presence of a spouse (SPOUSE) increases the likelihood of adoption of computers with Internet access. As seen in most cases spouses tend to work off the farm and have more experience with computers and the usefulness of the Internet through their job, friends, and co-workers. Further, in many cases spouses use the Internet to seek information regarding consumer products, buying products on the Internet, and using the Internet for social interactions with friends and relatives.
The coefficient for farm size, measured by the value of agricultural commodities sold by the farm (FARM_SIZE), is positive and significant at the 5 percent level of significance. Results suggest a positive and significant relationship between farm size and adoption of computers with Internet access. One argument is that large farms face more complex decisions and are constantly searching for information to make their operations productive and efficient and reduce their production and financial risk. Also, large farms, that produce a majority of the products, are on the cutting edge of adopting new ways to produce and market, and to increase farm profitability. Our results are consistent with the findings of Ortmann, Partick, and Musser; Putler and
Zilberman; Batte (2004, 2005); and Hoag et al. Further, Mishra and Park found a positive and significant correlation between farm size and number of Internet uses by farm operators.
Literature points out that farm ownership (tenancy) has an impact on computer adoption (Batte, Jones, Schnitkey; Baker; Putler and Zilberman). Results from this study indicate that full owners (FULL_OWNER) are less likely to adopt computers with Internet access, whereas part-owners are likely to adopt computers with Internet access when compared to tenants (benchmark group). One possible explanation is that full owners are more likely to be older farmers who have greater wealth (Mishra et al.) and may be in the later stages of the farming life-cycle (winding down) where the costs outweigh the benefits of having computers with Internet access. On the other hand, part-owners, may be younger farmers, who are in the expanding phase of their farming life-cycle or beginning farmers, and can capture the benefits of computer technology for an extended period. They can use the Internet to gather information regarding farming and deal with the complexity related to expanding enterprises and farming as a whole. The Internet can easily provide farm operators with information on prices of outputs and inputs, discounted prices for inputs, information regarding production agriculture, and new technology. Our results are consistent with the findings of Amponsah; Putler and Zilberman; Jones, Schnitkey, and Baker.
Owning a farm-related business or nonfarm business increases the likelihood of adopting computers with Internet access. The coefficient of off-farm business income (OFF_BUSINC), a proxy for nonfarm business/farm related business ownership, is positive and statistically
significant at the 1 percent level of significance. Results suggest that farm operators who receive income from off-farm businesses are more likely to adopt computers with Internet access. Perhaps this could be due to exposure to computers in a different environment where they are more commonly used. Another explanation is that in the information age many businesses have information on the Internet, either displaying their products, information about the business, or using the Internet to do transactions. Farm operators who have prior knowledge of the
advantages of Internet use are also more likely to use the Internet on their farms and in their households. Putler and Zilberman in their study of farms in Tulare County, California, found a positive and significant correlation between non-farming business income and probability of computer adoption.
Finally, regional dummies were included in the regression to assess the regional impact of farm operator adoption of computers with Internet access. The Mississippi Portal Region was used as the benchmark, therefore any significance of coefficients on regional dummies is relative to this benchmark region. The coefficients for the Heartland region (REG_HEART), Northern Crescent (REG_NORTHC), Northern Great Plains (REG_NORTHGP), Prairie Gateway (REG_PGATE) are positive and statistically significant at the 5 percent or lower level of significance. Results indicate that farms located in the above regions are more likely to adopt computers with Internet access compared to farms in the benchmark region (Mississippi Portal). Farm in these regions are large and tend to grow cash grains, cattle, and some dairy. It is likely that the regional variables represent the effects of omitted variables that are correlated with regional location (e.g., the intensity of advertising by Internet providers, transactions costs) of farm households.
(B) Results for Uses on Internet
After determining who has computers with Internet access, respondents were asked if the Internet was used for purchasing: (1) farm inputs and equipment; or (2) household items. Based upon this information four groups were created. First, the base group, included all farms that had an Internet connection but did not use it either for purchase of farm input or equipment or
household items. Second, includes farms which used the Internet only to purchase farm inputs or equipment. Third, includes farms that used the Internet only to purchase household items and
fourth, includes farms that used the Internet to purchase both farm equipment and inputs and household items. Results of the estimated model are presented in table 3. The goodness-of-fit measures indicate that the estimated model fits the data reasonably well. The log-likelihood ratio χ2 statistics [-2 log L], which test the joint significance for the independent variables included in
the model, are significant at the 1 percent level of significance. Further, Table 3 shows that pseudo-R2 is 0.27 for the estimated model, indicating a good fit.
In the case where computers with Internet access are only used for farm input and equipment purchases, the educational level of farm operator and spouse play a positive role. For example, households where spouses have completed high school and/or attended college are more likely to use the Internet for farm input and equipment purchases compared to farms that have access to Internet but do not use it for any purchases. Results also confirm that younger farmers are more likely to use the Internet for farm purchases, however, it starts decreasing as farmers get older, as evident from a negative and statistically significant coefficient on the age-squared term (table 3). This is consistent with the fact that younger farm operators are more likely to be in the expanding phase of their business operation and want to be on the cutting edge to reduce costs and increase profits, thereby increasing household income. Purchasing through the Internet may reduce transactions cost, production costs (through discounts), and save time. Farm operators may also search for potential markets for their products and extension
information that may be used on their farms.
The coefficient of farm size in positive and significant, reaffirming that large farms are more likely to use the Internet for farm input and equipment purchases. Farm households
receiving income from off-farm businesses are more likely to use computers with Internet access for farm input and equipment purchases compared to farms with Internet access but no
purchases. This may be due to exposure to computers and the Internet through their off-farm businesses. Finally, the coefficients of the Heartland and Northern Great Plains regions are positive and statistically significant at the 10 percent level of significance. Results suggest that farms located in the Heartland and Northern Great Plains are more likely to use computers with Internet access for farm input and equipment purchases compared to farms located in the Mississippi Portal region (benchmark group). These results are not surprising, since the Heartland and Northern Great Plains are major agricultural regions of the U.S.
In the case where computers with Internet access are only used for purchase of household items6, results show that education of the farm operator and spouse are more likely to influence the use of the Internet. In addition, results also show that spouses who have completed college or done graduate studies are more likely to use the Internet for the purchase of household items. These spouses tend to be young. The coefficient of the 35-44 spouse age group is positive and statistically significant at the 5 percent level of significance. A possible reason is that spouses with higher education are more likely to be young and hold permanent (wage and salaried) jobs in the off-farm market (Mishra et al.) that perhaps provide a training ground, in terms of
searching for information, communication with email, and ordering goods and services online, which saves time for the spouse and enables them to multitask and work more efficiently. The use of computers for purchase of household items also increases if the household has teenagers. This is because younger people are more interested in technology and may be more likely to take full advantage of the possibilities that the Internet provides (such as browsing for information for school, buying goods over the Internet, communication with other friends and members of the family). Consumer goods and services may be purchased at a lower price and household
members may have access to a wider array of goods and services, some to which may not be available from local merchants and service providers. Finally, farms located in the eastern
Upland region are less likely to use the Internet for purchase of household items. However, farms located in the Fruitful Rim region are more likely to use the Internet for purchase of household items.
Finally, the case where a computer with Internet access are used to purchase both farm inputs/equipment and household items, these results are very similar to the other two categories. For example, the educational level of both spouses and farm operators affect Internet use for farm and household purposes. The coefficients of all the educational variables are positive and significant. These results are consistent with findings in the literature. Rogers found that early adopters have more education. Results also indicate that younger farm operators are more likely to use computers with Internet access for both farm and household use. However, older farm operators are less likely to use the Internet. This is confirmed with a negative and statistically significant coefficient on the operator age squared term. Farm households with children between the ages of 14-17 are more likely to use the Internet for both farm and household purchases.
The coefficient of farm size is positive and statistically significant at the 5 percent level of significance. A possible explanation is that large farms face more complex decisions so the value of information required is greater. Also, large farms that produce a majority of the products are on the cutting edge of adopting new ways in production and marketing to increase farm profitability. Again as in the case of farm use only, off-farm business income increases the likelihood of Internet use for both farm and household purchases. Finally, farms located in Northern Crescent, Basin and Range, and Fruitful Rim regions are more likely to use the Internet
for both farm and household purchases. It is likely that the regional variables are correlated with variable like number of Internet Providers and transactions costs in the region. Further, the regions identified above tend to grow high-valued products such as fruits, vegetables, nursery, and cotton, and are mostly diversified farms, which could be indicators of management intensity and hence increased likelihood of Internet use.
Summary and Conclusions
In the past eight decades several new technologies have emerged and benefited the farm sector and farm households in the U.S. The Internet is yet another, but slightly different technology that is making an imprint on farm businesses and farm households. The Internet permits persons to engage in a wide range of activities to satisfy the needs of farm businesses and households. Internet has the ability to deliver large quantities of information and provide new opportunities for networking to enable farm operations and households to gain access to a world far beyond their rural communities. According to ARMS only 56 percent of farms have computers with Internet access; however, the potential of the Internet has not been fully realized in farm
businesses and farm households. The objective of this study is twofold. First, this study examines the key farm, operator, regional, and household characteristics that influence the adoption of computers with Internet access by farm households. Second, this study investigates the pattern of Internet use by farm operators. In particular, the study investigates factors that affect Internet use for purchases related to: (1) farm inputs and equipment; (2) household items; and (3) both farm and household items.
source of news and entertainment.
The effects of age, formal education, presence of a spouse, farm size, and regional location of the farm have a significant impact on adoption of computers with Internet access. Further,
increasing familiarity with computers and Internet use from off-farm work or off-farm business activity has an important impact on adoption of computers with Internet access. Similar factors are also related to the pattern of Internet use by farm households. In particular, the study finds that age of the farm operator, educational level of farm operator and spouse, and farm size play a positive role in farm Internet use. Further, if the household receives income from an off-farm business the likelihood of Internet use for the farm increases. Secondly, education of the farm operator and spouses, younger spouse, and households with teenage children are more likely to influence the Internet use for purchase of household items. Finally, farm operator and spouse characteristics, such as age and education, along with presence of children and off-farm business income, increases the likelihood of Internet use for purchase of both farm and household items. Further, regional location of the farm cannot be discounted in the pattern of Internet use.
References
Amemiya, T. “Qualitative Response Models: A Survey.” Journal of Economic Literature. XIX (1981):1483-1536.
Amponsah, W.A. “Computer Adoption and Use of Information Services by North Carolina Commercial Farmers.” J. of Agricultural and Applied Economics, 27, 2(Dec. 1995):565-576.
Baker, G. “Computer Adoption and Use by New Mexico Nonfarm Agribusinesses,” American Journal of Agricultural Economics, 74, Nov.(1992): 737-744.
Batte, Marvin T. Eugene Jones, and Gary D. Schnitkey. “Computer Use by Ohio Commercial Farmers.” American Journal of Agricultural Economics, Vol. 72(1990):935-45. Batte, Marvin T. Gary D. Schnitkey, M. Edward Rister, and Gary Frank. “Farm Information
Systems Design and Use”. Chapter 2 in Adoption and Use of Information Systems. North Central Regional Research Publication 339, OARDC Special Circular 149, Nov. 1995. Batte, Marvin T. “Computer Adoption and Use by Ohio Farmers”. Journal of the American
Society of Farm Managers and Rural Appraisers, 2004:108-11.
Batte, Marvin T. “Changing Computer Use in Agrculture: Evidence from Ohio.” Computers and Electronics in Agriculture, 47 (2005): 1-13.
Cohen, S., J. Bradford DeLong, S. Weber, and J. Zysman. “Tools: The Drivers of
E-Commerce.” In BRIE/IGCC E-Conomy (Ed.) Tracking a Transformation: E-Commerce and the Terms of Competition in Industries, Washington DC: Brookings Institution, 2001: 3-26.
Dubman, R.W. “Variance Estimation with USDA’s Farm Costs and Returns Surveys and Agricultural Resource Management Study Survey” AGES 00-01(2000) Economic Research Service, U.S. Department on Agriculture, Washington D.C.
Feder, G., and Roger Slade. “The Acquisition of Information and the Adoption of New
Technology,” American Journal of Agricultural Economics, 66, May (1984): 312-320. Hoag, D.L., J.C. Ascough, II, and W. Frasier. “Farm Computer Adoption in the Great Plains,” J.
of Agricultural and Applied Economics, 31, 1(April 1999):57-67.
Huffman, W.E. “Human Capital, Adaptive Ability, and the Distributional Implications of Agricultural Policy.” American Journal of Agricultural Economics, 67, May(1985): 429-434.
Huffman, W.E. “Human Capital: Education and Agriculture.” in Handbook of Agricultural Economics, Vol. 1A, B.L. Gardner and G.C. Rausser (eds). New York: Elsevier, 2001. Huffman, W.E. and S. Mercier. “Joint Adoption of Microcomputer Technologies: An Analysis
of Farmers’ Decisions.” Review of Economics and Statistics, 73(1991):541-546. Khaldi, N. “Education and Allocative Efficiency in U.S. Agriculture.” American Journal of
Agricultural Economics, 57, Nov. 1975: 650-57.
Kinsey, J. “Electronic Systems in the Food Industry: Entroy, Speed, and sales.” In BRIE/IGCC E-Conomy (Ed.) Tracking a Transformation: E-Commerce and the Terms of Competition in Industries, Washington DC: Brookings Institution, 2001: 280-311.
Lazarus, W. F. and T. R. Smith. “Adoption of Computers and Consultant Services by New York Dairy Farmers.” Journal of Dairy Science 70(1988): 1667-75.
Lazarus, W. F., D. Streeter, and E. Jofre-Girauda. “Impact of Management Information Systems on Dairy Farm Profitabiltiy.” Paper presented at the AAEA annual meetings, LSU, Baton Rouge, Aug. 1989.
Maddala, G.S. Limited-Dependent and Qualitative Variables in Econometrics. Cambridge: Cambridge University Press. 1983.
Mishra, Ashok K. and Janet E. Perry. “Forward Contracting of Inputs: A Farm Level Analysis,” Journal of Agribusiness, Vol. 17(2), Fall 1999: 77-92.
Mishra, Ashok K., and T. Park. “An Empirical Analysis of Internet Use by U.S. Farmers.” Agricultural and Resource Economics Review Vol. 34(2), Oct. 2005: 253-264.
Mishra, Ashok K., M.J. Morehart, Hisham S. El-Osta, James D. Johnson, and Jeffery W. Hopkins. “Income, Wealth, and Well-Being of Farm Operator Households.” Agricultural Economics Report # 812, Economic Research Service, U.S. Department of Agriculture, Washington, D.C. Sept. 2002.
National Agricultural Statistics Service (NASS). “Farm Computer Usage and Ownership”, Agricultural Statistics Board, U.S. Department of Agriculture. Washington D.C. (http://usda.manlib.cornell.edu/reports/nass/other/computer).
Nelson, R.R. and E.S. Phelps. “Investment in Humans, Technological Diffusion, and Economic Growth.” American Economic Review, 56 (March) 1966:69-82.
Ortmann, G., G. Patrick, and W. Musser. “Use and Rating of Computers by Large-Scale U.S. Cornbelt Farmers.” Computers and Electronics in Agriculture, 10 (1994): 31-43. Putler, D. S. and D. Zilberman. “Computer Use in Agriculture: Evidence from Tulare County,
California.” American Journal of Agricultural Economics 70(1988):790-802.
Rahm, M. R. and W. Huffman. “The Adoption of Reduced Tillage: The Role of Human Capital and Other Variables.” American Journal of Agricultural Economics 66(1984):405-13. Rogers, E. Diffusion of Innovations. McMillan Publishing Company, New York, 1983.
U.S. Department of Agriculture, National Agricultural Statistics Service Agricultural Economics and Land Ownership Survey, 1999. Vol. 3, Special Studies. Washington DC. Aug. 2001. Welch, Finis. “Education in Production.” Journal of Political Economy, 78(1970): 35-39.
Wozniak, G. D. “The Adoption of interrelated innovations: A Human Capital Approach.” Review of Economics and Statistics, 66(Feb. 1989): 70-79.
Wellman, B., J. Salaff, D. Dimitrova, L. Garton, M. Gulia, and C. Haythornthwaite. “Computer Networking as Social Netwroks: Collaborative Work, Telework, and Virtual
Communitty.” Annual Review of Sociology, 22 (1996): 213-238.
Willimack, D. K. “The Financial Record Keeping Practices of U.S. Farm Operators and their Relationship to Selected Operator Characteristics.” Paper presented at the AAEA annual meetings, LSU, Baton Rouge, Aug. 1989.
Figure 1: Use of Computers with Internet Access
18%
44% 38%
Farm input and equipment purchases only Household item purchases only Farm & household item purchases
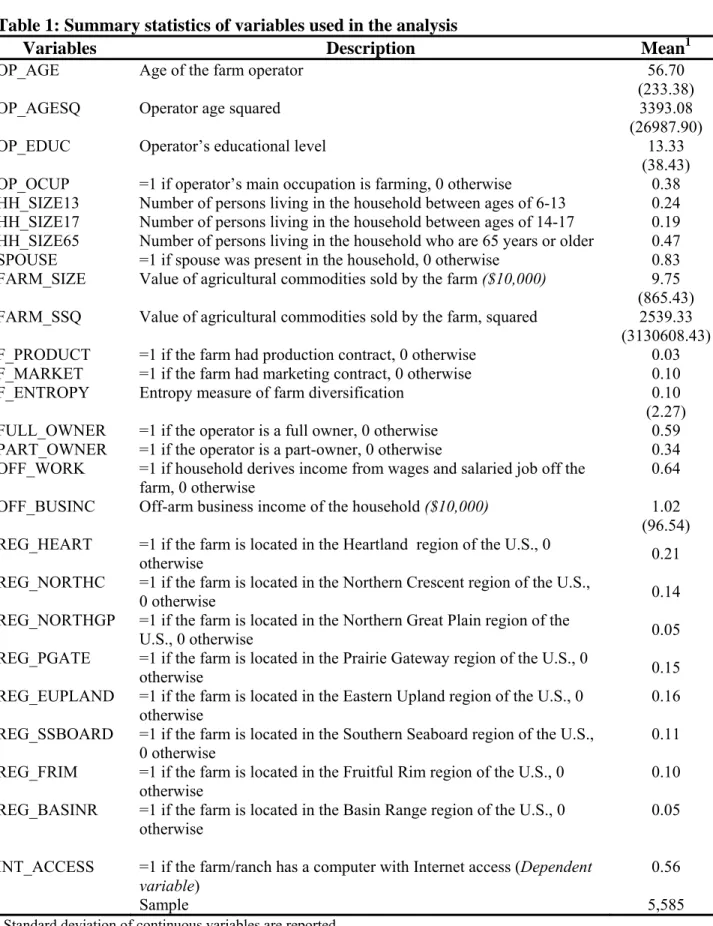
Table 1: Summary statistics of variables used in the analysis
Variables Description Mean1
OP_AGE Age of the farm operator 56.70
(233.38)
OP_AGESQ Operator age squared 3393.08
(26987.90)
OP_EDUC Operator’s educational level 13.33
(38.43) OP_OCUP =1 if operator’s main occupation is farming, 0 otherwise 0.38 HH_SIZE13 Number of persons living in the household between ages of 6-13 0.24 HH_SIZE17 Number of persons living in the household between ages of 14-17 0.19 HH_SIZE65 Number of persons living in the household who are 65 years or older 0.47 SPOUSE =1 if spouse was present in the household, 0 otherwise 0.83
FARM_SIZE Value of agricultural commodities sold by the farm ($10,000) 9.75 (865.43)
FARM_SSQ Value of agricultural commodities sold by the farm, squared 2539.33 (3130608.43) F_PRODUCT =1 if the farm had production contract, 0 otherwise 0.03 F_MARKET =1 if the farm had marketing contract, 0 otherwise 0.10 F_ENTROPY Entropy measure of farm diversification 0.10 (2.27) FULL_OWNER =1 if the operator is a full owner, 0 otherwise 0.59 PART_OWNER =1 if the operator is a part-owner, 0 otherwise 0.34 OFF_WORK =1 if household derives income from wages and salaried job off the
farm, 0 otherwise
0.64
OFF_BUSINC Off-arm business income of the household ($10,000) 1.02 (96.54)
REG_HEART =1 if the farm is located in the Heartland region of the U.S., 0
otherwise 0.21
REG_NORTHC =1 if the farm is located in the Northern Crescent region of the U.S.,
0 otherwise 0.14
REG_NORTHGP =1 if the farm is located in the Northern Great Plain region of the
U.S., 0 otherwise 0.05
REG_PGATE =1 if the farm is located in the Prairie Gateway region of the U.S., 0
otherwise 0.15
REG_EUPLAND =1 if the farm is located in the Eastern Upland region of the U.S., 0 otherwise
0.16 REG_SSBOARD =1 if the farm is located in the Southern Seaboard region of the U.S.,
0 otherwise 0.11
REG_FRIM =1 if the farm is located in the Fruitful Rim region of the U.S., 0 otherwise
0.10 REG_BASINR =1 if the farm is located in the Basin Range region of the U.S., 0
otherwise
0.05 INT_ACCESS =1 if the farm/ranch has a computer with Internet access (Dependent
variable)
0.56
Sample 5,585
1 Standard deviation of continuous variables are reported.
Table 2: Effect of farm, operator, and regional characteristics on computers with Internet access, 2004
Variables Parameter estimates
Intercept 5.6723*** (1.2190) OP_AGE 0.0512** (0.0182) OP_AGESQ -0.0007*** (0.0002) OP_EDUC 0.3196*** (0.0429) OP_OCUP 0.3583* (0.2001) HH_SIZE13 -0.0447 (0.1262) HH_SIZE17 0.1704 (0.2309) HH_SIZE65 -0.1415 (0.2222) SPOUSE 0.7569*** (0.2345) FARM_SIZE 0.0410** (0.0052) FARM_SSQ -1.3966E-6 (2.6725E-6) F_PRODUCT -0.4398 (0.4291) F_MARKET 0.2672 (0.2377) F_ENTROPY -0.5850 (1.4492) FULL_OWNER -0.6580** (0.2368) PART_OWNER 0.7073** (0.2714) OFF_WORK 0.4411 (0.3306) OFF_BUSINC 0.0305*** (0.0116) REG_HEART 0.9041** (0.3404) REG_NORTHC 0.6721*** (0.1798) REG_NORTHGP 1.1041** (0.4103)
REG_PGATE 0.5997** (0.2367) REG_EUPLAND 0.2288 (0.3267) REG_SSBOARD 0.4685 (0.3454) REG_FRIM 0.9963 (1.5901) REG_BASINR 0.9668 (4.3225) Log-Likelihood Correlation between observed and predicted McFadden pseudo R2
183,493*** 0.81 0.31
Numbers in parentheses are standard errors. Single, double, and triple asterisks show statistical significance at 10%, 5%, 1% levels, respectively.
Table 3: MNL estimates of computer with Internet Access by specific use, 2004†
Variable Farm Use Only Household Use
only
Both Farm and Household Use Intercept -3.7160*** (1.1680) -10.0809*** (4.5002) -9.0288*** (1.3167) Age of farm operator 0.0988*
(0.0496)
0.1545 (0.1624)
0.059* (0.0299) Age of farm operator, squared -0.0005**
(0.0002)
-0.0016* (0.0008)
-0.0008** (0.0003) Education of farm operator 0.1709*
(0.0957)
0.1901* (0.1024)
0.343** (0.1707) Farming as main occupation of the farm
operator 0.0213 (0.3333) 0.5208 (0.3165) -0.2098 (0.5139) Number of persons living in the household
between ages of 6-13 0.0130 (0.0935) 0.1899 (0.1961) 0.0255 (0.1597) Number of persons living in the household
between ages of 14-17 0.3609 (0.4333) 0.3061** (0.1416) 0.287*** (0.1010) Number of persons living in the household
who are 65 years or older
0.0345 (0.2062) 0.1009 (0.2491) -0.033 (0.2928) Spouse completed high school 0.6893**
(0.3025)
1.6617* (0.9330)
1.1437** (0.5626) Spouse attended college 0.7841*
(0.4383)
2.0622 (0.9937)
1.8775*** (0.5789) Spouse completed college or graduate school 0.7366
(0.7481)
1.9487** (1.0694)
1.6489** (0.6490) Spouse age less than 35 years 0.0642
(0.4816)
1.1954 (1.3976)
0.478 (0.7076) Spouse age 35-44 year 0.2181
(0.2641)
0.5686** (0.2823)
0.0081** (0.0040) Spouse age 45-54 years -0.7131
(0.8738)
-0.5289 (1.1286)
-0.0227 (0.5819) Spouse age 55-64 years 0.1662
(0.6632)
-0.4695 (1.0341)
-0.0445 (0.4694) Value of agricultural commodities sold by
the farm ($10,000) 0.0050* (0.0028) 0.0019 (0.0027) 0.0021** (0.0009) Value of agricultural commodities sold by
the farm ($10,000) squared
-3.04E-06 (6.14E-06) -3.33E-07 (2.6E-06) -4.13E-07 (4.02E-06) Farm has production contract -0.2213
(0.0004)
0.0103 (1.5606)
0.2432 (0.4554) Farm has marketing contract 0.0987
(0.2223)
-0.4893 (0.9669)
0.3533 (0.3900) Wage and salaries received by operator from
off-farm work 6.54E-07 (2.54E-06) 9.26E-07 (2.72E-06) 1.43E-06 (2.52E-06) Wage and salaries received by spouse from
off-farm work 3.41E-06 (5E-06) 3.08E-06 (2.59E-06) 1.99E-06 (8.9E-06) Off-farm business income of the household
($10,000) 0.0232** (0.0119) 0.0054 (0.0397) 0.0026** (0.0012) Farm is located in the Heartland region 0.5222*
(0.2924)
-0.4178 (0.8209)
0.9692 (1.1840)
Farm is located in the Northern Crescent region 0.2228 (0.3272) -0.5056 (0.3587) 0.5823* (0.29229) Farm is located in the Northern Great Plains
region (0.4522) 0.8253* (1.2685) -1.3301 (1.0368) 0.8480 Farm is located in the Prairie Gateway region 0.2458
(0.3595)
-1.2532 (1.1497)
0.1434 (0.6048) Farm is located in the Eastern Upland region 0.0669
(0.3320)
-1.1977** (0.5985)
-0.1781 (0.8546) Farm is located in the Southern Seaboard
region 0.2131 (0.3610) -0.3795 (0.9559) -0.0805 (0.7344) Farm is located in the Fruitful rim region 0.2254
(1.8061)
0.0839** (0.0418)
0.6699* (0..3381) Farm is located in the Basin Range region 0.6509
(3.4113)
-0.1025 (4.1000)
0.5587* (0.2820) Log likelihood function
McFadden’s pseudo R2 458,952*** 0.27
†Estimated coefficients here are
jm
β (see equation 6) and denote the odds of the jth versus Mth
technology category (i.e., category where farm/ranch has computer with Internet access but do not use it for farm or household item purchases).
Numbers in parentheses are standard errors. Single, double, and triple asterisks show statistical significance at 10%, 5%, 1% levels, respectively.