econ
stor
www.econstor.eu
Der Open-Access-Publikationsserver der ZBW – Leibniz-Informationszentrum WirtschaftThe Open Access Publication Server of the ZBW – Leibniz Information Centre for Economics
Nutzungsbedingungen:
Die ZBW räumt Ihnen als Nutzerin/Nutzer das unentgeltliche, räumlich unbeschränkte und zeitlich auf die Dauer des Schutzrechts beschränkte einfache Recht ein, das ausgewählte Werk im Rahmen der unter
→ http://www.econstor.eu/dspace/Nutzungsbedingungen nachzulesenden vollständigen Nutzungsbedingungen zu vervielfältigen, mit denen die Nutzerin/der Nutzer sich durch die erste Nutzung einverstanden erklärt.
Terms of use:
The ZBW grants you, the user, the non-exclusive right to use the selected work free of charge, territorially unrestricted and within the time limit of the term of the property rights according to the terms specified at
→ http://www.econstor.eu/dspace/Nutzungsbedingungen By the first use of the selected work the user agrees and declares to comply with these terms of use.
zbw
Leibniz-Informationszentrum Wirtschaft Leibniz Information Centre for EconomicsManevska-Tasevska, Gordana; Hansson, Helena
Conference Paper
Influence of rural development policy targets on farm
efficiency: An efficiency study of labour intensive
grape growing family farms
IAMO Forum 2010, Halle (Saale), June 16 – 18, 2010: Institutions in Transition -Challenges for New Modes of Governance
Provided in cooperation with:
Leibniz Institute of Agricultural Development in Central and Eastern Europe (IAMO)
Suggested citation: Manevska-Tasevska, Gordana; Hansson, Helena (2010) : Influence of rural development policy targets on farm efficiency: An efficiency study of labour intensive grape growing family farms, IAMO Forum 2010, Halle (Saale), June 16 – 18, 2010: Institutions in Transition - Challenges for New Modes of Governance, http://hdl.handle.net/10419/52696
„Institutions in Transition –
Challenges for New Modes of Governance”
IAMO Forum 2010, 16-18 June 2010 | Halle (Saale), Germany
Influence of rural development policy targets on farm efficiency – An efficiency study of labour intensive grape growing family farms
Gordana Manevska-Tasevska* and Helena Hansson**
* [email protected] ** [email protected]
* & **Department of Economics, Swedish University of Agricultural Sciences. P.O. Box 7013, SE- 75007 Uppsala, Sweden
Copyright 2010 by [Gordana Manevska - Tasevska & Helena Hansson]. All rights
reserved. Readers may make verbatim copies of this document for non-commercial purposes by any means, provided that this copyright notice appears on all such copies.
Abstract
The aim of this study was to provide an empirical analysis of the performance of Macedonian grape-growing family farms assessed in terms of technical, allocative, and economic efficiency and to relate aspects targeted in the Rural Development Program (RDP) to the efficiency scores. The study was based on a two-step efficiency analysis, applying Data Envelopment Analysis (DEA), in the first step, and Tobit regression analysis in the second step. Data were collected between 2006 and 2008 through face-to-face interviews with 300 grape growers in the Tikvesh vineyard district in
Macedonia, each represented by the three-year average of inputs, outputs and prices. The results indicated a large potential for efficiency improvement. The average efficiency was 0.71 for technical efficiency, 0.79 for allocative efficiency and 0.56 for economic efficiency. More efficient farms used smaller areas, irrigated a smaller proportion of total area, used less hired labour, used and paid less for inputs, but produced a larger quantity, with higher value per hectare. RDP measures targeted at stable yield, yield quality, and modernisation of equipment were important for
enhancing and improving farm efficiency and consequently, the competitiveness of the entire sector.
Keywords:Data Envelopment Analysis, rural development program, Tobit
1.INTRODUCTION
Strong economic performance followed by sustainable use of resources is one of the guiding principles for reforms in the EU Common Agricultural Policy (CAP) (Europen Commission 2006). Strengthening farm performance through policy interventions is associated with measures targeted at farm growth, implying expansion of physical size, modernisation in the input structure, and economic growth. Such structural reforms are important goals of many Rural Development Programs (RDPs) throughout Europe. To optimise governmental and EU spending on RDP, the measures should be targeted towards areas where they can provide the greatest benefits. The EU commission has developed a set of rural development priorities referring to the EU-level objectives for spending, but the priorities are further translated into national strategies and programs for rural development, allowing each country to decide the national critical areas (Europen Commission 2006).
However, the shift towards large scale production, equipped with modern technology does not necessarily imply efficient production, if the firm size and technology are not adjusted to the optimal levels for the production in question. Instead, the priorities of the RDP should rely on the type of agricultural production in focus. For example, the RDP measures targeting agricultural productions based on specific and advanced technology differ from those targeted at labour intensive productions. Grape production depends on intensive labour, even though modern equipment and machinery are used in most production operations, as the labour force cannot be replaced for pruning and post-pruning activities, harvesting and post harvesting grape treatment etc. In addition, the importance of labour use in a certain production is stronger when the cost of labour is lower than the cost of machinery. Grape production in Macedonia is no exception. However, with a contribution of 17-20% in the
agricultural gross domestic product Macedonian grape production and wine industry are an important strategic, export-oriented industry in Macedonia.
RDP, which has been in force since 2007 includes measures for providing specific equipment and tools for grape production, with an expectation of enabling the farmers to perform most of the farm activity with the existing labour capacity. The part of the RDP formulated for Macedonian grape producing family farms during the period 2007-2013 supports investments targeted towards:
1) Stable yield assurance through recovery of older grape plantations with areas between 0.5 to 20 ha, building new irrigation systems and improving existing systems, anti-hail installation, installation of components for construction support; 2) Respective yield quality: purchase of phyto-sanitary planting material, replacement
of non-recommended varieties with recognised vine sorts;
3) Mechanisation modernisation by purchasing equipment for pruning, mulching, weed removal, fertiliser applicators, chemicals sprayers. Purchasing
capital-intensive mechanisation such as tractors, machinery for harvesting and fertilisation is not supported.
The programme can be considered as an opportunity for strengthening the sector’s capacity and encouraging farm growth.
Apart from the traditional winemaking economies in the Mediterranean Region, the wine industry has made great progress in many lesser-developed economies, which gain comparative advantage from the cheap labour force.
Establishing whether, and how, the priorities targeted in the RDP can improve
efficiency of this type of production is vital for understanding how policy interventions contribute to stronger economic performance and for formulating better policies. Efficiency studies (Bravo-Ureta & Evenson 1994; Sharma et al. 1999; Wilson et al. 2001; Alvarez & Arias 2004; Gorton & Davidova 2004; Latruffe et al. 2005; Hansson 2007; Carvahlo et al. 2008; Hansson 2008; Bojnec & Latruffe 2009; Olson & Vu 2009) are a common and comprehensive way of evaluating farm performance. Normally, efficiency studies are complemented with analyses of the farm and farmer characteristics hypothesised to influence farm performance. However, with the available data sources, efficiency studies are not used to determine critical areas for RDP spending. This study grouped farm performance measures and the RDP together, with the expectation efficiency studies could be used as a guide for the RDP.
Although policy conclusions can be drawn from most efficiency studies, none of the existing studies is associated with an extensive RDP evaluation.
The aim of the present study was twofold. First, the study aimed to provide an
empirical analysis, where performance of grape growing family farms was assessed for technical (TE), allocative (AE) and economic efficiency (EE). Second, the study aimed to relate farm performance to specific aspects targeted in the RDP measures and to assess the potential influence of these measures on farm efficiency. The study highlighted how efficiency studies can be used as RDP evaluation tools1.
In order to determine recommendations for the sector’s growth, while maintaining as high as possible production efficiency, farm efficiency was examined and the influence of farm characteristics on efficiency scores was analysed. The way the proposed RDP measures can lead to efficient production, the need and the key points for further RDP and structural development of Macedonian primary grape-growing production are discussed.
This study contributes to the literature in several ways. First, the potential impact of RDP measures on farm performance was evaluated. Second, grape growing production efficiency was analysed in technical, allocative, and economic terms. Third, the paper contributes to the literature from the Western-Balkan Region, which has been
scientifically isolated since the 1990s due to political and economical changes. The study could be an asset to policy makers as it evaluated whether and how common RDP measures could increase farm efficiency; therefore, serving as a basis for understanding how RDP measures impact rural economies. In addition, grape production efficiency analysis is not commonly assessed in the literature. Grape production has only been analysed by a few authors including: Conradie et al. (2006), Carvahlo et al. (2008) and Henriques et al. (2009). These studies adopt a stochastic approach, and only consider the TE parameter, therefore, important economic considerations are lacking. (Townsend et al. 1998) study of farm size and the
productivity relationship at grape producers is used for advocating rural development
1We acknowledge that issues related to rural development are wider and comprise more areas than
solely the efficiency of the targeted farms. However, as competitiveness is one important target of RDPs, efficiency studies can be used to shed light on one aspect of RDPs.
policies for land reform programmes in South Africa, but is only related to productivity.
2. METHOD
2.1. Efficiency analysis
A two-stage efficiency method was applied, with estimation of efficiency scores in the first step, and an assessment of hypothesised influencing variables in the second step. This approach has previously been used in a number of previous studies (e.g. Wilson et al. 2001; Haji 2007; Hansson 2008; Hansson & Ohlmer 2008; Bojnec & Latruffe 2009).
The input efficiency measures were based on the Farrell framework (1957) who considers efficiency in terms of technical (TE), allocative (AE), and economic efficiency (EE). To assess the efficiency scores, the non-parametric approach was adopted, applying the Data Envelopment Analysis (DEA) developed by Charnes, et al. (1978), and assuming variable returns to scale (Fare et al. 1983). The efficiency
measures were calculated with the Data Envelopment Analysis (Computer) Program (DEAP), version 2.1 (Coelli 1996).
DEA is a mathematical linear-programming approach that applies a frontier approach, where the frontier function represents a best-practice technology, against which the efficiency of the producers within the sample can be measured. The model allows individual and multiple efficiency analyses for more than one producer and large number of inputs and outputs with different measurement units. The statistical properties of DEA, defined by Simar and Wilson (2000; Simar & Wilson 2007), and the existence of the Stochastic Frontier (SF) as a parametrical frontier model, which has been widely applied in efficiency analysis, were considered, however, for
“simplicity” (Simar 1996), DEA as a deterministic (non-parametric) model was used. With the non-parametric assumption, DEA does not require formulation of the
functional form, but does not account for noise thus all deviationsfrom the frontier are considered as inefficient. Studies that apply DEA and SF report efficiency scores obtained with DEA and SF are similar, even though in some cases slightly higher efficiency scores are obtained with both the parametric approach (e.g. Latruffe et al. 2004) and the non-parametric approach (e.g. Bojnec & Latruffe 2007).
Production technology can be explained through an output or input perspective. With the Farrell framework, from the input-oriented perspective, TE measures the ability of a producer to produce a given output with the smallest input quantity. AE assesses the producers’ ability to use the inputs in optimal proportions, given their respective prices and the production technology. A combination of both measures provides a measure of overall efficiency, known as economic efficiency. Efficiency scores are presented as 0 – 1, with 1 corresponding to full efficiency.
The choice of economic scale depends on the production characteristic. In the case when all firms operate under optimal scale, Constant Returns to Scale (CRS) is
preferable. In all other cases when the production is influenced by external factors, the assumption of Variable Returns to Scale (VRS) is more applicable. Grape production belongs to the group where not all producers can be expected to operate under optimal
scale, and is very sensitive to external factors such as climatic and demographic influence, pests, diseases and managerial ability to complete all the necessary operations in a proper way and on time. Thus, a DEA model with an input-oriented perspective and assumption of VRS was applied. In the case when the production technology exhibits VRS, the scale efficiency, as an additional efficiency parameter needs to be explained. The scale efficiency determines how close an observed firm is to the most productive scale size (Charnes et al. 1994). The scale efficiency highlights if a firm operates under Decreasing Returns to Scale (DRS) or Increasing Returns to Scale (IRS). The scale efficiency is the ratio of TE under CRS and TE under VRS and as a parameter explains how close an observed firm is to the most productive scale size. The equations set for presenting cost minimising, VRS linear programming problem, and the scale efficiency are presented in Appendix 1.
2.2. Second-stage Tobit regression
As the efficiency scores are by construction censored at 1, the second-stage regression analysis was by Tobit regression. The Tobit model assesses the relationship between a non-negative dependent variable, yi, and a vector of independent variables, xi. The error
term, ui, is assumed to have normal distribution. The model can be represented as:
1 y 1 1 y * i * i * if if y y i i (1) n i u u x yi i i, i ~N(0, 2), 1,2... 0 * (2)
The two-stage approach outlined above has received criticism from Simar and Wilson (2007), in that the DEA scores can be biased in small samples and the explanatory variables are correlated to the inputs and outputs. To resolve this problem, Simar and Wilson (2007) proposed a bootstrap algorithm. Afonso and St. Aubyn (2006) and Larsén (2008) empirically compared the traditional two-stage approach and the
bootstrap algorithm, and conclude the methods do not differ with respect to the sign of the estimated coefficients and the conclusions about statistical significance. As the primary interest was in the signs of the explanatory variables and whether they were statistically significant, the two-stage approach was sufficient.
3.DATA
This study was based on a primary dataset, where farm-level data were collected through face-to-face interviews with 300 commercial family grape growing farmers from the Tikvesh vineyard district, in Macedonia for three production years, 2006 to 2008. The study and the survey were a part of a larger research project: “Efficiency analysis of the commercial grape growing family farms in the Tikvesh vineyard district – Efficiency coefficients and determinants mapping”, which aimed at providing an empirical analysis of the performance at analysed farms, and determining different aspects that influence the farm performance.
The sampling-procedure was classified as non-random; a mixture of purpose-based and quota-sampling methods (Biemer & Lyberg 2003). However, there is no reason to assume specific farms were chosen and any systematic implications on the data quality
were not expected. Official farm-level data registration in Macedonia is supported by several national projects, but database, such as the Farm Accounting Data Network does not exist. Such conditions implied the sampling to be based on an alternative procedure that approaches random sampling. Panel data set was constructed for three production years, 2006 to 2008, where one production year corresponded to one calendar year from 1st January to 31st December. The survey contained full set of data on the farmers and farms characteristics, including input use, prices, and production characteristics.
3.1. Variables
Sixteen variables were constructed and classified as either DEA variables or farm variables. All variables were presented as a three-year average, because of the
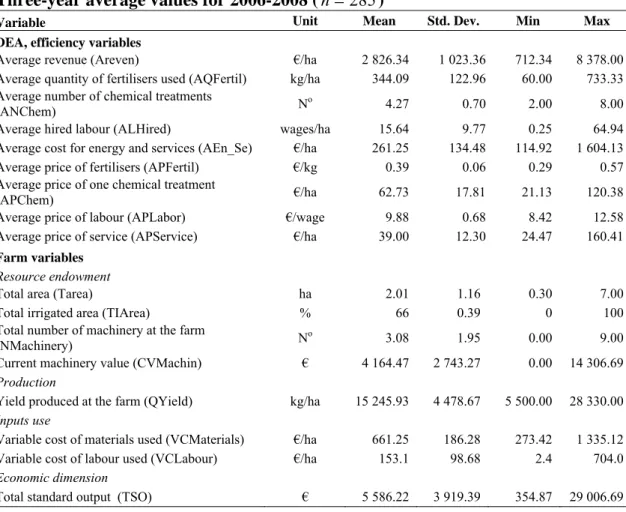
production characteristics and that DEA is sensitive to stochastic variation in the data. Some inputs do not appear in the inputs list every year, such as the application of fertilisers: in these cases, DEA considers the input value is zero. When a certain input was not applied in any of the observed production periods, the farm was considered as outlier and removed from the data set. After removal of outliers, 285 farms remained in the data set. The descriptive statistics of the variables, and the characteristics of each variable used in the study are presented in Table 1.
Table 1: Presentation and summary statistics of the DEA and the farm variables. Three-year average values for 2006-2008 (n285)
Variable Unit Mean Std. Dev. Min Max
DEA, efficiency variables
Average revenue (Areven) €/ha 2 826.34 1 023.36 712.34 8 378.00
Average quantity of fertilisers used (AQFertil) kg/ha 344.09 122.96 60.00 733.33
Average number of chemical treatments
(ANChem) No 4.27 0.70 2.00 8.00
Average hired labour (ALHired) wages/ha 15.64 9.77 0.25 64.94
Average cost for energy and services (AEn_Se) €/ha 261.25 134.48 114.92 1 604.13
Average price of fertilisers (APFertil) €/kg 0.39 0.06 0.29 0.57
Average price of one chemical treatment
(APChem) €/ha 62.73 17.81 21.13 120.38
Average price of labour (APLabor) €/wage 9.88 0.68 8.42 12.58
Average price of service (APService) €/ha 39.00 12.30 24.47 160.41
Farm variables
Resource endowment
Total area (Tarea) ha 2.01 1.16 0.30 7.00
Total irrigated area (TIArea) % 66 0.39 0 100
Total number of machinery at the farm
(NMachinery) No 3.08 1.95 0.00 9.00
Current machinery value (CVMachin) € 4 164.47 2 743.27 0.00 14 306.69
Production
Yield produced at the farm (QYield) kg/ha 15 245.93 4 478.67 5 500.00 28 330.00
Inputs use
Variable cost of materials used (VCMaterials) €/ha 661.25 186.28 273.42 1 335.12
Variable cost of labour used (VCLabour) €/ha 153.1 98.68 2.4 704.0
Economic dimension
3.1.1. DEA variables
The estimation of the DEA efficiency scores was based on one output variable, four inputs, and four input prices. These are further described below.
Output variable: Average revenue (AReven) represented the average revenue value a certain farm received for the total grape production during the period 2006 - 2008. The variable was originally calculated in the Macedonian currency unit (MKD denar), and then converted into Euro and normalised per hectare. Total output value, consisting of total farm revenue, is also used as an output variable by Latruffe et al. (2005),
Carvahlo et al. (2008) etc, but criticised by Puig-Junoy and Argiles (2004) as inappropriate for comparing extensive and intensive farms. Puig-Junoy and Argiles (2004) consider gross income as a more suitable output variable. Another alternative for output representation is the output in physical measures such as kilograms, tones etc. (Bravo-Ureta & Evenson 1994; Sharma et al. 1999; Coelli et al. 2002; Haji & Andersson 2006; Hansson & Ohlmer 2008). In this study, total output was represented by total revenue, as it was a convenient way of aggregating different outputs (grape sorts) into an aggregated measure.
Input variables: Average quantity of fertilisers used (AQFertil) was the average quantity of fertilisers applied on the field by a certain farm during the period considered: the variable was measured in kilograms and normalised per hectare. Average number of chemicals treatment (ANChem): measured on how many times the plantation was treated with chemicals: the variable was expressed in number of
treatments. Average hired labour (ALHired) was an average measure for the period 2006-2008, measuring the number of wages (paid working days) paid per hectare for hired labour, and for family labour working on another farm as compensation. Some farmers received help from non-family members from other neighbouring farms, and offered help on these farms when necessary: these days were calculated as paid. Average cost for energy and services (AEn_Se) was an aggregate measure of the energy and services paid on the farm. The variable was originally expressed in MKD denar, and then converted into Euro and normalised per hectare.
Input prices: Average price of fertilisers (APFertil) represented the average price paid by farmers for one kilogram fertiliser during the period analysed. The variable was originally expressed in MKD denar per kilogram, and then converted into Euro per kilogram of fertiliser. Average price of one chemical treatment (APChem) was variable is originally expressed in MKD denar, and then converted into Euro per treatment and normalised per hectare. Average price of labour (APLabor) was the average wage value (daily payment) paid during 2006-2008: the variable was originally expressed in MKD denar, then, converted into Euro. Average price of service (APService) represented the average price of services paid by the farmers and was originally measured in MKD denar, then, converted into Euro and normalised per hectare.
3.1.2. Farm variables
The farm variables were grouped into four categories: resource endowment,
production, input use, and an economic dimension. These were used as explanatory variables in the second-stage regression analysis. The selected explanatory variables
were assumed to reflect RDP targets; thus, they could be used to evaluate how RDP targets influence farm efficiency.
The farm variables are explained below.
Resource endowment dimension was represented by four variables: farm area, farm irrigation, the number, and current of machinery at the farm. The RDP developed for supporting the Macedonian grape growing farms was targeted at all family farms utilising between 0.5-20 ha, or maximum 50 ha for legal entities. The assumption was all family farms are covered by the programme and can benefit from it. The
programme proposes building modern irrigation systems and renovating existing irrigation networks are crucial aspects for grape growing farms. It originates from the expectations proper irrigation provides stable yields in an environment where water, nourishment supply and weeds can be completely controlled. From a technological aspect, such systems contribute to increasing yield and decreasing production costs through saving expenses for water, fertilisers, chemicals, and labour. RDP does not support farm growth in terms of purchasing capital-intensive machinery, but purchasing equipment for specific activities is - financially supported.
Farm area (TArea) was measured by the average utilised area of each farm included in the study during 2006-2008, and expressed in hectares. This variable is used as an explanatory variable in many efficiency studies (e.g. Bravo-Ureta & Evenson 1994; Conradie et al. 2006; Haji & Andersson 2006; Hansson 2008), and in different cases is associated with positive and negative influences on efficiency scores. The farms included in this study were considered to have limited managerial, labour, and financial capacity; consequently, farm efficiency was expected to decrease if the area utilised was increased.
Hypothesis 1: TArea has a negative influence on farm efficiency.
Total irrigated area (TIArea) was measured as a share of the total utilised area and presented in percentage (%). Its influence on the farm efficiency has been explained (e.g Puig-Junoy & Argiles 2004; Haji & Andersson 2006) and is usually associated with positive influence on efficiency scores. Conradie et al. (2006) found irrigation is important for table grape production.
Hypothesis 2: TIArea has a positive influence on farm efficiency.
The last two variables measured machinery use on the farms, and was represented by the average number of machinery on the farm (NMachinery) during the reference period, and expressed in pieces and the average machinery value (CVMachin) reported by each farm, originally expressed in MKD denar and then converted into Euro. As grape production is labour intensive, it is possible more machinery and/or higher value of machinery will decrease efficiency, because the farmers will not be able to use all machinery to its maximum potential. Conversely, it is plausible farmers with higher value machinery use higher quality machinery; thus, becoming more efficient. The assets value positively influences efficiency (Haji & Andersson 2006).
Hypothesis 3: NMachinery and CVMachin will influence efficiency. However, whether the influence is positive or negative cannot be stated á priori.
Production dimension – Assurance for stable yield is one of the key issues in the RDP for Macedonian grape production and is directly supported by the measures for stable yield such as: plantation recovery, building and improvements in the irrigation system, anti-hail installation, and measures for mechanisation modernisation. The production dimension was represented by the farm yield as average grape production at each farm (QYield), expressed in kilograms and normalised per hectare. The expectation was higher yield can lead to higher efficiency.
Hypothesis 4: QYield has a positive influence on farm efficiency.
Inputs use – The RDP contains measures for building and renovating irrigation system and measures for modernisation of equipment. Fertilisers and weeds can be controlled through the irrigation system, while purchasing necessary equipment for specific production activities decreases labour cost. If farmers organise the whole production process with the available family labour, extra labour units will only be necessary during the peak season. Inputs use dimension was represented through the material and the labour costs paid by each farmer. Material cost (VCMaterials) was the average cost paid for production materials used by each farm during 2006-2008: the variable was originally expressed in MKD denar and then converted into Euro and normalised per hectare. Labour costs (VCLabour) were the average cost paid for the hired labour during 2006-2008, originally expressed in MKD denar and then, converted into Euro and normalised per hectare. The expectation was higher costs for materials and labour decrease farm efficiency, as costs for materials implied not utilising a more efficient irrigation system, and having more employees implied more monitoring of workers.
Hypothesis 5: VCMaterials and VCLabour have a negative influence on farm efficiency
Economic dimension – RDP measures proposed for the Macedonian grape production are directed toward an increase in output value. Technically, measures proposed for stable yield assurance (recovery of existing old grape plantations, building new
irrigation systems and improving existing systems, anti-hail installation, installation of components for construction support) and the measures for better yield quality
(purchase of phyto-sanitary planting material, replacement of non-recommended hybrid varieties with recognised hybrids) increases both physical and monetary output value. Increased output value can be expected after introducing the measures for purchasing equipment for pruning, mulching, weed removal, fertiliser applicators, and chemicals sprayers. The economic dimension was represented by the total standard output (TSO), which represented the average value of grape production at each farm, originally expressed in MKD denar and then converted into Euro. The influence of economic farm size on the farm efficiency has been represented by different measures in several studies. Latruffe et al. (2005) and Carvahlo et al. (2008) use the value of total output and net income as a proxy for the economic size of the farm and have found positive influences. Opposite results have been presented by Puig-Junoy and Argiles (2004) with the European Size Unit (ESU). TSO is the new official farm size measure adopted by the European farm size measurement system and is directly related to the yield and the production price. The expectation was higher TSO was associated with higher farm efficiency.
4. EMPIRICAL RESULTS 4.1. DEA efficiency
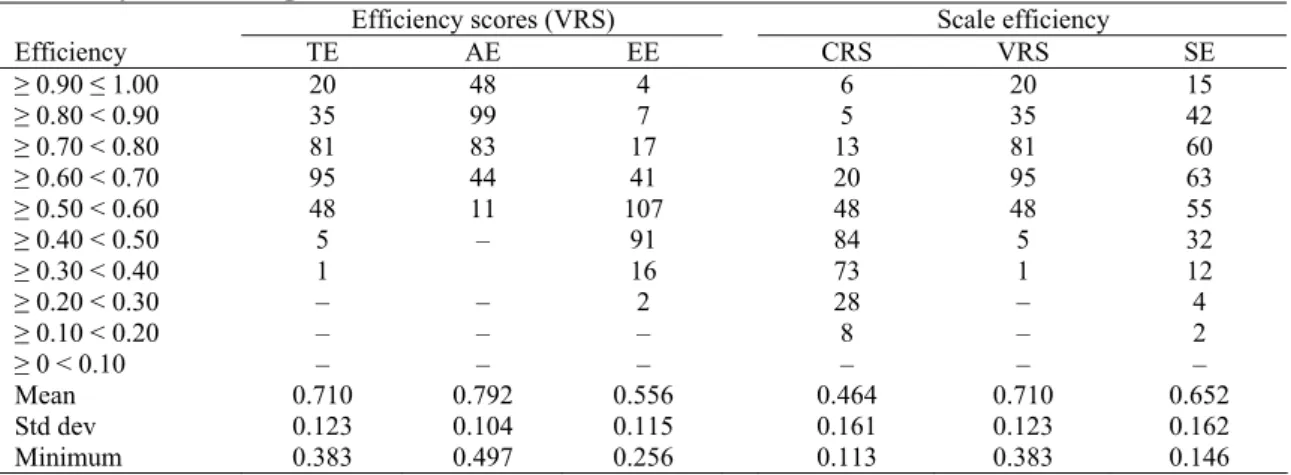
The results were based on an analysis of 285 selected grape-growing family farms, each represented by a three-year average of the collected data set. The average TE score was 0.71, the average AE score was 0.79, and the average EE score was 0.56. Full technical efficiency was registered at thirteen farms and full economic efficiency was a characteristic of only two farms. The analysis of the scale efficiency determined 98% of the farms operated at IRS; one farm operated at DRS, and five farms had full-scale efficiency (SE). Detailed information on the frequency distribution and summary statistics of the efficiency parameters are presented in Table 2.
When TE is taken into consideration, 62% of the farms had TE in the range 0.6-0.8: the lowest TE was 0.38. TE could be increased by on average 29%, if farmers adjusted input use according to the best practice. Supported with the information 98% of the farms operated at IRS, the adjustments should be directed toward decreasing use of inputs and farm growth. The highest variation (60%) in input use was for hired labour, services and energy use (Table 1). Application of fertilisers varied about 35%, which could be a source of inefficiency.
Table 2: Frequency distribution and summary statistics for efficiency scores1. Three-year average values for 2006 to 2008 (n285)
Efficiency scores (VRS) Scale efficiency
Efficiency TE AE EE CRS VRS SE ≥ 0.90 ≤ 1.00 ≥ 0.80 < 0.90 ≥ 0.70 < 0.80 ≥ 0.60 < 0.70 ≥ 0.50 < 0.60 ≥ 0.40 < 0.50 ≥ 0.30 < 0.40 ≥ 0.20 < 0.30 ≥ 0.10 < 0.20 ≥ 0 < 0.10 20 35 81 95 48 5 1 – – – 48 99 83 44 11 – – – – 4 7 17 41 107 91 16 2 – – 6 5 13 20 48 84 73 28 8 – 20 35 81 95 48 5 1 – – – 15 42 60 63 55 32 12 4 2 – Mean Std dev Minimum 0.710 0.123 0.383 0.792 0.104 0.497 0.556 0.115 0.256 0.464 0.161 0.113 0.710 0.123 0.383 0.652 0.162 0.146 Maximum value for the efficiency scores is 1.
The average value for AE score was 0.79, the lowest score derived for AE was 0.497, and full AE was only registered at two farms. This highlighted there is potential for costs decrease by 21%, which could be achieved if farmers managed to have better inputs in combination with their prices. In addition, 64% of farms operated within the range 0.70 to 0.90, with overall variation among all selected farms of 13%. EE was obtained as a combination of TE and AE scores, and the average value was 0.56, implying a possibility for efficiency improvement of about 0.44, if all farms were as efficient as the best-practice ones.
4.2. Influence of RDP target
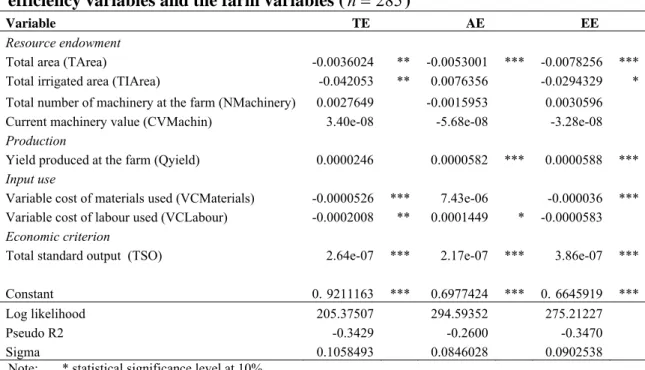
The influence of aspects targeted in the RDP was assessed by Tobit regression. TE, AE, and EE were dependant variables and the farm characteristics targeted in the RDP were explanatory variables. Eight farm variables were constructed, and these are presented in Table 3.
Table 3: Tobit regression results, showing the connection between the DEA efficiency variables and the farm variables (n285)
Variable TE AE EE
Resource endowment
Total area (TArea) -0.0036024 ** -0.0053001 *** -0.0078256 ***
Total irrigated area (TIArea) -0.042053 ** 0.0076356 -0.0294329 *
Total number of machinery at the farm (NMachinery) 0.0027649 -0.0015953 0.0030596
Current machinery value (CVMachin) 3.40e-08 -5.68e-08 -3.28e-08
Production
Yield produced at the farm (Qyield) 0.0000246 0.0000582 *** 0.0000588 ***
Input use
Variable cost of materials used (VCMaterials) -0.0000526 *** 7.43e-06 -0.000036 ***
Variable cost of labour used (VCLabour) -0.0002008 ** 0.0001449 * -0.0000583
Economic criterion
Total standard output (TSO) 2.64e-07 *** 2.17e-07 *** 3.86e-07 ***
Constant 0.9211163 *** 0.6977424 *** 0.6645919 ***
Log likelihood 205.37507 294.59352 275.21227
Pseudo R2 -0.3429 -0.2600 -0.3470
Sigma 0.1058493 0.0846028 0.0902538
Note: * statistical significance level at 10% ** statistical significance level at the 5% *** statistical significance level at 1%
The results presented in Table 3 indicate the variation in the TE, AE, and EE coefficients originated from most of the selected farm variables, as most of these significantly influenced TE, AE, and EE.
Negative and significant influence was hypothesised and confirmed for TArea (Hypothesis 1), and positive and significant influence was hypothesised and could be confirmed for QYield, and TSO (Hypothesis 4 and Hypothesis 6). TArea and TSO had an effect on TE, AE, and EE, whereas, QYield only contributed to the AE and EE variation Table 3 TIArea was hypothesised as important and positively related to farm efficiency, but the result confronted Hypothesis 2 and determined the influence of the percentage share of the irrigated area as significant but negatively related with TE and EE. Nmachinery and CVMachin were not found to be statistically significant variables for farm efficiency, which contradicted Hypothesis 3.
Negative influences were expected from VCMaterials and VCLabour (Hypothesis 5): the hypothesis was confirmed for VCMaterials, but only partially for VCLabour. VCLabour was hypothesised as having a negative influence on farm efficiency in general, but a positive influence for AE was determined.
In the significant cases, TE, AE, and EE were all influenced similarly by the explanatory variables. This implied the explanatory variables were equally as important to the farmers’ abilities of not overusing inputs to produce a given
5. DISCUSSION AND CONCLUSIONS
The aim of this study was to provide an empirical analysis of the performance of Macedonian grape-growing family farms assessed in terms of technical, allocative, and economic efficiency and to relate aspects targeted in the RDP to the efficiency scores. The estimated efficiency scores indicated substantial improvements in the farm
efficiency are possible, if farmers applied more optimal input combinations. TE could be increased by 29%, AE by 21% and EE by 45%. The analysis of the scale efficiency highlighted average TE under CRS is 46% and 71% under VRS. In addition, 98% of farmers operating under VRS, exhibited IRS; full-scale efficiency was only registered at five producers.
Although comparisons between average efficiency scores obtained in different studies should be made with caution, the efficiency scores, assessed relative to the best
practice farms in the sample studied, and the average TE scores obtained, were similar in other studies. The average TE of Portuguese wine farms was 0.793 in 2000 and 0.52 in 2005, producing under DRS (Carvahlo et al. 2008). TE for grape production in South Africa on four different farm sizes (measured in land area) has an average value ranging from 0.65 to 0.76 (Conradie et al. 2006).
On relating the aspects targeted in the RDPs to the efficiency scores, most of the variables had a statistically significant influence on farm efficiency.
In the resource endowment category, only TArea and TIArea were statistically significant. Both variables had a negative influence on TE and EE. TArea was significantly negatively associated with AE.
TArea was hypothesised to decrease farm efficiency, and was confirmed by the results. However, this contradicted the findings of Conradie et al. (2006), who tested land area and determine it as relatively unimportant on the scale effects of grape production in South Africa. A significant but positive influence of utilised area on farm efficiency is determined in other studies analysing different agricultural production (Bravo-Ureta & Evenson 1994; Haji & Andersson 2006; Hansson 2008). As labour intensive
production was the focus of this analysis, the finding was expected and reflected the limited labour capacity of family farms. Larger plantations decrease the possibility for managing farms with the family labour resources, implying extra labour units need to be hired, thus, increasing the variable cost of labour used on the farm. Therefore, the Macedonian RDP should not be directed at increasing the size of grape plantations, if at the same time it does not include measures for improving the managerial capacity of the farmers for managing larger plantations.
Farm irrigation appeared to be negatively associated with farm efficiency, which contradicts the expectation, findings from other researchers, and the RDP measure for renewal of the irrigation system. However, this study does not consider the existence of different irrigation practices, and different vine types, which can be considered a limitation. In addition, the RDP does not specify where the irrigation system is expected to have the highest contribution on production quality and quantity, which can also be considered a limitation, as different sorts, soils, and regions have different water needs. For example, Conradie et al. (2006) found irrigation is only important for
table grape production. The negative influence of the proportion of irrigated area on TE and EE scores was counterintuitive and contradicted Hypothesis 2 and the findings of other authors (e.g. Puig-Junoy & Argiles 2004; Conradie et al. 2006; Haji &
Andersson 2006). Furthermore, in the Macedonian RDP, there are measures where irrigation is promoted as positive for grape production. One explanation may be the bad condition of the Macedonian irrigation system was established in the 1970s and has not been maintained and kept in full operating condition. Therefore, measures taken to improve the system can lead to farms that are more efficient. To confirm whether this result would still be valid, the study would need to be repeated when the irrigation system is improved.
NMachinery and CVMachin did not significantly influence farm efficiency. This finding is noteworthy, as the process of mechanisation and modernisation is a policy measure targeted in many RDP. When labour intensive production is considered such measures can be questioned. However, this study considered the number and value of the equipment. The value should reflect the quality, but it can also reflect several poor quality machines being used instead of one high quality. The machinery used by the Macedonian grape growers varied in terms of quality.
Farm production, represented by the QYield variable, was significantly positively related to AE and EE. Positive association and statistical significance to TE, AE and the EE, were also determined from the economic size criterion TSO: both findings confirmed the expectations and was in agreement with Henriques, et al. (2009) as technical efficiency increases with economic size on Portuguese wine farms. From a technological aspect, the yield is described by the characteristics of the vine types and the production technology applied, including agro-technical, protection and nutrition measures. Higher QYield and TSO can be attained by promoting policy measures for stable harvest and planting more attractive high-yielding vine types. All these
measures are included in the RDP proposed for Macedonian grape production. Input use, as the last tested category comprised VCMaterials, with negative and statistically significant influence on TE and EE, and VCLabour, which was
significantly negatively associated with TE and significantly positively associated with AE. The negative influence of labour use on the TE and EE supported the inverse relationship between impact of the number of workers on land productivity and total factor productivity, which differs across the selected regions, identified by Townsend et al. (1998) for grape production in South Africa; it has been used in an advisory context in that rural development policies need to be formulated according to the sectors’ specifics and the regional characteristics.
In conclusion, the results advocate substantial improvements in farm efficiency are possible, if farmers managed to apply optimal input combinations, and the rural development policies can contribute to strengthening the farms performance and well being in rural areas. More efficient farms used smaller areas, irrigated a smaller proportion of total area, used less hired labour, used and paid less for inputs, but produced a larger quantity, with higher value per hectare. RDP measures targeted at stable yield, yield quality, and modernisation of equipment were important for
enhancing and improving farm efficiency and consequently, the competitiveness of the entire sector. Except for the irrigation measure, the RDP should be improved by
the utilised farm area was negatively related to farm efficiency. Thereby, farm growth should only be supported if it is followed by measures for strengthening managerial capacity. RDP can further be improved by including measures for farmers’ training and education for proper input application and specific skilled activities. Strengthening the capacity of the advisory services and cooperative work are options for such
achievements. In addition according to EU, investing in human capital and skills is crucial to developing opportunities for growth and employment in rural areas (Europen Commission 2006).
The way and the areas in which farmers need educating within the RDP have not yet been studied, and there is a lack of information on RDP measures and practices in terms of increasing farm efficiency. Further study would increase understanding of the problem from a scientific perspective, ensure constructive use of RDP funds, and contribute to safeguarding the economic viability of practitioners and policy makers’ decisions on rural areas.
Acknowledgement
This study would not be possible, without the generosity of the Swedish International Development Agency (SIDA), farmers that have accepted to participate in this project, and the openness for cooperation of the National agency for rural development in Negotino. We also thank to Professor Bo Öhlmer, Professor Hans Andersson, PhD Karin Larsén, and the study reviewers for their valuable comments and suggestions
APPENDIX 1 DEA equations
Technical input-oriented efficiency, for each farm i, under the assumption of variable returns to scale, was obtained by solving the linear program:
) 1 , 0 ( 0 1 N1 0 x 0 Y y subject to minimize i i i i X i (1)
where: θi is a scalar, and measures the technical efficiency for farm i;X and Y are
matrices of the inputs and outputs of all farms in the observation N; Yand X are the efficient projections on the frontier; and, N11 is a constraint for measuring
variable returns to scale.
The technical efficiency scores obtained under variable (VRS) and constant (CRS) returns to scale were used to obtain a measure of scale efficiency:
VRS CRS
SE / (2)
Furthermore, finding the economic efficiency started with solving the cost minimization problem: 0 N1 X x 0 Y y st x w minimize ' i i i i xi 1 0 * * (3)
where: wi, is a vector of input prices; xi* is a cost minimising vector (calculated by the
linear program) of input quantities, given the prices wi and output level Yi; and,
is a constraint for VRS. The economic efficiency was determined by relating the minimum cost to the observed cost, as follows:
1 ' N1 i i i i i wx wx EE */ (4)
Allocative efficiency was obtained by relating the economic efficiency to the technical efficiency of each farm i:
i i i EE
AE / (5)
References
AFONSO, A. and ST. AUBYN, M. (2006). Cross-country efficiency of secondary education provision: A semi-parametric analysis with non-discretionary inputs, Economic Modelling 23(3): 476-491.
ALVAREZ, A. and ARIAS, C. (2004). Technical efficiency and farm size: A conditional analysis, Agricultural Economics 30(3): 241-250.
BIEMER, P. P. and LYBERG, L. E. (Eds) (2003). Introduction to survey quality. New Jersey: John Wiley & Sons.
BOJNEC, S. and LATRUFFE, L. (2007). Farm size and efficiency: the case of Slovenia, 100th Jubilee Seminar of European Association of Agricultural Economists “Development of Agriculture and Rural Areas in Central and Eastern Europe”, Novi Sad, 21st-23rd June 2007.
BOJNEC, S. and LATRUFFE, L. (2009). Determinants of technical efficiency of Slovenian farms, Post-Communist Economies 21(1): 117-124.
BRAVO-URETA, B. E. and EVENSON, R. E. (1994). Efficiency in agricultural production: the case of peasant farmers in eastern Paraguay, Agricultural Economics (10): 27-37.
CARVAHLO, M. L. HENRIQUES, P. D. COSTA, F. and PEREIRA, R. (2008). Characteristics and technical efficiency of Portuguese wine farms, European Association of Agricultural Economists, 2008 International congress held in Ghent, Belgium, 26th-29th August, 2008.
CHARNES, A. COOPER, W. W. LEWIN, A. Y. and SEIFORD, L. M. (1994). Data
envelopment analysis: theory, methodology, and application. Norwell: Kluwer Academic Publishers.
CHARNES, A. COOPER, W. W. and RHODES, E. (1978). Measuring efficiency of decision-making units, European Journal of Operational Research 2(6): 429-444.
COELLI, T. (1996). A Guide to DEAP Version 2.1: A data envelopment analysis (computer) program, CEPA Working Paper 96/8, University of New England, Armidale NSW Australia.
COELLI, T. RAHMAN, S. and THIRTLE, C. (2002). Technical, allocative, cost and scale efficiencies in Bangladesh rice cultivation: A non-parametric approach, Journal of Agricultural Economics 53(3): 607-626.
CONRADIE, B. COOKSON, G. and THIRTLE, C. (2006). Efficiency and farm size in Western Cape grape production: Pooling small datasets, South African Journal of Economics 74(2): 334-343.
EUROPEN COMMISSION, C. R. (2006). Putting rural development to work for jobs and growth, (Ed D.-G. f. a. a. r. development): European Commission, Agriculture DG, Brussels.
FARE, R. GROSSKOPF, S. and LOGAN, J. (1983). The relative efficiency of Illinois electric utilities, Resources and Energy 5(4): 349-367.
FARRELL, M. J. (1957). The measurement of productive efficiency, Journal of the Royal Statistical Society, Series A (General) 120(3): 253-290.
GORTON, M. and DAVIDOVA, S. (2004). Farm productivity and efficiency in the CEE applicant countries: A synthesis of results, Agricultural Economics 30(1): 1-16. HAJI, J. (2007). Production efficiency of smallholders' vegetable-dominated mixed
farming system in eastern Ethiopia: A non-parametric approach, Journal of African Economies 16(1): 1-27.
HAJI, J. and ANDERSSON, H. (2006). Determinants of efficiency of vegetable
production in smallholder farms: The case of Ethiopia, Food Economics - Acta Agricult Scand C (3): 125-137.
HANSSON, H. (2007). Strategy factors as drivers and restraints on dairy farm performance: Evidence from Sweden, Agricultural Systems 94(3): 726-737. HANSSON, H. (2008). Are larger farms more efficient? A farm level study of the
relationships between efficiency and size on specialized dairy farms in Sweden, Agricultural and Food Science 17(4): 325-337.
HANSSON, H. and OHLMER, B. (2008). The effect of operational managerial practices on economic, technical and allocative efficiency at Swedish dairy farms, Livestock Science 118(1-2): 34-43.
HENRIQUES, P. D. D. CARVALHO, M. L. D. and FRAGOSO, R. M. D. (2009). Technical efficiency of Portuguese wine farms, New Medit 8(1): 4-9.
LARSÉN, K. (2008). The effect of machinery- and labour-sharing arrangements on farm efficiency – some results from Sweden. In Economic consequences of
collaborative arrangements in the agricultural firm, PhD thesis, Acta Universitatis Agriculturae Sueciae, 2008:28, Uppsala.
LATRUFFE, L. BALCOMBE, K. DAVIDOVA, S. and ZAWALINSKA, K. (2004).
Determinants of technical efficiency of crop and livestock farms in Poland, Applied Economics 36(12): 1255-1263.
LATRUFFE, L. BALCOMBE, K. DAVIDOVA, S. and ZAWALINSKA, K. (2005). Technical and scale efficiency of crop and livestock farms in Poland: Does specialization matter? Agricultural Economics 32(3): 281-296.
OLSON, K. and VU, L. (2009). Economic efficiency in farm households: trends,
explanatory factors, and estimation methods, Agricultural Economics 40(5): 587-599.
PUIG-JUNOY, J. and ARGILES, J. M. (2004). The influence of management accounting use on farm inefficiency, Agricultural Economics Review 05(2): 47-66.
SHARMA, K. R. LEUNG, P. and ZALESKI, H. M. (1999). Technical, allocative and economic effciencies in swine production in Hawaii: A comparison of parametric and nonparametric approaches, Agricultural Economics (20): 23-35.
SIMAR, L. (1996). Aspects of statistical analysis in DEA-type frontier models, Journal of Productivity Analysis 7(2): 177-185.
SIMAR, L. and WILSON, P. W. (2000). Statistical inference in nonparametric frontier models: The state of the art, Journal of Productivity Analysis 13(1): 49-78. SIMAR, L. and WILSON, P. W. (2007). Estimation and inference in two-stage,
semi-parametric models of production processes, Journal of Econometrics 136(1): 31-64.
TOWNSEND, R. F. KIRSTEN, J. and VINK, N. (1998). Farm size, productivity and returns to scale in agriculture revisited: A case study of wine producers in South Africa, Agricultural Economics 19(1-2): 175-180.
WILSON, P. HADLEY, D. and ASBY, C. (2001). The influence of management
characteristics on the technical efficiency of wheat farmers in Eastern England, Agricultural Economics 24(3): 329-338.