w o r k i n g
p
a
p
e
r
0 2
0 6
Does It Pay to Work?
by Jagadeesh Gokhale,
Laurence J. Kotlikoff and
Alexi Sluchynsky
Working papers
of the Federal Reserve Bank of Cleveland are preliminary materials circulated to stimulate discussion and critical comment on research in progress. They may not have been subject to the formal editorial review accorded official Federal Reserve Bank of Cleveland publications. The views stated herein are those of the authors and are notnecessarily those of the Federal Reserve Bank of Cleveland or of the Board of Governors of the Federal Reserve System.
Working papers are now available electronically through the Cleveland Fed’s site on the World Wide Web:
Jagadeesh Gokhale is at the Federal Reserve Bank of Cleveland and may be contacted at [email protected] or (216) 579-2970.
Laurence J. Kotlikoff is at Boston University and the National Bureau of Economic Research and may be reached at [email protected].
L
aurence Kotlikoff thanks
The Smith Richardson Foundation, Boston University, Economic
Security Planning, Inc., the Employment Policies Institute, and
the National Institute of Aging for research support.
Alexi Sluchynsky is currently Pension Policy Adviser to the
Ministry of Economy and Finance under the KMG Project in Kosovo.
Working Paper 02-06
June 2002Does It Pay to Work?
by Jagadeesh Gokhale, Laurence J. Kotlikoff and Alexi Sluchynsky
Does it pay to work? This is a tough question to answer because of the complexity of the tax code and a plethora of dynamiclinkages involved. First, earning more today typically alters current saving and, therefore, future capital income taxes. Second, earning more today generally alters future consumption and, therefore, future consumption taxes. Third, changing future levels of income and assets changes the eligibility for and levels received of income- and asset-tested transfer benefits. Fourth, the most important transfer program, Social Security, explicitly links future transfer payments to current earnings. Fifth, income taxes in retirement depend on past earnings because Social
Security benefits depend on past earnings and these benefits are subject to federal income taxation. This paper attempts to capture the net effective tax on work by using an intertemporal model
capable of carefully determining tax and transfer payments at each stage of the life cycle.
JEL Classification: H2
Key Words: intragenerational accounting, marginal net taxes, dynamic optimization
I. Introduction
Does it pay to work? Given the number and complexity of federal and state tax and transfer systems, this is a tough question to answer. The problem is greatly compounded by the fact that what one earns in one year alters not just current taxes and transfer payments in that year, but in future years as well. There are five dynamic linkages here. First, earning more in the present typically alters current saving and, therefore, future levels of capital income and capital income taxes. Second, changing future levels of income and assets changes the eligibility for and levels received of income- and asset-tested transfer benefits. Third, earning more in the present generally alters not just current, but also future levels of consumption, and, therefore, future consumption taxes. Fourth, the most important transfer program, Social Security, explicitly links future transfer payments to current earnings. Fifth, the income taxation of Social Security benefits means that income taxes in a year Social Security benefits are received depend on past Social Security-covered earnings because the benefits are, themselves, determined by past covered earnings.
Thus, understanding the effective net tax on work and the changes in work taxes associated with policy reforms requires an
intertemporal model capable of carefully determining tax and
transfer payments at each stage of the life cycle based, in part, on economic choices in prior periods. This study uses ESPlanner,
a financial planning software program developed by Economic
Security Planning, Inc., to study the net work tax levied on workers with different earnings capacities.
their capacities to borrow. In so doing, it makes highly detailed, year-by-year federal and state income tax and Social Security benefit calculations. To produce a comprehensive work tax measure, we added to ESPlanner all other major transfer
programs, including Food Stamps, Transitional Aid to Families with Dependent Children (TAFDC), Medicaid, Medicare, Housing Assistance, Supplemental Security Income (SSI), Special Supplemental Nutrition Program for Women, Infants, and Children (WIC), and the Low Income Home Energy Assistance Program (LIHEAP).
Our goal is calculating average and marginal net work taxes facing stylized young couples with different levels of earnings. We begin by calculating average lifetime net tax rates defined as the ratio of lifetime net taxes to lifetime earnings. We then present average and marginal net tax rates on working full-time and half-time throughout one’s lifetime and the marginal net tax from switching from half-time to full-time work. Finally, we measure marginal net tax rates on working at particular ages.
Our measured present values of spending in both the presence and absence of fiscal policy are actuarial calculations. They adjust for the probability that one or both spouses may die prior to reaching her or his maximum age of life. This actuarial valuation is very important because surviving widows and widowers can face very different taxes and transfers from those they face when married. These survivor-specific fiscal policies are also included in the analysis.
We find seven things. First, our fiscal system is highly progressive. Households earning the minimum wage receive 18 cents
in benefits net of taxes for every dollar they earn. In contrast, households with million dollar salaries pay 54 cents in taxes net of benefits per dollar earned. Second, progressivity is primarily restricted to the bottom end of the income distribution. Average net work tax rates of middle class households are relatively high compared with those of the rich. Third, while the poor face negative average taxes, they face significant positive marginal net taxes on working. Indeed, a minimum wage household that chooses to work is forced to surrender 34 cents of every dollar earned in net taxes. For workers earning one-and-a-half or more times the minimum wage, the marginal net tax on full-time work exceeds 50 percent. Fourth, low-wage workers face confiscatory tax rates on switching from part-time to full-time work. Fifth, the same is true of secondary earning spouses in low-wage households. Sixth, the marginal net tax on working is dramatically higher for most workers when young than when old. Seventh, average and marginal net work tax rates are relatively insensitive to the assumed rate of real wage growth and the discount rate. And eighth, major tax reforms, such as switching from income to consumption taxation, can have a significant affect on the fiscal system’s overall progressivity.
The paper proceeds with a brief mention of related prior studies. It next describes the complexity of the tax-transfer system and, by implication, the need to sweat those details to measure net tax rates accurately. It then describes our
methodology, ESPlanner and its use in this study, the
characteristics of our stylized households, our approach to modeling the fiscal system, and our findings. The final section
summarizes and concludes. II. Prior Studies
Many studies of lifetime fiscal burdens and their distribution have examined one fiscal policy at a time. Boskin, et. al. (1987), Caldwell, et. al. (1999), Gokhale and Kotlikoff (1999), and Myers and Schobel (1993) are all examples of studies of Social Security’s lifetime net tax treatment. Poterba (1989) considers the lifetime incidence and distribution of excise taxes. And Fullerton and Rogers (1995) study the lifetime incidence of consumption taxes. None of these studies consider the tax on work per se.
Fullerton and Rogers (1993) represents the first serious attempt to quantify the lifetime burden of the entire U.S. tax system, but, again, not the tax on work. They construct an elaborate life-cycle general equilibrium model and use it to study the incidence of particular U.S. tax systems. Their impressive framework allows them to consider the full incidence of the tax system. Fullerton’s and Roger’s approach and subsequent related work by Altig et al. (2001) provide significant insight into the burden and distribution of gross tax liabilities. Fullerton and Rogers find that the personal federal income tax is highly progressive, with the lowest income groups paying 5 percent of their lifetime incomes and the highest income groups paying 19 percent.
Although these studies tell us a lot about gross tax liabilities, they are relatively silent about overall net tax liabilities as well as the net tax on work. Moreover, they are highly stylized and do not consider many of the details of the
tax-transfer system that affect its impact. For example, they
don’t consider tax credits, such as the earned income tax credit and the child tax credit. Nor do they consider the phase-out of itemized deductions, the taxation of social security benefits, or the progressivity of state income taxation.
Hubbard et al. (1995) provide a partial equilibrium analysis of the impact of the fiscal system on saving decisions in a setting with earnings and health expenditure uncertainty. Their focus is on the system’s transfer programs, particularly its saving disincentives for the poor. Although their model would permit an analysis of the fiscal system’s overall progressivity, they don’t use it for that purpose. Nor is it necessarily ideal for such an analysis because it is also highly stylized.
Unlike the studies of Fullerton and Rogers (1993) and Altig et al. (2001), the analysis here is partial equilibrium in nature; i.e., it doesn’t take into account feedback effects of fiscal policy on the pretax level of wages or the pretax return to capital. And unlike Hubbard et al. (1995), our model doesn’t consider behavioral reactions to fiscal work and saving disincentives. Instead, we investigate the work disincentives of
our tax-transfer program without studying the reaction of
households or the macro economy to those disincentives. In this respect, our study is close to Pechman’s (1985) work, although his focus was comparing annual gross taxes to annual income, as opposed to comparing lifetime net taxes to lifetime income.
III. The Complexity of Our Tax-Transfer System
It’s difficult to exaggerate the complexity of the taxes and transfer programs facing American workers. Mastering just the
federal income tax represents a major challenge because it comprises so many special provisions. The list includes the inflation-indexation of tax brackets, the partial, but graduated taxation of Social Security benefits above two non inflation-indexed thresholds, the treatment of retirement account
contributions and withdrawals, the phase-out of itemized
deductions, the earned income tax credit, the child-tax credit, the alternative minimum tax, and the recently legislated credit to low-income households for contributing to retirement accounts.
If the federal income tax weren’t hard enough to follow, almost all states have income taxes with their own special provisions. For example, Massachusetts has a special exemption for the elderly, a child deduction, a rental deduction, and a deduction for employee-paid payroll taxes. Compared to these taxes, the FICA payroll tax may seem straightforward. But workers who want to calculate their lifetime net work taxes must understand its ceiling, how that ceiling changes through time, the degrees to which employer and employee payroll contributions are and are not subject to federal and state income taxation, and the degree to which their employer’s retirement account contributions and other fringe benefit payments are and are not subject to payroll taxation.
Figuring out these three tax systems and their interdependencies provides a good apprenticeship for approaching our benefit programs. The most complex of these is surely Social Security, which requires a handbook of over 500 pages to clarify its provisions. Those brave enough to wade through this tomb will learn about eligibility requirements, primary insurance amounts,
partial wage indexation of earnings histories, inflation indexation of benefit levels, benefit reductions for early retirement, recomputation of benefits, the delayed retirement credit, family benefit maximums, the recently modified earnings test, retirement benefits, survivor benefits, mother and father benefits, children benefits, spousal benefits, and divorcee benefits. Unfortunately, reading the Handbook in its entirety raises almost as many questions as it answers – questions that can only be resolved via detailed interrogatories with actuaries at the Social Security Administration.
Although their intricacies pale in comparison with those of Social Security, understanding the details of our other benefit programs can also gray one’s hair, particularly those dealing with the relationship of one program’s benefits to those of another. Take Medicare and Medicaid. Medicare’s co-payments are covered by Medicaid under certain conditions. But if covered, these co-payments reduce the income deduction for Food Stamps and, thus, the ultimate amount of Food Stamps received. And Medicaid benefits are, themselves, income tested, where income includes Social Security and SSI (Supplemental Security Income) benefits. IV. Defining Net Work Tax Rates
A simple two-period framework motivates the formula we use to calculate net tax rates on working. Let cy stand for consumption
when young, co for consumption when old, r for the pre-tax rate of
return earned on saving, ey for earnings from working full time
when young, e0 earnings from working full time when old, and T(ey,
eo, cy, co, r) for the present value, discounted at rate r, of
a function of earnings when young and old, consumption when young and old, and the pre-tax rate of return, since taxes paid and transfer payments received when young and old depend on all of these variables.1
The household’s lifetime budget constraint is (1) C =E−T(cy,co,ey,eo,r),
where C stands for the present value of consumption and E for the
present value of earnings when the household works fulltime and earns ey when young and eo when old.
2
The average work tax rate,
−
τ
, is defined as. (3) E r e e c c T( y, o, y, o, ) =τ
.To understand our calculation of marginal net work tax rates,
let C* refer to the present value of consumption when earnings are
zero (when the household doesn’t work), and let c*y and c *
o denote
consumption when young and old in that setting. Hence, (2) ( , ,0,0, ) * * * r c c T C =− y o
Note that C* can be positive when earnings are zero if the
household receives transfers (T* is negative). The marginal net
work tax rate, τ, is given by
(3) * * ) ( C E C C E + − + =
τ
To understand this tax rate, note that E+C* represent the increase
1
For example, consumption taxes, including sales taxes and excise taxes, depend on consumption when young and old (cy and co); payroll taxes when young and old depend on earnings when young and old (ey and eo); and income taxes depend on total labor plus asset income when young and old (ey and eo + r(ey –
in lifetime spending that would occur if, in going to work, the household could keep it’s basic benefits, measured by C* (the
present value of consumption if the household doesn’t work), and also keep its entire increase in lifetime earnings, given by E
(the present value of full-time earnings). The difference between this amount and C -- what the household actually gets to consume
as a result of working – is the numerator of this tax rate. It represents the absolute amount the household loses (or gains, if τ is negative) from working. This net loss divided by the total potential gain is the net tax rate from the household working full time over its lifetime.
Note that E not only equal the present value of earnings; it
also equals the present value of consumption that the household would enjoy in the absence of any fiscal policy (the case that
T(ey, eo, cy, co, r)=0 regardless of its arguments). Call that
present value C**. Hence, the work tax rates can be expressed
solely in terms of present values of consumption; i.e.,
(4) ** ) , , , , ( C r e e c c T y o y o =
τ
, and (5) ** * * * * ) ( C C C C C + − + =τ
.These formulae are, with several important caveats, the ones we use to measure average and marginal net tax rates from full-time work as well as from half-full-time work. The first caveat is that we replace the present values of consumption with their corresponding present values of total spending. Spending includes not just expenditures on consumption goods and services, including housing services, but also spending on life insurance premiums and
special expenditures, like weddings and college tuition paid on behalf of children. Second, since some of spending goes to pay excise, sales, and other taxes on consumption, in measuring the present value of spending in the presence of fiscal policy, we reduce spending by θ percent, where θ is the consumption tax rate. In what follows, “spending” is used to refer to spending net of consumption taxes.
A third important difference in our actual and the model’s net tax rates is that our measure of the present value of spending adds in the present value of all transfer payments other than Social Security benefits (which are already included in
ESPlanner). Effectively, then we treat all non-Social Security
transfers (Food Stamps, WIC, TAFDC, Housing Assistance, SSI, WIC, and LIHEAP, Medicare, and Medicaid) as non-fungible and simply add their present value to the present value of spending calculated by
ESPlanner. Our procedure here assumes that these benefits are
spent in the year they are received. This makes sense for most of these transfers, since they are provided in kind, rather than in cash. However, our treatment of TAFDC and SSI, which are provided in cash, as non-fungible is made for computational convenience. Specifically, treating these two benefits as fungible dramatically increases computation time because of the complexity of their income and asset tests.
V. Actuarial Valuation
There is a final and very important difference in our actual net work tax formula. In forming the present values of lifetime spending (and consumption, which we need in order to net out consumption taxes), we take into account the fact that neither
spouse may live to her or his maximum age of life (age 95). As a widow or widower, each spouse will pay different amounts of taxes and receive different amounts of benefits than would be the case was she still married. Our precise net work tax formulas are based on the actuarial present values of lifetime spending, where we a) multiply the spending levels in all future years when both spouses are alive by the probability of their both living through those years and b) multiply the spending levels when each spouse is a widow or widower by the probability of that survivorship state occurring. Since the amount a widow or widower spends in a particular year can differ depending on when her or his spouse passed away, we form survivorship probabilities conditional on the age of death of the spouse and calculate spending separately for each spouse conditional on the death age of her/his partner.
VI. ESPlanner
ESPlanner uses dynamic programming techniques to smooth a
household’s living standard over its life cycle to the extent possible without allowing the household to go into debt. In making its calculations, ESPlanner takes into account the
non-fungible nature of housing, bequest plans, economies of shared living, the presence of children under age 19, and the desire of households to make “off-the-top” expenditures on college tuition, weddings, and other special expenses. In addition, ESPlanner
simultaneously calculates the amounts of life insurance needed at each age by each spouse to guarantee that potential survivors suffer no decline in their living standards compared with what would otherwise be the case.
ESPlanner’s calculates time-paths of consumption expenditure,
taxable saving, and term life insurance holdings in constant (2001) dollars. Consumption in this context is everything the
household gets to spend after paying for its “off-the-top”
expenditures – its housing expenses, special expenditures, life insurance premiums, special bequests, taxes, and net contributions
to tax-favored accounts. Given the household’s demographic
information, preferences, and borrowing constraints, ESPlanner
calculates the highest sustainable and smoothest possible living standard over time, leaving the household with zero terminal assets apart from the equity in homes that the user has chosen to not sell. The amount of recommended consumption expenditures needed to achieve a given living standard varies from year to year in response to changes in the household’s composition. It also rises when the household moves from a situation of being liquidity constrained to one of being unconstrained. Finally, recommended household consumption will change over time if users intentionally specify that they want their living standard to change.
ESPlanner’s algorithm is complicated. But it’s easy to check ESPlanner’s reports to see that, given the inputs, preferences,
and borrowing constraints, the program is recommending the highest and smoothest possible living standard that the household can sustain over time.
Since the taxes paid by households depend on their total incomes, which include asset income, how much a household pays in taxes each year depends on how much it has consumed and saved in the past. But how much the household can consume and, therefore, how much it will save depends, in part, on how much it has to pay
in taxes. Thus taxes depend on income and assets, which depend on taxes. This simultaneity means that the time-paths over the household’s life cycle of consumption, saving, and tax payments must be jointly determined. ESPlanner achieves this simultaneous
and consistent solution not only with respect to consumption and saving decisions, but also with respect to the purchase of life insurance.3
Because taxes and Social Security benefits make a critical difference to how much a household should consume, save, and insure, casual calculations of these variables is a prescription for seriously misleading financial recommendations.4 As mentioned,
ESPlanner has highly detailed federal income tax, state income
tax, Social Security’s payroll tax, and Social Security benefit calculators. The federal and state income-tax calculators determine whether the household should itemize its deductions, computes deductions and exemptions, deducts from taxable income contributions to tax-deferred retirement accounts, includes in taxable income withdrawals from such accounts as well as the taxable component of Social Security benefits, and calculates total tax liabilities after all applicable refundable and non refundable tax credits.
These calculations are made separately for each year that the couple is alive as well as for each year a survivor may be alive.
3
The program not only calculates the appropriate levels of life insurance at each age for each spouse when both are alive. Bit also determines how much life insurance each surviving spouse needs to purchase.
4
See Gokhale, Jagadeesh, Laurence J. Kotlikoff, and Mark Warshawsky, “Comparing the Economic and Conventional Approaches to Financial Planning,” in Laurence J. Kotlikoff, Essays on Saving, Bequests, Altruism, and Life-Cycle
Moreover, ESPlanner’s survivor tax and benefit calculations for
surviving wives (husbands) are made separately for each possible date of death of the husband (wife). I.e., ESPlanner considers
separately each date the husband (wife) might die and calculates the taxes and benefits a surviving wife (husband) would receive each year thereafter.
VII. Our Stylized Couples
Our stylized household features a husband and wife, both of whom are initially age 18 and live at most to age 95. The couple has two children, one at age 25 and one at age 27. Both spouses earn the same income and work through age 64. Their initial annual earnings, which grow by 1 percent in real terms each year, are multiples of the minimum wage times 40 hours per week times 52 weeks. Both children attend college between ages 19 and 22. Couples with annual earnings below $105,000 pay one third of their total initial real annual earnings in college tuition/room and board for each child for each year of education. For couples earning $105,000 or more, college support payments are capped at $35,000 (one third of $105,000).
The couple initially rents a house for 25 percent of its total initial annual earnings. But at age 25, the couple purchases a house for three times initial earnings. This purchase is financed with a 20 percent down payment and an 80 percent mortgage carried at an 8 percent nominal interest. The couple earns a 4 percent real pre-tax return on assets. Funeral expenses for each spouse are 10 percent of each spouse’s initial annual earnings, up to a maximum of $10,000. There are no bequests apart from the value of home equity when the last spouse dies, since the
couple never sells its home. VIII. Modeling the Fiscal System
As indicated in the Appendix, our analysis incorporates all major tax-transfer programs at both the federal and state levels. To account for overall labor productivity growth, which we assume underlies the growth in real wages of our stylized couples, we index annual real benefit amounts as well as real benefit brackets in the benefit formulae to an index of the real wage. We assume this index grows at the same rate as the real wages of our stylized couples. The one exception here is the thresholds at which Social Security benefits become taxable under the federal income tax. The federal government has eliminated inflation-indexation of these thresholds in what appears to be an intentional policy of increasing, over time, the share of benefits subject to taxation.
From an economics perspective, employer-paid payroll taxes are no less of a burden on workers than those paid directly by employees. To incorporate these taxes, we gross up each spouse’s labor earnings by the amount of the employer-paid payroll taxes and raise ESPlanner’s rate of payroll taxation from 7.15 percent
to 15.3 percent – the combined OASDHI payroll tax rate.5 For purposes of calculating federal income taxes, however, we do not gross up labor earnings, since employer contributions are an exclusion from the federal income tax base. While making these adjustments makes no change in ESPlanner’s recommended consumption
or total spending in the presence of the tax-transfer system,
5
To be more precise, we gross up each spouse’s labor income by a) 1.45 percent, which is the HI employer payroll tax rate, plus b) 5.7 percent of
these values are higher when we turn off all taxes and transfers. In terms of equation (4), C** (the present value of spending in
the absence of all taxes and transfers), and, therefore, our calculated lifetime net work tax rate, is larger because of this adjustment for employer-paid payroll taxes.
Like employer-paid payroll taxes, federal and state corporate income taxes represent a hidden tax, whose burden (incidence) falls on workers. We treat these taxes in a parallel fashion to employer-paid payroll taxes. Specifically, we a) increase our assumed nominal rate of return by the amount of these taxes and b) adjust ESPlanner’s calculation of income taxes to include these
“corporate” taxes on capital income. By making these two
adjustments, ESPlanner’s recommended consumption and, therefore,
present value of spending in the presence of the tax-transfer system remains unchanged, but it is higher when we turn off all taxes and transfers. Again, C**, and, therefore, our calculated
lifetime net work tax rate, is larger because of this adjustment for employer-paid payroll taxes. In making this adjustment for corporate income taxes, we are assuming that the elimination of corporate income taxes would fully redound to the benefit of workers in the form of a higher rate of return earned on their savings.6
The Appendix details our calculation of taxes and the benefits from transfer programs. In the case of the various benefit programs, we take into account income and asset tests. We the OASDI employer payroll tax rate.
6
An alternative incidence assumption, which would be appropriate for a small open economy and which we don’t pursue here, is to assume that the incidence of corporate income taxes falls on workers in the form of lower wages, rather
also take into account the joint determination of benefits arising from the fact that the level of benefits available from one program may depend on the level of benefits received from another.
IX. Findings
Table 1 presents average net work tax rates from full-time work. This tax rate divides the household’s total net taxes
associated with working full time through retirement by the
present value of spending the household would enjoy in the absence of taxes or transfers. Consider first households earning the minimum wage. Their average net tax rate is a negative 17.8 percent meaning their lifetime spending is 17.8 percent higher from working than it would be in the absence of any fiscal policy. The table’s second row indicates that households earning 1.5 times the minimum wage, or $32,100 at the beginning of their careers, face a 25.8 percent average net work tax. For household earning twice the minimum wage, with an initial annual income of $42,800, the average net tax rate is 33.4 percent. For households earning from three to forty times the minimum wage, average work tax rates gradually rise from 40.2 percent to 54.4 percent.
These findings lead to the following three conclusions. First, subsidization of work essentially begins and ends with minimum wage households. Second, most low-income households pay fairly substantial shares of their lifetime economic resources in the form of net taxes. And third, the fiscal system is fairly
progressive at the bottom, but is roughly proportional with
respect to the treatment of upper middle-income, high-income, and very high-income households.
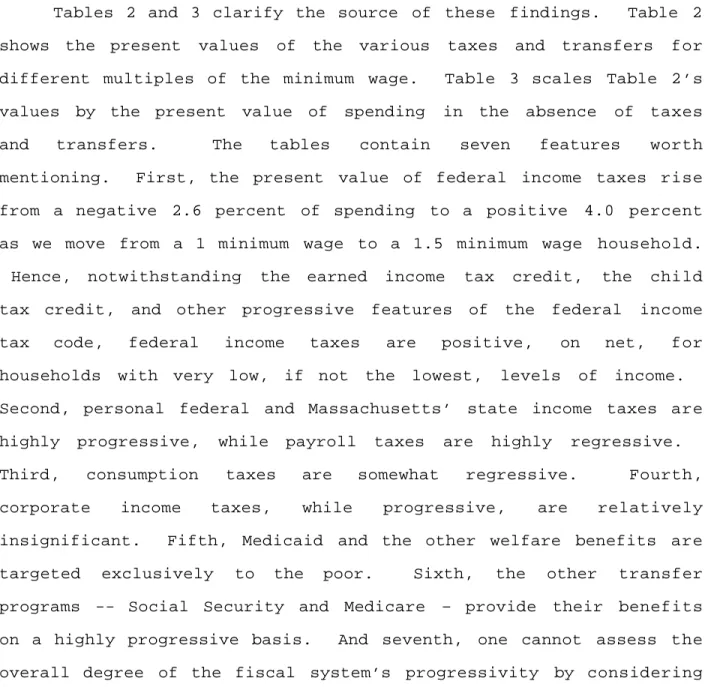
Tables 2 and 3 clarify the source of these findings. Table 2 shows the present values of the various taxes and transfers for different multiples of the minimum wage. Table 3 scales Table 2’s values by the present value of spending in the absence of taxes
and transfers. The tables contain seven features worth
mentioning. First, the present value of federal income taxes rise from a negative 2.6 percent of spending to a positive 4.0 percent as we move from a 1 minimum wage to a 1.5 minimum wage household. Hence, notwithstanding the earned income tax credit, the child tax credit, and other progressive features of the federal income tax code, federal income taxes are positive, on net, for households with very low, if not the lowest, levels of income. Second, personal federal and Massachusetts’ state income taxes are highly progressive, while payroll taxes are highly regressive.
Third, consumption taxes are somewhat regressive. Fourth,
corporate income taxes, while progressive, are relatively
insignificant. Fifth, Medicaid and the other welfare benefits are targeted exclusively to the poor. Sixth, the other transfer programs -- Social Security and Medicare – provide their benefits on a highly progressive basis. And seventh, one cannot assess the overall degree of the fiscal system’s progressivity by considering any one tax or transfer program in isolation.
Marginal Net Full-Time Work Tax Rates
Table 4 switches attention from average to marginal net time work tax rates. As discussed above, the marginal net full-time work tax considers the net increase in spending that a worker experiences in switching from no work to working full time. In contrast to Table 1, all households face positive and substantial
marginal net full-time work tax rates. Indeed, the minimum wage household faces a 33.6 percent marginal tax on working full time even though its average tax is negative 17.8 percent. The reason for this large difference in average and marginal net tax rates is that households who don’t work receive very substantial transfers. These transfers are substantially reduced when the households go to work full time. The net tax on going to work full time is positive both because transfers are reduced and because taxes become positive.
Households earning 1.5 or more times the minimum wage face marginal net full-time work taxes that range between 51.1 percent and 55.4 percent. Hence, in going to work, the vast majority of American households hand over slightly more than half of every dollar they earn to state and federal government. Moreover, the fact that all but the lowest income workers face roughly the same effective marginal net tax rates on full-time work means that the distortion (excess burden) facing the vast majority of workers associated with the decision to work full time is roughly the same share of lifetime spending.
Half-Time Work Tax Rates
Tables 5 through 8 repeat the above analysis for half time rather than full-time work. Table 5 shows a very substantial average subsidy of 121.0 percent given to minimum wage households who work half time. The average subsidy drops to 56.4 percent for households earning 1.5 times the minimum wage and to 17.8 percent for households earning twice the minimum wage. Higher wage households face positive average half-time net tax rates. At three times the minimum wage the net tax rate is 25.8 percent.
The rate rises gradually to 54.0 percent for the 40-times minimum wage household.
Tables 6 and 7 decompose these average net tax rates of Table 5 into their different tax and transfer components. They show that the federal income tax generates a substantial average net subsidy for half-time workers earning at or very close to the minimum wage. Medicaid is the most important transfer provided to poor half-time workers. Indeed, for minimum wage households, Medicaid provides 80 cents for every dollar of spending the household would do in the absence of any fiscal policies.
Table 8 presents marginal net taxes on switching from zero work to working half time. As in Table 4, all marginal tax rates are positive, starting with the minimum wage household, which faces a 13.2 percent net tax rate. Once the household’s wage is three or more times the minimum, the marginal tax is above 50 percent. Again, the explanation for the positive sign of marginal net tax rates for the poor is that even half-time work leads to substantial increases in federal income taxes and reductions in benefits from transfer programs.
Table 9 considers a different marginal net work tax rate, namely that imposed on switching from half-time to full-time work. For very low-wage workers as a group, the loss in benefits and the rise in taxes are so large as to eliminate almost any economic gain from the switch. Indeed, households earning 1.5 times the minimum wage who switch from half- to full-time work end up handing away 105 cents for every dollar earned! While less than 100 percent, the net tax rate on moving from half time to full time work is still quite large for middle-income households, but
it drops substantially with earnings for very high earners. The reason for the drop is intuitively clear: High earners pay federal and state income taxes at the highest rate brackets even when working half-time but low and middle-income households become subject to higher marginal income tax rates upon switching from half- to full-time work.
Net Work Tax Rates on Second Earners
Table 9’s net tax rates not only indicate the rate of net taxation of both spouses’ earnings if both switch from half time to full-time work. They also indicate the net tax rate imposed on a non-working spouse who decides to work full time and earns the same amount as his/her partner. From this perspective, the U.S. fiscal system is very strongly encouraging one spouse in low-wage married households to stay out of the labor force. Because of child rearing, cultural norms, and gender differences in pay, the spouse being forced out of the work force by our fiscal system will typically be the wife.
Age-Specific Net Work Tax Rates
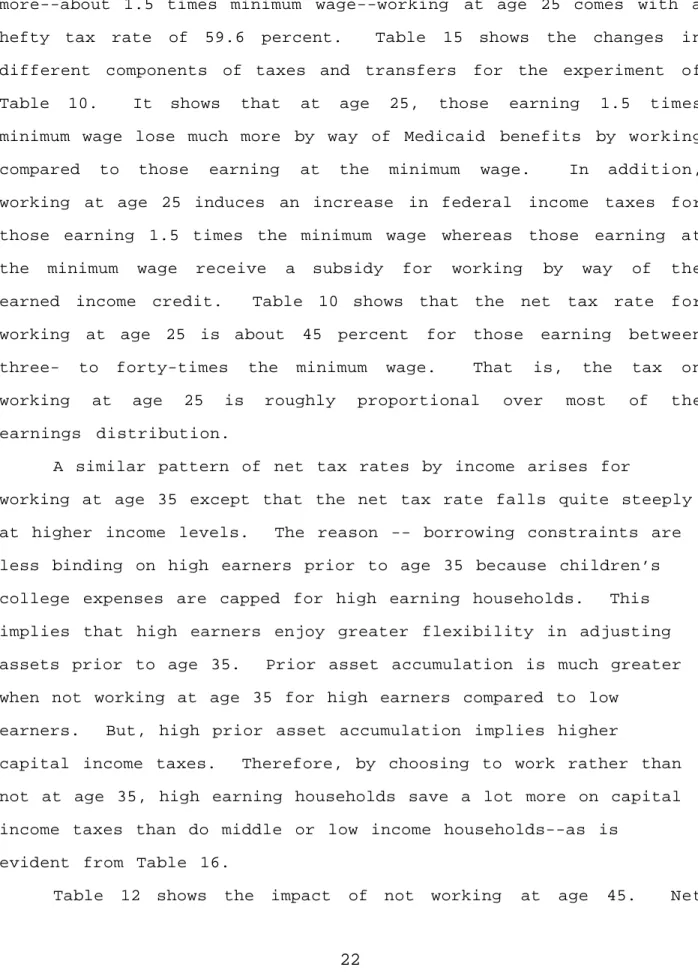
Tables 10 through 14 present net tax rates on working at a particular age given that the household works at all other ages. The experiment here compares a) the increase in lifetime spending from working versus not working at a particular age under the current fiscal system with b) the increase in lifetime spending from working rather than not working at that age in the absence of all taxes and transfers. The value [1–(a/b)]_100 equals the tax bite imposed on working at the age under consideration. At 9.7 percent, the net tax rate on working at age 25 is fairly low for minimum wage workers. However, for workers earning just a little
more--about 1.5 times minimum wage--working at age 25 comes with a hefty tax rate of 59.6 percent. Table 15 shows the changes in different components of taxes and transfers for the experiment of Table 10. It shows that at age 25, those earning 1.5 times minimum wage lose much more by way of Medicaid benefits by working compared to those earning at the minimum wage. In addition, working at age 25 induces an increase in federal income taxes for those earning 1.5 times the minimum wage whereas those earning at the minimum wage receive a subsidy for working by way of the earned income credit. Table 10 shows that the net tax rate for working at age 25 is about 45 percent for those earning between three- to forty-times the minimum wage. That is, the tax on working at age 25 is roughly proportional over most of the earnings distribution.
A similar pattern of net tax rates by income arises for
working at age 35 except that the net tax rate falls quite steeply at higher income levels. The reason -- borrowing constraints are less binding on high earners prior to age 35 because children’s college expenses are capped for high earning households. This implies that high earners enjoy greater flexibility in adjusting assets prior to age 35. Prior asset accumulation is much greater when not working at age 35 for high earners compared to low
earners. But, high prior asset accumulation implies higher
capital income taxes. Therefore, by choosing to work rather than not at age 35, high earning households save a lot more on capital income taxes than do middle or low income households--as is
evident from Table 16.
marginal tax rates are in the teens at low-income levels and stay relatively flat until 10-times-minimum-wage level of earnings. The tax rates rise sharply for very high earners. By age 45, households have paid off children’s college expenses and are beginning to save for retirement. Again, low and middle income households accumulate more assets by age 45 when not working at age 45 compared to working at that age. Hence, as before, they save on capital income taxes prior to age 45 by working at age 45. This translates into saving on capital income taxes on a lifetime basis for low earners.
As can be seen from Table 17, the story is somewhat different for high-income individuals. Although these households also accumulate more assets by age 45 when not working compared to working at that age—thereby saving on capital income prior to age 45—this saving is more than offset by higher capital income tax payments in later years. The cap on college expenditures for high earners implies that their borrowing constraint becomes nonbinding much earlier when they work at age 45 compared to when they do not work. This induces two effects: First, the amount of capital income taxes saved prior to age 45 is not much higher for high earners compared to low earners. Second, because saving for retirement begins earlier when working at age 45 (because the borrowing constraint become non-binding earlier), asset accumulation is much larger prior to retirement and high earners pay much more in capital income taxes after age 45. Hence, high earners pay more in capital income taxes on a lifetime basis when working relative to not working at age 45. This explains the relatively steep increase in the net marginal tax rate on working
at age 45 at high earning levels.
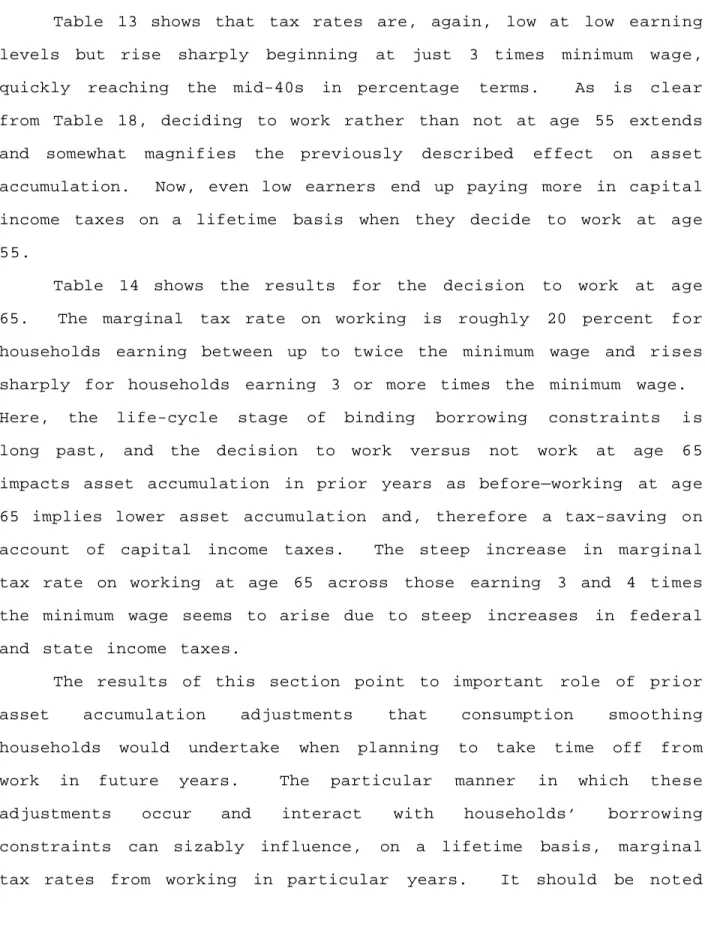
Table 13 shows that tax rates are, again, low at low earning levels but rise sharply beginning at just 3 times minimum wage, quickly reaching the mid-40s in percentage terms. As is clear from Table 18, deciding to work rather than not at age 55 extends and somewhat magnifies the previously described effect on asset accumulation. Now, even low earners end up paying more in capital income taxes on a lifetime basis when they decide to work at age 55.
Table 14 shows the results for the decision to work at age 65. The marginal tax rate on working is roughly 20 percent for households earning between up to twice the minimum wage and rises sharply for households earning 3 or more times the minimum wage. Here, the life-cycle stage of binding borrowing constraints is long past, and the decision to work versus not work at age 65 impacts asset accumulation in prior years as before—working at age 65 implies lower asset accumulation and, therefore a tax-saving on account of capital income taxes. The steep increase in marginal tax rate on working at age 65 across those earning 3 and 4 times the minimum wage seems to arise due to steep increases in federal and state income taxes.
The results of this section point to important role of prior
asset accumulation adjustments that consumption smoothing
households would undertake when planning to take time off from work in future years. The particular manner in which these
adjustments occur and interact with households’ borrowing
constraints can sizably influence, on a lifetime basis, marginal tax rates from working in particular years. It should be noted
that ESPlanner does not take into account the possibility of adjusting prior year’s labor supplies when planning to work/quit work in the future. In general, the decision to work or not in any future year potentially involves dynamic interactions with asset accumulation, labor supplies, and borrowing constraints in other years and, hence, can affect marginal work-tax rates in ways that are difficult to model comprehensively.
Sensitivity of Net Full-Time Work Tax Rates to Assumed Discount and Growth Rates
Tables 20 and 21 show how average and marginal net full-time work tax rates are affected by assuming higher and lower discount rates and growth rates than those used in the base-case calculations. As in the base case, we assume that the household’s pre-tax and transfer return to saving is the same as the discount rate and that transfer bracket levels and basic benefits are indexed to the growth rate of real wages.
With the exception of the average net tax rates for low-wage
households, the results are very robust to the alternative
discount and growth assumptions. For example, the average net full-time work tax rate for a household earning five times the minimum wage is 47.2 percent. Using a 3 (7) percent, rather than a 5 percent discount rate, lowers (raises) the average net tax rate to 44.9 (48.4) percent. And assuming a zero (2 percent) rather than a 1 percent growth rate of real wages lowers (raises) the average net tax rate to 47.1 (48.0) percent.
For minimum wage households, the 17.8 percent base-case subsidy rises to 31.7 percent when a 3 percent discount rate is used. With a 7 percent discount rate, the subsidy falls to 14.7
percent. Lowering the wage growth rate to zero rate lowers the subsidy just slightly--to 15.0 percent, whereas raising wage growth to 2 percent raises the subsidy substantially -- to 25.4 percent.
The effects of the discount rate changes on the average net work tax rates of low-wage households are not surprising given that a larger share of lifetime spending of low-wage households consists of non fungible welfare payments, much of which arrive late in life. The sensitivity at the low end of the wage distribution of average net work tax rates to wage growth rates reflects the fact that the federal income tax, including the earned income tax credit, is inflation rather than wage indexed. For low-wage households, higher real wage growth leads to real bracket creep as well as reductions in the earned income tax credit. High wage households aren’t eligible for the earned income tax bracket and aren’t subject to real bracket creep because they are already in the top tax bracket.
The Impact of Policy Changes on Net Full-Time Work Tax Rates
Our final tables, Tables 22 and 23, consider how average and marginal full-time net work tax rates would change in response to the following four policies: 1) a 5 percentage point cut in the payroll tax rate, 2) the elimination of the Social Security earnings ceiling, 3) raising the Social Security payroll tax rate
by 5 percentage points, 4) replacing federal personal and
corporate income taxes with a 25 percent consumption tax levied on final sales, and 5) cutting Social Security benefits immediately and permanently by 25 percent.
Cutting the OASDI payroll tax rate is a key feature of current policy proposals for privatizing Social Security. A 5 percentage point cut in the rate appears to be at the outer limit of what might ultimately be adopted. A comparison of the base-case results presented in column three of Table 22 with the results for this policy experiment shown in column four indicate that a payroll tax of this magnitude would be highly progressive. Because of the ceiling on Social Security taxable earnings, the policy makes little difference to the net tax rates facing the rich, but it does lower the average net tax rates of middle- and low-income households. Take, for example, households earning three times the minimum wage, with initial (age 22) income of $64,300. Their average net tax rate is 40.2 percent in the base case and 34.0 percent under the policy reform. And their marginal net tax rate falls from 52.4 percent to 48.0 percent.
Eliminating Social Security’s Earnings Ceiling
This is another progressive policy. It makes no difference to the average or marginal net taxes of low-wage households, but it raises those of the rich. Households earning 15 times the minimum wage find both their average and marginal net tax rates higher by more than 5 percentage points. For households earning 40 times the minimum wage, the average net tax rate rises by 9.1 percentage points and the marginal rate rises by 8.8 percentage points.
Raising Payroll Taxes
While some policymakers wish to cut payroll taxes in the context of privatizing Social Security, others favor securing the system’s future by raising payroll tax rates. However, Tables 22
and 23 indicate that doing so in the context of a fixed ceiling on Social Security taxable earnings would be highly regressive. The tables consider a 5 percentage point increase in the tax rate. While the policy has a small impact on top earning households, those earning at or just above the minimum wage would bear much higher net tax rates. For a household earning 3 times the minimum wage household, the average net tax rate rises from 40.2 percent to 46.5 percent and their marginal net tax rate rising from 52.4 percent to 57.1 percent.
Switching from Federal Income to Consumption Taxes
The final policy we consider is replacing federal personal and corporate income taxes with a 25 percent retail consumption tax. A 25 percent tax rate appears to be in the neighborhood of what would be needed to maintain revenue neutrality. In considering the regressivity of these results it is important to bear in mind that we are focusing here on households with no initial wealth. Were we to assume that the rich had significant inheritances, the consumption tax would look much more progressive because it taxes consumption spending no matter how financed.
Given that caveat, it’s clear that consumption taxation would raise average tax burdens on the poor and middle class and dramatically lower them for the rich. Households earning twice the minimum wage would find their average net tax rate rising by 1.6 percentage points. In contrast, those earning 10 times the minimum wage would experience a 12 percentage point cut in their average tax rate.
An Immediate and Permanent Cut In Social Security Benefits by 25 Percent
Under current tax and benefit rules, one estimate places the U.S. Social Security System’s present value actuarial imbalance at more than $8 trillion.7 One way to redress this imbalance is via a benefit cut. According to Social Security’s actuaries, the required magnitude of an immediate and permanent Social Security benefit cut would be 25 percent. Our fifth policy explores the implications of this policy on average and marginal net tax rates. Although a 25 percent benefit cut sounds like a large cut on its own, it makes a relatively minor dent in the lifetime spending of the young and middle-aged because it becomes effective several decades in the future. In addition, for relatively low income households---those earning up to 3 times the minimum wage—reduced Social Security benefits trigger higher Medicaid benefits. As a result, such households experience very small increases, if at all, in their average and marginal net tax rates. Households with earnings between 6 and 8 times minimum wage would bear the largest increases in average and marginal net tax rates from this policy. But even for these households, the average and marginal tax-rate changes—about 1 percentage point for both—is much smaller than those arising from some of the other policies considered in Tables 22 and 23.
X. Summary and Conclusion
The U.S. fiscal system is not your father’s Oldsmobile. Thanks to the growth of a variety interrelated of social welfare program, it’s vastly more complicated than it was in the middle of the last century. Understanding how this complexity impacts households requires an intertemporal framework because what one
pays in taxes or receives in benefits in one year may depend more on what happens in other periods than in the year in question.
In using ESPlanner, a life-cycle consumption smoothing model,
to understand lifetime average and marginal net tax burdens, we have included in fine detail every major tax and transfer program affecting American households. What emerges is a picture of a fiscal system that is highly progressive with respect to the average burdens facing very low-wage households. However, the system’s generosity toward the poor extends only to those who are very poor. Low-income and lower middle-income households face significant net tax burdens primarily because the earnings and asset tests of our welfare programs limit their availability to all but the poorest members of society. Another key feature of our fiscal system is it’s roughly 50 percent average net tax rates
imposed on the earnings of upper-income and high-income
households.
While very poor Americans receive subsidies, on net and on average, they nonetheless face very high marginal net taxes on working. Minimum wage workers lose a third of every dollar they earn in net taxes when they decide to work full time. Higher wage workers loose between 51 cents and 57 cents on every dollar earned. In addition, low-wage workers face confiscatory taxes in deciding to switch from working half time to full time. So too do non-working low wage spouses whose partners work full time.
Except for the net tax rates of the poor, average and marginal net tax rates are fairly robust to different discount rate and growth rate assumptions. In contrast, making different assumptions about future fiscal policy can greatly alter both
average and marginal net tax rates at all wage levels. In particular, we find that raising payroll taxes or switching to consumption taxation would be highly regressive, while cutting payroll taxes would be quite progressive.
Finally, we find that working when young can be much more costly from a tax perspective than working when old, especially for workers at the lower end of the wage distribution. The reason is that, if they have time to do it and if they are planned in advance, households will save up for work holidays. In so doing they will raise the taxes they end up paying on capital income at the same time they lower the taxes they pay on their labor earnings. Hence, for such households, the decision to take a year off later in life will have smaller tax consequences than doing so when young.
References
Altig, David, Alan Auerbach, Kent Smetters, and Jan Walliser, “Simulating Fundamental Tax Reform in the U.S.”, forthcoming The American Economic Review, 2001.
Boskin, Michael J., Laurence J. Kotlikoff, Douglas J. Puffert, and John B. Shoven, “Social Security: A Financial Appraisal Across and Within Generations,” National Tax Journal, vol. 40, no.1, March 1987, 19-34.
Bradford, David F., ed., Distributional Analysis of Tax Policy, Washington, D.C.: AEI Press, 1995.
Browning, Edgar K., “Tax Incidence Analysis for Policy Makers,” in
Distributional Analysis of Tax Policy, David Bradford, ed.,
Washington, D.C.: The AEI Press, 1995.
Caldwell, Steven B., Melissa Favreault, Alla Gantman, Jagadeesh
Gokhale, Thomas Johnson, and Laurence J. Kotlikoff, “Social
Security’s Treatment of Postwar Americans,” in Tax Policy and the Economy, James Poterba, ed., 13, 1999, 109-48.
Fullerton, Don and Diane Lim Rogers, “Distribution Effects on a Lifetime Basis,” in Bradford, David F., ed., Distributional Analysis of Tax Policy, Washington, D.C.: AEI Press, 1995, 262-94. Fullerton, Don and Diane Lim Rogers, Who Bears the Lifetime Tax Burden?, Washington, D.C.: The Brookings Institution, 1993.
Gokhale, Jagadeesh and Laurence J. Kotlikoff, “Social Security’s Treatment of Postwar Americans: How Bad Can It Get?” in Martin Feldstein and Jeffrey Liebman ed. The Distributional Aspects of Social Security and Social Security Reform, Chicago: University of Chicago Press, 2002, 207-62.
Hubbard, Glenn R., Jonathan Skinner, and Stephen P. Zeldes, “Precautionary Saving and Social Insurance,” Journal of Political Economy, 103, 2, April 1995, 360-99.
Hurd, Michael D. and John B. Shoven, “The Distributional Impact of Social Security,” in Pensions, Labor, and Individual Choice, David Wise, ed., Chicago, Ill.: University of Chicago Press, 1985.
Myers, Robert J. and Bruce D. Schobel, “An Updated Money’s-Worth Analysis of Social Security’s Retirement Benefits,” Transactions, Society of Actuaries, no. 44, 1993, 247-75.
Pechman, Joseph, “Who Paid the Taxes, 1966-1985,” Washington, D.C.: The Brookings Institution, 1985.
___________, “The Future of the Income Tax,” American Economic Review, March 1990, pp. 1-20.
Poterba, James, “Lifetime Incidence and the Distributional Burden of Excise Taxes,” American Economic Review, May 1989, 325-330.
Appendix
Modeling Taxes and Transfers
This appendix is divided into three sections. Section I discusses our calculation of federal income, payroll, and state income taxes. Section II discusses our calculation of Social Security benefits. And Section III discusses out calculation of non-Social Security benefits.
I. The Calculation of Taxes
The Federal Income Tax
Esplanner’s calculations of federal income taxes in each future
year assumes that the household ‘s filing status is “married and filing jointly” for married households and “single” for single households. “Single” is assumed when spouses of married households are by themselves—as is the case when one spouse outlives the other at the end of the planning horizon or when calculating the financial plan for one of the spouses as a part of a surviving household. All federal income tax calculations are based on the new 2001 tax law, which we assume is not phased out at the end of the decade, but, rather is maintained after 2010 with its 2010 provisions.
All tax calculations are made based on nominal income levels by
converting real pre-tax income amounts to their nominal
counterparts based on the assumed rate of inflation. Thus, if the user inputs a 3 percent inflation rate, all nominal amounts in the user’s federal income tax calculation (such as nominal bracket amounts and nominal exemption amounts) are multiplied by 1.03 percent for purposes of calculating 2002 taxes, by 1.03 times 1.03 for purposes of calculating 2003 taxes, and so on. The federal income tax schedule is applied to the program’s calculation of federal taxable income. Federal taxable income equals federal Adjusted Gross Income (AGI) less personal exemptions and less the standard deduction of the sum of itemized deductions, whichever is larger.
The AGI for each year includes projected incomes in current dollars from several sources. These are: labor income (wages and salaries), self-employment income, asset income projected by the program based on user inputs of initial non-tax-favored net worth and rates of return, and on the optimal spending plan computed by the program. AGI also includes taxable asset income, taxable social security benefits, taxable special receipts, taxable distributions from defined benefit pension plans and taxable withdrawals from tax-favored saving plans. Each of these items is based upon the user’s inputs and preferences. Non-taxable special receipts and withdrawals from Roth IRA accounts are not included in AGI. Deductible contributions to retirement accounts are subtracted from income in calculating each year’s AGI. Employer contributions to retirement accounts are not included in AGI. However, withdrawals from these accounts are included.
The Indexation of the Tax Schedule
Tax-rate brackets and infra-marginal tax amounts (all of the dollar amounts listed in the tax schedules) are adjusted for inflation in each year over the household’s lifetime. This is done to ensure that the schedule keeps pace with the growth of income in current dollars. The indexation is done using the user-specified rate of inflation. The thresholds for taxing Social Security benefits are not indexed for inflation in accordance with current policy.
Standard Deductions and Exemptions
Standard deductions and exemptions are also indexed for inflation for each future year based on the user-specified future rate of inflation. The number of personal exemptions allowed equals 2 plus the number of children for “married and filing jointly” and 1 plus the number of children for the “single” filing statuses.
The personal exemption amount that can be deducted from AGI in calculating taxable income is phased out if AGI is above certain dollar limits depending upon the filing status. ESPlanner takes
into account the phase-out of personal exemptions based on these dollar limits indexed for inflation. The year-by-year phase-in of changes in the phase-out provisions enacted in the 2001 tax reform are included in ESPlanner’s tax calculating code.
The Decision to Itemize
ESPlanner takes the maximum of the standard deduction or sum of
itemized deductions, where the latter includes mortgage interest payments, property taxes, state and local income tax payments, and tax-deductible special deductible expenditures that the user specifies, such as charitable contributions. Note that state and local income tax payments are deductible only if they are being withheld from pay or the user makes estimated tax payments during the tax year. ESPlanner assumes withholding or pre-payment.
The Phase-Out of Itemized Deductions
As modified in the 2001 tax reform, federal income tax rules phase out itemized deductions for high-income taxpayers (both, married filing jointly and single payers). The reduction does not apply to certain components of the itemized deductions claimed—such as medical care expenses, investment interest, and casualty and theft losses. Because ESPlanner does not distinguish between these and
other sources of itemized deductions, the phase-out rules are applied to all itemized deductions.
The Child-Tax Credit
The child-tax credit depends on the number of qualifying children in the household. The tax credit is phased out if AGI is over a threshold, the value of which depends on marital status. The phase-out rate is $50 for each $1000 of income in excess of the applicable threshold. The amount of the child-tax credit equals the smaller of a) the computed amount or b) the federal income tax liability net of the earned income tax credit. If the earned income tax credit exceeds the federal income tax liability, the child-tax credit is applied against payroll taxes.
The Earned Income Tax Credit
The program’s calculation of the earned income tax credit (EITC) adheres to the EITC worksheet in federal Form 1040. ESPlanner
first checks for eligibility to receive the EITC based on a) investment income, b) taxable earned income, c) non-taxable earned income (e.g., employer 401(k) contributions), d) earned income thresholds for households with no qualifying children, and earned income thresholds for households with at least one qualifying child. Next, the EITC is computed based on the EITC schedule for taxable and nontaxable income and the household’s level of adjusted gross income (AGI).
The Taxation of Social Security Benefits
Social Security benefits are included in the federal income-tax base in the following manner. If the sum of AGI and 50 percent of Social Security benefits falls short of a lower threshold, which is marital-status specific, then none of the benefits are taxable. If the sum exceeds the applicable dollar threshold, but the excess is less than a martial-status specific sum, the smaller of one-half of the excess or 50 percent of the benefit is taxable and is included in the federal income tax base. In addition, if the aforementioned excess is greater than the second dollar threshold, 85 percent of this excess or 85 percent of the benefit, whichever is smaller, is also added to the federal income tax base.
The Low Income Tax Credit for Retirement Account Contributions
This non-refundable tax credit was introduced in the 2001 tax law. The credit reimburses X percent of the individual’s first $2,000 in contributions to retirement accounts. The value of X for households with very low incomes is 50 percent, but quickly phases out to zero at higher income levels.
Payroll Taxes
For purposes of this study, ESPlanner’s payroll tax calculator is
modified to incorporate employer-paid payroll taxes. In each year, the payroll tax for a married household is the sum of the two spouses’ payroll taxes. Each spouse’s tax equals the employee plus employer 12.4 percent OASDI tax rate applied to labor earnings up to the taxable maximum level plus the employee plus employer 2.9 percent HI tax rate applied to all labor earnings.
Massachusetts State Income Taxes
Massachusetts taxes labor and interest and dividend income at a 5.95% rate.8 The tax base includes earnings from wages and
salaries, self-employment income, pension income, and
distributions from tax-favored saving accounts, and other taxable receipts such as alimony. Federally taxable Social Security benefits are not included. A rental deduction, available to both single and joint filers, is allowed up to 50 percent of rent paid on one’s principal residence or $2,500, whichever is smaller. A single $1,200 deduction is allowed for dependent children under the age of 12. Capital gains are taxed at a lower rate, but this feature of the Massachusetts tax code is not explicitly modeled.
8
We ignore scheduled future reductions in Massachusetts income tax rates from 5.95 percent to 5.0 percent. Given the current fiscal crisis in
II. The Calculation of Social Security Benefits
Social Security Retirement Benefits
Eligibility
Before ESPlanner provides household heads and spouses Social
Security retirement benefits, it checks that they are fully
insured. Individuals must be fully insured to receive retirement
benefits based on their earnings records. Becoming fully insured
requires sufficient contributions at a job (including
self-employment) covered by Social Security. For those born after 1929,
acquiring 40 credits prior to retirement suffices for fully
insured status. Earnings between 1937 and 1951 are aggregated and divided by $400, and the result (rounded down to an integer number) are the pre-1952 credits which are added to the credits earned after 1950 in determining insured status. After 1951, workers earn one credit for each quarter of the year they work in Social Security-covered employment and earn above a specified minimum amount. The year of first eligibility for retirement
benefits is the year in which the individual becomes age 62. The individual is entitled to retirement benefits after an application
for benefits is submitted, but never before age 62. Determination of Primary Insurance Amount (PIA)
The PIA is the basis for all benefit payments made on a worker’s earnings record. There are several steps in computing the PIA.
Base years are computed as the years after 1950 up to the first
month of entitlement to retirement benefits begins. For survivor benefits, base years include the year of the worker's death.
Elapsed Years
Elapsed years are computed as those years after 1950 (or after attainment of age 21, whichever occurs later) up to (but not including) the year of first eligibility. The maximum number of elapsed years for an earnings record is 40 (it could be shorter, for purposes of calculating survivor benefits if the person dies prior to age 62).
Computation Years
Computation years are calculated as the number of elapsed years less five or 2, whichever is the greater. Earnings in base years (up to the maximum taxable limit in each year, and through age 60 or two years prior to death, whichever occurs earlier) are wage-indexed according to economy-wide average wages. Of these, the highest earnings in years equaling the number of computation years are added together and the sum is divided by the number of months in computation years to yield Average Indexed Monthly Earnings (AIME).
Bend Points
The AIME is converted into a PIA using a formula with bend points.
The bend point formula is specified as 90 percent of the first X dollars of AIME plus 32 percent of the next Y dollars of AIME plus 15 percent of the AIME in excess of Y dollars. The dollar amounts X and Y are also wage indexed and are different for different eligibility years. The dollar amounts pertaining to the year of