University of Nebraska - Lincoln
DigitalCommons@University of Nebraska - Lincoln
Cornhusker Economics
Agricultural Economics Department
2015
2015 Nebraska Farmland Values and Rental Rates
Jim Jansen
University of Nebraska-Lincoln, jjansen4@unl.edu
Roger Wilson
University of Nebraska-Lincoln, rwilson6@unl.edu
Follow this and additional works at:
http://digitalcommons.unl.edu/agecon_cornhusker
This Article is brought to you for free and open access by the Agricultural Economics Department at DigitalCommons@University of Nebraska Lincoln. It has been accepted for inclusion in Cornhusker Economics by an authorized administrator of DigitalCommons@University of Nebraska -Lincoln.
Jansen, Jim and Wilson, Roger, "2015 Nebraska Farmland Values and Rental Rates" (2015).Cornhusker Economics. 733.
~
AGRICULTURAL ECONOMICS
~
.
Institute of
A
griculture and
N
atural R
es
ources
June
24, 2015
agecon.u n I.ed uj cornh uskereconom ics
Cornhusker Economics
2015 Nebraska Farmland Values and Rental Rates
Market Report
Lil!esiock aDd ~rodycls,
Weekly AYerage
Nebraska Slaughter Steers, 35-65% Choice, Live Weight ... Nebraska Feeder Steers,
Med. & Large Frame, 550-600 lb ... Nebraska Feeder Steers,
Med. & Large Frame 750-800 lb ... Choice Boxe d Beef,
600-750 lb. Carcass ... Western Corn Belt Base Hog Price Carca ss, Ne gotiated ... Pork Ca rcass Cuto ut, 185 lb. Ca rcass 51-52% Lean ... Slaughter Lambs, wooled and shorn, 135-165 lb. National. ... National Carcass Lamb Cutout FOB ...
~
Daily Spoi Prices
Wheat, No.1, H.W.
Imperial, bu ... Corn, No.2, Yellow
Nebraska City, bu •...
Soybeans, No.1, Yellow
Nebraska City, bu ...
Grain Sorghum, No.2, Yellow Dorchester, cwt ...• Oats, No.2, Heavy
Minneapolis, Mn, bu ...•••... fnJI
Alfalfa, La rg e Squ are Ba les, Good to Premium, RFV 160-185 Northeast Nebraska, ton ....••... Alfalfa, Large Rounds, Good Platte Valley, ton ... Grass Hay, Large Rounds, Good
Ne bra ska, ton ... Dried Distillers Grains, 10% Moisture Nebraska Average .•... Wet Distillers Grains, 65-70% Moisture Nebraska Average ...
*
No MarketI
Year 4Wks Ago Ago 149.15 160.00 254.00 289.49 207.17 227.24 238.39 263.19 120.03 78.16 124.66 84.86 154.75 146.30 359.20 356.28 6.56 4.93 4.43 3.45 14.05 8.99 7.73 6.88 3.80 2.77 193.75 190.00*
*
100.00 120.00 145.00 170.50 52.00 52.00I
6-19-15 150.00 288.28 240.46 249.87 75.57 83.59 153.86 349.15 4.50 3.43 9.57 6.84 2.79*
*
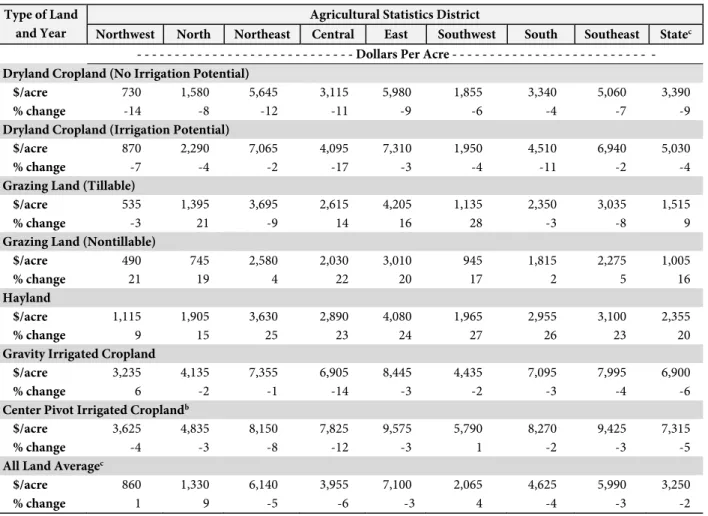
130.00 129.00 45.50Nebraska agricultural land values have declined
two percent according to the recently published
Nebraska Farm Real Estate Market Highlights
2014-2015 report. As of February 1, 2015, the
weighted average farmland value for the state
dropped over the prior 12-month period to
$3,250 per acre (Figure 1 and Table
1).
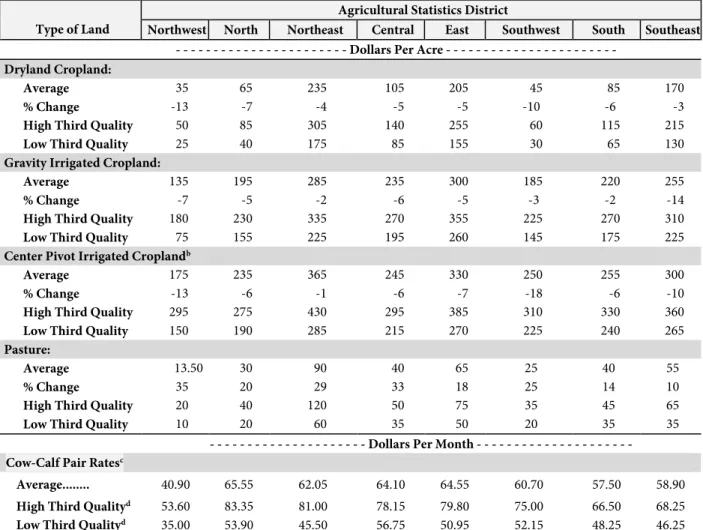
Cash
rental rates for land in 2015 followed trends
comparable to 2014 as irrigated and dryland
cropland rental rates declined while pasture and
cow-calf pair rental rates rose across Nebraska
(Table 2).
Survey panel members indicated current crop
prices and farm input costs as the most negative
factors leading to a reduction in cash rental rates
for cropland. Current livestock prices were
not-ed as the most positive factor leading to higher
pasture and cow-calf pair rental rates in
Nebras-ka. Property tax levels and future property tax
policies were also listed as negative factors
im-pacting area land values in Nebraska for 2015.
Since February 1, 2014, the largest percent
in-crease in land value for Nebraska reported by
survey participants occurred in hayland and
nontillable grazing land at 20 and 16 percent
re-spectively. Like 2014, part of the reason for these
increases relates to cattle prices remaining near
record levels in 2015. The increase in price for
these two land classes varied across Nebraska.
It is the policy of the University of Nebraska-Lincoln not to discriminate based upon age, race,
ethn icity, color, national origin, gender -iden tity, sex, pregnan
cy,
disabili ty, sexual orien ta tion,genetic information, veteran's status, marital status, religion or political affiliation.
N
~IV
E
R
SITY
1
~
eUtas1\d
c-Table 1. Average Reported Value of Nebraska Farmland for Different Land Types and Sub-State
Regions, February 1, 2015
aType of Land
and Year Northwest North Northeast Central Agricultural Statistics District East Southwest South Southeast Statec
- - - Dollars Per Acre - - - - Dryland Cropland (No Irrigation Potential)
$/acre 730 1,580 5,645 3,115 5,980 1,855 3,340 5,060 3,390
% change -14 -8 -12 -11 -9 -6 -4 -7 -9
Dryland Cropland (Irrigation Potential)
$/acre 870 2,290 7,065 4,095 7,310 1,950 4,510 6,940 5,030
% change -7 -4 -2 -17 -3 -4 -11 -2 -4
Grazing Land (Tillable)
$/acre 535 1,395 3,695 2,615 4,205 1,135 2,350 3,035 1,515
% change -3 21 -9 14 16 28 -3 -8 9
Grazing Land (Nontillable)
$/acre 490 745 2,580 2,030 3,010 945 1,815 2,275 1,005
% change 21 19 4 22 20 17 2 5 16
Hayland
$/acre 1,115 1,905 3,630 2,890 4,080 1,965 2,955 3,100 2,355
% change 9 15 25 23 24 27 26 23 20
Gravity Irrigated Cropland
$/acre 3,235 4,135 7,355 6,905 8,445 4,435 7,095 7,995 6,900
% change 6 -2 -1 -14 -3 -2 -3 -4 -6
Center Pivot Irrigated Croplandb
$/acre 3,625 4,835 8,150 7,825 9,575 5,790 8,270 9,425 7,315
% change -4 -3 -8 -12 -3 1 -2 -3 -5
All Land Averagec
$/acre 860 1,330 6,140 3,955 7,100 2,065 4,625 5,990 3,250
% change 1 9 -5 -6 -3 4 -4 -3 -2 Source: a UNL Nebraska Farm Real Estate Market Surveys, 2014 and 2015.
b Value of pivot not included in per acre value. c Weighted averages.
Table 2. Reported Cash Rental Rates for Various Types of Nebraska Farmland and Pasture: 2015
Averages, Percent Change from 2014 and Quality Ranges by Agricultural Statistics
District
aType of Land Northwest North NortheastAgricultural Statistics District Central East Southwest South Southeast - - - Dollars Per Acre - - -
Dryland Cropland:
Average 35 65 235 105 205 45 85 170
% Change -13 -7 -4 -5 -5 -10 -6 -3
High Third Quality 50 85 305 140 255 60 115 215
Low Third Quality 25 40 175 85 155 30 65 130
Gravity Irrigated Cropland:
Average 135 195 285 235 300 185 220 255
% Change -7 -5 -2 -6 -5 -3 -2 -14
High Third Quality 180 230 335 270 355 225 270 310
Low Third Quality 75 155 225 195 260 145 175 225
Center Pivot Irrigated Croplandb
Average 175 235 365 245 330 250 255 300
% Change -13 -6 -1 -6 -7 -18 -6 -10
High Third Quality 295 275 430 295 385 310 330 360
Low Third Quality 150 190 285 215 270 225 240 265
Pasture:
Average 13.50 30 90 40 65 25 40 55
% Change 35 20 29 33 18 25 14 10
High Third Quality 20 40 120 50 75 35 45 65
Low Third Quality 10 20 60 35 50 20 35 35
- - - Dollars Per Month - - - Cow-Calf Pair Ratesc
Average... 40.90 65.55 62.05 64.10 64.55 60.70 57.50 58.90
High Third Qualityd 53.60 83.35 81.00 78.15 79.80 75.00 66.50 68.25
Low Third Qualityd 35.00 53.90 45.50 56.75 50.95 52.15 48.25 46.25
Source: a Reporters’ estimated cash rental rates (both averages and ranges) from the UNL Nebraska Farm Real Estate Market
Survey, 2014 and 2015.
b Cash rents on center pivot land assumes landowners own total irrigation system.
c A cow-calf pair is typically considered to be 1.25 to 1.30 animal units (animal unit being 1,000 lb. animal). However,
this can vary depending on weight of cow and age of calf.