Summary
Th e objective of this study was to investigate the relationship between somatic cell score (SCS) and milk yield in diff erent stages of lactation for cows in diff erent parities. Records between June 2003 and January 2014 from 209,781 cows in lactations one to nine in 845 herds, comprising 2,500,407 monthly test-day (TD) records extracted from the animal breeding center, were used. Th e MIXED procedure of SAS soft ware was used to investigate the eff ect of SCS on milk yield in diff erent stages of lactation. Defi ned model considered herd, year-season of calving, month of TD, weeks in lactation and previous dry period length as fi xed eff ects and calving age and SCS as covariate. Lactations were divided into six stages and analyses were performed within each stage. Also, diff erent lactations were analyzed separately. Th e amount of daily milk yield loss associated with increased SCS was higher with increased number of parity and also later in lactation (especially aft er peak in week nine). Th e regression coeffi cient for milk yield on SCS was -0.539 to -0.635 in diff erent stages of lactation in fi rst parity cows, while that was between -0.777 to -1.053 in third lactation cows. Key words
somatic cell score, calving age, dry period length, regression coeffi cient, stage of lactation
Eff ect of Somatic Cell Count on Milk
Yield in Diff erent Parities and Stages of
Lactation in Holstein Cows of Iran
Arash CHEGINI
Navid GHAVI HOSSEIN-ZADEH
( )Hossein HOSSEINI-MOGHADAM
Abdol Ahad SHADPARVAR
Department of Animal Science, Faculty of Agricultural Sciences, University of Guilan, P.O.Box: 41635-1314, Rasht, Iran
e-mail: nhosseinzadeh@guilan.ac.ir, navid.hosseinzadeh@gmail.com
Introduction
Dairy cattle breeding policies are mainly focused on milk production traits in Iran. Although these traits are of primary economic importance, functional traits such as udder health and productive life are of greater interest to producers to im-prove the herd profi tability. Mastitis is one of the major diseases in dairy cows and leads to economic losses, mainly arising from discarded milk, reduced milk production and quality, and in-creased health care costs in dairy cows (Wellenberg et al., 2002). Selecting for increased resistance to mastitis can be done directly or indirectly. Direct selection needs the diagnosis of the infec-tion and indirect selecinfec-tion corresponds to use of indicator traits or criterion related to mastitis. Among the measures, the most frequently used to detect mastitis are milk somatic cell count (SCC) (Shook and Schutz, 1993; Mrode and Swanson, 1996) and had been used to estimate the reduction in milk yield associated with mastitis (Ali and Shook, 1980; Raubertas and Shook, 1982; Rajčevič et al., 2003).
A good estimate of milk yield reduction due to increase in SCC can be an incentive for breeding specialists to consider the detrimental eff ect of disease and to establish appropriate selec-tion programs with balanced weights for mastitis. With some exceptions (Dürr et al., 2008; Hagnestam-Nielsen et al., 2009), most estimates of milk yield losses associated with SCS have been derived from lactation averages. Miller et al. (2004) reported a decrease in 305-day milk yield of 54.6 kg and 61.4 kg per somat-ic cell score unit increase on the fi rst test-day for the fi rst and second parities, respectively. In a review by Hortet and Seegers (1998), the estimated lactation milk loss was found to vary be-tween 0 and 9.5% across parities for cows developing clinical mastitis. Th e amount of milk losses associated with mastitis is depended on when in lactation the cow is diseased (Lucey et al., 1986; Rajala-Schultz et al., 1999; Hagnestam et al., 2007). Since mastitis and SCS are highly correlated, in order to obtain ac-curate estimates stage of lactation should be taken into consid-eration when studying association between milk yield and SCS. Th erefore, the objective of this study was to investigate the re-lationship between somatic cell count and milk yield per parity and stage of lactation in Holstein cows of Iran.
Material and methods
Records between June 2003 and January 2014 from 209,781 cows in lactation one to nine in 845 herds, comprising 2,500,407
monthly test-day (TD) records extracted from the animal breeding center of Iran, Karaj, were included in dataset. Cows were kept in intensive production systems and fed manually throughout the year with alfalfa hay, corn silage and wheat straw as forages and a mixture of barley grain, corn grain, soybean meal, whole cottonseed, cottonseed meal, canola meal, wheat bran, corn gluten and beet pulp and vitamin and mineral premix as con-centrate. In most of herds, cows were housed in covered barns with concrete fl oors and free stalls and, in herds with medium to large sizes, were grouped regarding to the stage of lactation, production and pregnancy status.
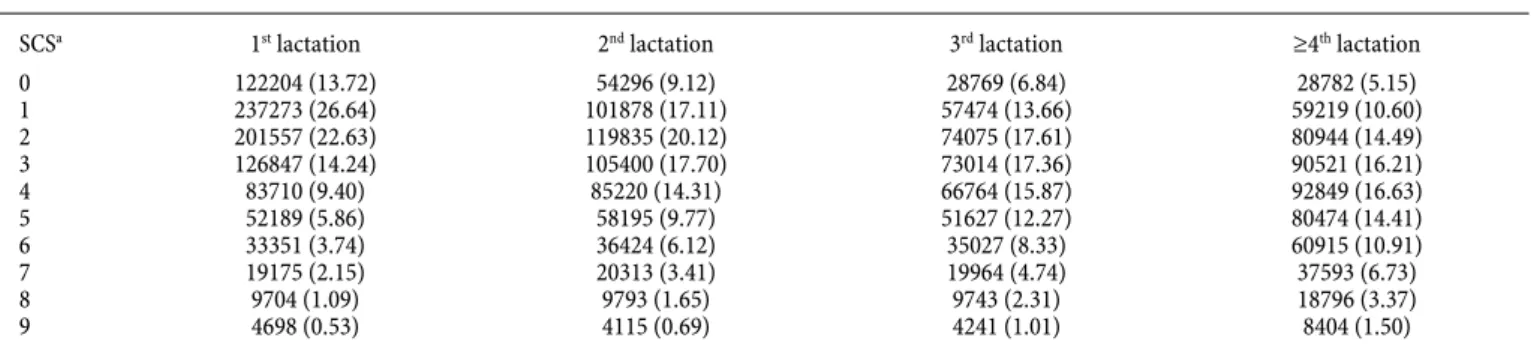
Th e dataset fi le included animal ID, herd, calving date, parity, calving age, test-day milk and somatic cell count, test-dates, and dates of drying off . Records between days 5 to 305 DIM were included. Daily milk yields less than 8 kg were deleted, because these represent a recording error or a sick cow. Only animals with fi ve or more test-day records were included. Somatic cell count was transformed to SCS. Number and percent of data in diff erent SCS classes in diff erent lactations are shown in Table 1. Calving age was calculated as a date of calving minus date of birth. Also, dry period length was calculated as the date of present calving subtracted from date of pervious dry off . Months of calving were grouped into four seasons: April through June (season 1 = spring), July through September (season 2 = summer), October through December (season 3 = fall), and January through March (season 4 = winter). Only herds with three milking times per 24 h were included. According to a study by Hagnestam-Nielsen et al. (2009) that reported dividing lactation to six stages resulted in better model fi t, lactations were divided into six stages (wk 1 to 2, 3 to 8, 9 to 16, 17 to 24, 25 to 32, and 33 to 44) and analy-ses were performed within each stage. Also, dry period length of cows was grouped into 14 classes: 0-10 (class 1), 11-20 (class 2), 21-30 (class 3), 31-40 (class 4), 41-50 (class 5), 51-60 (class 6), 61-70 (class 7), 71-80 (class 8), 81-90 (class 9), 91-100 (class 10), 101-110 (class 11), 111-120 (class 12), 121-130 (class 13) and > 130 (class 14). Weeks in lactation were divided into 19 class-es (records collected within the fi rst 8 weeks of lactation were grouped into weekly intervals, records from week 9 to 16 were grouped into 2-weeks periods, and records taken later than 17 weeks aft er calving were grouped into 4-weeks periods). Th e MIXED procedure of SAS soft ware (SAS Inst., 2002) was used to investigate the eff ect of SCS on milk yield in diff erent stages of lactation with the following model:
Table 1. Number (percent) of test-day records in diff erent SCS’s class in diff erent lactations
SCSa 1st lactation 2nd lactation 3rd lactation ≥4th lactation
0 122204 (13.72) 54296 (9.12) 28769 (6.84) 28782 (5.15) 1 237273 (26.64) 101878 (17.11) 57474 (13.66) 59219 (10.60) 2 201557 (22.63) 119835 (20.12) 74075 (17.61) 80944 (14.49) 3 126847 (14.24) 105400 (17.70) 73014 (17.36) 90521 (16.21) 4 83710 (9.40) 85220 (14.31) 66764 (15.87) 92849 (16.63) 5 52189 (5.86) 58195 (9.77) 51627 (12.27) 80474 (14.41) 6 33351 (3.74) 36424 (6.12) 35027 (8.33) 60915 (10.91) 7 19175 (2.15) 20313 (3.41) 19964 (4.74) 37593 (6.73) 8 9704 (1.09) 9793 (1.65) 9743 (2.31) 18796 (3.37) 9 4698 (0.53) 4115 (0.69) 4241 (1.01) 8404 (1.50) a 0: 0-17,000 (cell/ml), 1: 18,000-34,000, 2: 35,000-70,000, 3: 71,000-140,000, 4: 141,000-282,000, 5: 283,000-565,000, 6: 566,000-1,130,000, 7: 1,131,000-2,262,000, 8: 2,263,000-4,525,000, 9: 4,526,000-and above.
TD milk yield = animal number + herd + year-season of calv-ing + month of TD + calvcalv-ing age + weeks in lactation + previ-ous dry period length + SCS.
Fixed eff ects were: herd, year-season of calving, month of TD, weeks in lactation, previous dry period length and SCS, and covariate was calving age. Animal number was considered as subject and the type of structure was defi ned for an autoregres-sive model. Th e subject defi nes the variable on which repeated measurements were taken and autoregressive model assumes that with greater distance between periods, correlations are smaller. Also, REG procedure was used to quantify amount of milk loss per each increase in SCS within each stage.
Results
Average of daily milk yield and days in milk in fi rst, second, third and ≥fourth lactation cows were 32.93 kg, 36.08 kg, 36.72 kg and 35.20 kg, and 148.52 days, 148.04 days, 147.70 days and 146.16 days, respectively. Also, mean of SCS in fi rst, second, third and ≥fourth lactation cows were 2.325, 2.965, 3.366 and 3.798. Table 1 shows the number of records in diff erent SCS’s classes in diff erent lactations.
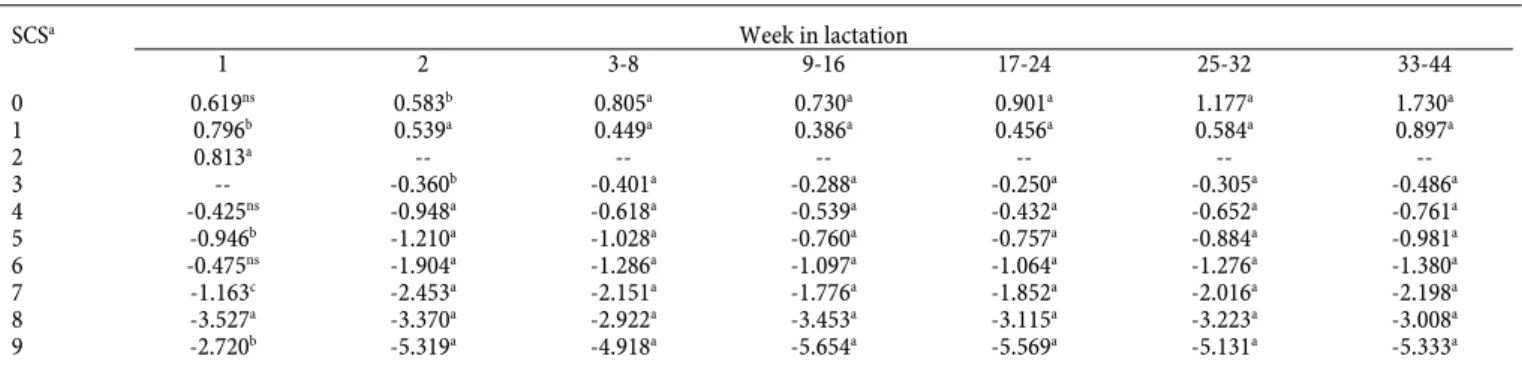
Milk yield losses associated with SCS's in diff erent stages of lactation in lactation 1 to ≥4 are shown in Tables 2 to 5. Th ere was a reduction in daily milk yield with increase of SCS in all lactations, and parity and stage of lactation aff ected the amount of reduction. For primiparous cows the range of daily milk yield deviation was from +0.619 kg for an SCS of 0 to -2.720 kg for an SCS of 9 in comparison with SCS of 3 in week 1. At the end of the lactation (week 33-44), however, the range of daily milk yield deviation for primiparous cows was from +1.730 kg for an SCS of 0 to -5.333 kg for an SCS of 9 in comparison with SCS of 2. For ≥4 lactation cows the range of daily milk yield devia-tion was from -0.447 kg for an SCS of 0 to -7.337 kg for an SCS of 9 in comparison with SCS of 3 in week 1. At the end of the lactation (week 33-44), however, the range of daily milk yield deviation for these cows was from +0.502 kg for an SCS of 0 to -7.905 kg for an SCS of 9 in comparison with SCS of 2. Also, re-gression coeffi cients of milk yield on SCS in diff erent stages of lactation, based on test-day records, in fi rst, second, third and ≥ fourth lactations are shown in Table 6. Th e increase in SCS leads to decrease in milk yield that was higher in later parts of lactation relative to early lactation. Th e regression coeffi cients of
Table 2. Milk yield losses associated with diff erent SCS's in diff erent stages of lactation in fi rst lactation cows (expressed as deviation in comparison with milk yield at SCS of 3 in fi rst week of lactation and SCS of 2 in rest of lactation; 890,708 test-day records for 120,149 animals from 759 herds with 43 levels for YS of calving)
Table 2. Milk yield losses associated with diff erent SCS's in diff erent stages of lactation in second lactation cows (expressed as deviation in comparison with milk yield at SCS of 3 in fi rst week of lactation and SCS of 2 in rest of lactation; 595,469 test-day records for 79,755 animals from 638 herds with 43 levels for YS of calving)
SCSa Week in lactation 1 2 3-8 9-16 17-24 25-32 33-44 0 0.619ns 0.583b 0.805a 0.730a 0.901a 1.177a 1.730a 1 0.796b 0.539a 0.449a 0.386a 0.456a 0.584a 0.897a 2 0.813a -- -- -- -- -- -- 3 -- -0.360b -0.401a -0.288a -0.250a -0.305a -0.486a 4 -0.425ns -0.948a -0.618a -0.539a -0.432a -0.652a -0.761a 5 -0.946b -1.210a -1.028a -0.760a -0.757a -0.884a -0.981a 6 -0.475ns -1.904a -1.286a -1.097a -1.064a -1.276a -1.380a 7 -1.163c -2.453a -2.151a -1.776a -1.852a -2.016a -2.198a 8 -3.527a -3.370a -2.922a -3.453a -3.115a -3.223a -3.008a 9 -2.720b -5.319a -4.918a -5.654a -5.569a -5.131a -5.333a a 0: 0-17,000 (cell/ml), 1: 18,000-34,000, 2: 35,000-70,000, 3: 71,000-140,000, 4: 141,000-282,000, 5: 283,000-565,000, 6: 566,000-1,130,000,
7: 1,131,000-2,262,000, 8: 2,263,000-4,525,000, 9: 4,526,000-and above. a,b,c,d: p < 0.001, p < 0.01, p < 0.05, p < 0.1, respectively; ns: non-significant.
SCSa Week in lactation 1 2 3-8 9-16 17-24 25-32 33-44 0 0.289ns 0.991a 1.409a 1.308a 1.539a 1.675a 1.521a 1 0.988c 0.620a 0.585a 0.626a 0.954a 0.923a 1.075a 2 0.962b -- -- -- -- -- -- 3 -- -0.864a -0.132ns -0.260a -0.661a -0.991a -1.379a 4 -1.783a -0.756a -0.478a -0.431a -0.920a -1.730a -2.564a 5 -1.553a -1.406a -0.660a -0.898a -1.413a -2.085a -3.429a 6 -2.163a -1.942a -1.394a -1.401a -2.110a -2.715a -4.083a 7 -4.440a -2.304a -2.518a -2.620a -2.991a -3.471a -4.399a 8 -4.710a -4.493a -3.951a -4.206a -4.266a -4.845a -5.181a 9 -5.675b -4.755a -6.514a -7.970a -7.752a -7.597a -7.540a a 0: 0-17,000 (cell/ml), 1: 18,000-34,000, 2: 35,000-70,000, 3: 71,000-140,000, 4: 141,000-282,000, 5: 283,000-565,000, 6: 566,000-1,130,000,
milk yield on SCS ranged from -0.565 to -0.635 for primiparous cows and from -0.626 to -1.053 for multiparous cows.
Discussion
Multiparous cows had higher SCS. It has been shown that parity has a signifi cant eff ect on SCC (Olde Riekerink et al., 2007; Chegini, 2010) and multiparous cows have higher SCC.
Milk yield deviation associated with SCS’s was from +0.619 kg to -5.333 kg for primiparous cows and from -0.447 kg to -7.905
kg for multiparous cows. Th e corresponding fi gures estimated by Jones et al. (1983) were from 0.73 kg to -3.64 kg for fi rst lacta-tion cows and from 1.77 kg to -5.61 kg for later lactalacta-tions. Haile-Mariam et al. (2001) conducted a study to estimate genetic and environmental correlations between test-day yield traits and SCC using a random sire model. Th ey reported higher absolute values for genetic and environmental correlation between milk yield and SCC in later stages of lactation relative to earlier stages of lactation. Hortet et al. (1999) suggested that udder infection can Table 4. Milk yield losses associated with diff erent SCS's in diff erent stages of lactation in third lactation cows (expressed as deviation in comparison with milk yield at SCS of 3 in fi rst week of lactation and SCS of 2 in rest of lactation; 436,209 test-day records for 57,963 animals from 617 herds with 43 levels for YS of calving)
Table 5. Milk yield losses associated with diff erent SCS's in diff erent stages of lactation in ≥fourth lactation cows (expressed as deviation in comparison with milk yield at SCS of 3 in fi rst week of lactation and SCS of 2 in rest of lactation; 578,021 test-day records for 53,321 animals from 610 herds with 43 levels for YS of calving)
Table 6. Linear regression coeffi cients of milk yield on SCS in diff erent stages of lactation in diff erent lactation cows, based on test-day records SCSa Week in lactation 1 2 3-8 9-16 17-24 25-32 33-44 0 2.367b 1.222a 1.537a 1.434a 1.681a 1.527a 1.116a 1 0.873ns 0.338ns 0.774a 0.613a 1.014a 0.931a 0.683a 2 0.125ns --- --- --- --- --- --- 3 --- -1.256a -0.203d -0.524b -0.801a -1.127a -1.556a 4 -0.576ns -1.028a -0.712a -0.726a -1.081a -1.959a -2.773a 5 -1.156c -1.807a -1.014a -1.281a -1.671a -2.549a -3.933a 6 -1.550b -1.943a -1.704a -2.169a -2.291a -3.139a -4.710a 7 -2.306b -3.353a -3.077a -3.218a -3.541a -4.169a -5.580a 8 -2.709c -4.582a -4.595a -5.383a -5.041a -5.675a -6.723a 9 -7.680a -7.251a -7.167a -8.677a -8.708a -8.070a -8.152a a 0: 0-17,000 (cell/ml), 1: 18,000-34,000, 2: 35,000-70,000, 3: 71,000-140,000, 4: 141,000-282,000, 5: 283,000-565,000, 6: 566,000-1,130,000,
7: 1,131,000-2,262,000, 8: 2,263,000-4,525,000, 9: 4,526,000-and above. a,b,c,d: p < 0.001, p < 0.01, p < 0.05, p < 0.1, respectively; ns: non-significant.
SCSa Week in lactation 1 2 3-8 9-16 17-24 25-32 33-44 0 -0.447ns 0.671d 1.389a 1.343a 1.638a 1.389a 0.502b 1 -0.394ns 0.518c 0.781a 0.524a 0.938a 1.047a 0.676a 2 0.071ns --- --- --- --- --- --- 3 --- -0.961a -0.242c -0.240b -0.595a -0.963a -1.086a 4 -0.932c -0.904a -0.648a -0.670a -1.041a -1.751a -2.299a 5 -1.793a -0.970a -1.071a -1.460a -1.770a -2.347a -3.395a 6 -1.616b -1.660a -1.913a -2.029a -2.361a -3.193a -4.287a 7 -2.625a -3.089a -3.343a -3.565a -3.830a -4.305a -5.023a 8 -4.293a -4.119a -5.235a -5.439a -5.724a -5.733a -5.913a 9 -7.337a -6.555a -8.325a -8.892a -8.632a -8.562a -7.905a a 0: 0-17,000 (cell/ml), 1: 18,000-34,000, 2: 35,000-70,000, 3: 71,000-140,000, 4: 141,000-282,000, 5: 283,000-565,000, 6: 566,000-1,130,000,
7: 1,131,000-2,262,000, 8: 2,263,000-4,525,000, 9: 4,526,000-and above. a,b,c,d: p < 0.001, p < 0.01, p < 0.05, p < 0.1, respectively; ns: non-significant.
Parity Week in lactation
1-2 3-8 9-16 17-24 25-32 33-44
1st parity cows -0.565 -0.539 -0.581 -0.577 -0.586 -0.635
2nd parity cows -0.626 -0.725 -0.814 -0.848 -0.889 -0.947
3rd parity cows -0.777 -0.825 -0.937 -0.962 -0.970 -1.053
≥4th parity cows -0.694 -0.919 -0.957 -0.995 -1.005 -0.955
cause permanent grandular damage and this is responsible for higher milk reduction in late lactation. By discarding data of lac-tations preceding by a lactation aff ected by mastitis, Hagnestam-Nielsen et al. (2009) performed an experiment that could test the accuracy of this hypothesis. Th eir results showed that a clinical mastitis in previous lactation could not aff ect milk yield in later lactations. It seems that high SCC can accelerate the degenera-tion of milk secretory cells and the catabolic process. Table 6 shows linear regression coeffi cients of milk yield on SCS in dif-ferent stages of lactation in diff erent lactation cows. Multiparous cows had a higher milk loss with increased SCS. Th is result is in accordance with the results of previous studies (Kennedy et al., 1982; Jones et al., 1983; Hortet et al., 1999; Norman et al., 1999; de los Campos et al., 2006; Hagnestam et al., 2007; Dürr et al., 2008; Rekik et al., 2008; Hagnestam-Nielsen et al., 2009). Th e reports of phenotypic correlation between milk yield and SCC ranged from -0.05 for fi rst parity cows to -0.18 for later parity cows (Kennedy et al., 1982; Norman et al., 1999). In case of di-lution eff ect, using structural equations and considering the re-cursive eff ect of SCS on milk yield, de los Campos et al. (2006) mentioned that the negative eff ect of disease on milk yield cre-ated the negative phenotypic correlation between SCS and milk yield and that a dilution eff ect would not be an important cause of this phenotypic correlation.
It had been demonstrated that fi rst lactation cows have higher persistency (Weller et al., 1987; Gengler, 1996; Chegini, 2010). Th is is because of higher ability of their udder tissues to recover and regenerate secreting cells and better consequence of mam-mary cell death and regeneration in advantage of regeneration. Th erefore, it can be concluded that with increasing number of lactation the eff ect of SCC would be intensifi ed on the rate of secretory cells degeneration and multiparous cows with lower rates suff er more. Investigating on the relationship between milk yield and SCC, Chegini (2010) found a negative genetic corre-lation between milk persistency and diff erent measures of SCC (ranged from -0.11 to -0.42). Also, Haile-Mariam et al. (2003) reported a negative genetic correlation (-0.29) between mean of natural logarithm of SCC with milk persistency.
Contrary to the results of Hagnestam-Nielsen et al. (2009), the weakest association between SCS and daily milk yield was found in lactation week 1 to 2 in all lactations. Since mean of SCC in early lactation is high (most of cows have high SCC in this period), it can be concluded that increase of SCC early in lactation is an intrinsic phenomenon and plays a protective role relative to increase of SCC in later parts of lactation. Th e eff ect of SCC on milk yield is diff erent from the eff ect of mastitis on milk yield. Estimating the regression coeffi cient of milk yield on SCS, Hagnestam-Nielsen et al. (2009) reported that multiparous cows with mastitis event in previous lactation experienced less severe milk loss in present lactation. However, since there was no record for mastitis, we could not include the eff ect of this disease in the model.
Conclusion
Cows in third lactation had the highest daily milk yield and cows in fi rst lactation had the lowest SCS. In all lactations, there was a reduction in daily milk yield with increase of SCS, and parity and stage of lactation aff ected the amount of reduction.
Reduction in milk yield associated with increase of SCS was higher with increase of parity and stage of lactation. Th is re-search is one of the few studies to examine the eff ect of SCS on daily milk yield, using a large dataset.
References
Ali A. K. A., Shook G. E. (1980). An optimum transformation for somatic cell concentration in milk. J. Dairy Sci 63: 487–490. Chegini A. (2010). Genetic and environmental relationship among
milk yield, persistency of milk yield, somatic cell count and calving interval of Holstein cows in Iran. M.Sc. Th esis, University of Guilan, Guilan, Iran.
de los Campos G., Gianola D., Heringstad B. (2006). A structural equation model for describing relationships between somatic cell score and milk yield in fi rst-lactation dairy cows. J. Dairy Sci 89: 4445–4455.
Dürr J. W., Cue R. I., Monardes H. G., Moro-Méndez J., Wade K. M. (2008). Milk losses associated with somatic cell counts per breed, parity and stage of lactation in Canadian dairy cattle. Livest Sci 117: 225–232.
Gengler N. (1996). Persistency of lactation yields: A review. In: Proceeding of International Workshop on Genetic Improvement of Functional Traits in Cattle, Gembloux, Belgium, Interbull Bull, pp. 87–96.
Hagnestam C., Emanuelson U., Berglund B. (2007). Yield losses associated with clinical mastitis occurring in diff erent weeks of lactation. J. Dairy Sci 90: 2260–2270.
Hagnestam-Nielsen C., Emanuelson U., Berglund B., Strandberg E. (2009). Relationship between somatic cell count and milk yield in diff erent stages of lactation. J. Dairy Sci 92: 3124–3133. Haile-Mariam M., Bowman P. G., Goddard M. E. (2001). Genetic
and environmental correlations between test-day somatic cell count and milk yield traits. Livest Prod Sci 73: 1–13.
Haile-Mariam M., Bowman P. G., Goddard M. E. (2003). Genetic and environmental relationships among calving interval, sur-vival, persistency of milk yield and somatic cell count in dairy cattle. Livest Prod Sci 80: 189–200.
Hortet P., Beaudeau F., Seegers H., Fourichon C. (1999). Reduction in milk yield associated with somatic cell counts up to 600 000 cells/ml in French Holstein cows without clinical mastitis. Livest Prod Sci 61: 33–42.
Hortet P., Seegers H. (1998). Calculated milk production losses asso-ciated with elevated somatic cell counts in dairy cows: review and critical discussion. Vet Res 29: 497–510.
Jones G. M., Pearson R. E., Clabaugh G. A., Heald C. W. (1983). Relationship between somatic cell counts and milk production. J. Dairy Sci 67: 1823–1831.
Kennedy B. W., Sethar M. S., Moxley J. E. (1982). Heritability of somatic cell count and its relationship with milk yield and com-position in Holsteins. J. Dairy Sci 65: 843–847.
Lucey S., Rowlands J. G., Russell A. M. (1986). Short-term associa-tions between disease and milk yield of dairy cows. J. Dairy Res 53: 7–15.
Miller R. H., Norman H. D., Wiggans G. R., Wright J. R. (2004). Relationship of test day somatic cell score with test day and lac-tation milk yields. J. Dairy Sci 87: 2299–2306.
Mrode R. A., Swanson G. J. T. (1996). Genetic and statistical prop-erties of somatic cell count and its suitability as an indirect means of reducing the incidence of mastitis in dairy cattle. Anim Breed Abstr 64: 847–857.
Norman H. D., Vanraden P. M., Wright J. R., Smith L. A. (1999). Mathematical representations of correlations among yield traits and somatic cell score on test day. J. Dairy Sci 82: 2205–2211.
Olde Riekerink R. G. M., Barkema H. W., Stryhn H. (2007). Th e eff ect of season on somatic cell count and the incidence of clini-cal mastitis. J. Dairy Sci 90: 1704–1715.
Rajala-Schultz P. J., Grohn Y. T., McCulloch C. E., Guard C. L. (1999). Eff ects of clinical mastitis on milk yield in dairy cows. J. Dairy Sci 82: 1213–1220.
Rajčevič M., Klemen P., Jože L. (2003). Correlations between somatic cells count and milk composition with regard to the season. Agric Conspec Sci 68: 221–226.
Raubertas R. F., Shook G. E. (1982). Relationship between lactation measures of somatic cell concentration and milk yield. J. Dairy Sci 65: 419–425.
Rekik B., Ajili N., Belhani H., Ben Gara A., Rouissi H. (2008). Eff ect of somatic cell count on milk and protein yields and female fer-tility in Tunisian Holstein dairy cows. Livest Sci 116: 309–317. SAS Institute. (2002). SAS/Stat R User’s Guide. Version 9.1, SAS
Institute Inc. Cary, North Carolina, USA.
Shook G. E., Schutz M. M. (1993). Selection on somatic cell score to improve resistance to mastitis in the United States. J. Dairy Sci 77: 648–658.
Wellenberg G. J., van der Poel W. H. M., van Oirschot J. T. (2002). Viral infections and bovine mastitis: a review. Vet Microbiol 88: 27–45.
Weller J. I., Ron M., Bar-Anan R. (1987). Eff ects of persistency and production on the genetic parameters of milk and fat yield in Israeli-Holsteins. J. Dairy Sci 70: 672–680.