by Louis Karsten
December 2018
Thesis presented in partial fulfilment of the requirements for the degree of Master of Engineering Mechanical in the Faculty of Engineering at
Stellenbosch University
Supervisor: Prof Frank Dinter Co-supervisor: Dr Jaap Hoffmann
ii
DECLARATION
By submitting this thesis electronically, I declare that the entirety of the work contained therein is my own, original work, that I am the sole author thereof (save to the extent explicitly otherwise stated), that reproduction and publication thereof by Stellenbosch University will not infringe any third party rights and that I have not previously in its entirety or in part submitted it for obtaining any qualification.
Date: December 2018
Copyright © 2018 Stellenbosch University All rights reserved
iii
Plagiaatverklaring / Plagiarism Declaration
1 Plagiaat is die oorneem en gebruik van die idees, materiaal en ander intellektuele eiendom van ander persone asof dit jou eie werk is.
Plagiarism is the use of ideas, material and other intellectual property of another’s work and to present is as my own.
2 Ek erken dat die pleeg van plagiaat 'n strafbare oortreding is aangesien dit ‘n vorm van diefstal is.
I agree that plagiarism is a punishable offencebecause it constitutes theft.
3 Ek verstaan ook dat direkte vertalings plagiaat is.
I also understand that direct translations are plagiarism.
4 Dienooreenkomstig is alle aanhalings en bydraes vanuit enige bron (ingesluit die internet) volledig verwys (erken). Ek erken dat die
woordelikse aanhaal van teks sonder aanhalingstekens (selfs al word die bron volledig erken) plagiaat is.
Accordingly all quotations and contributions from any source whatsoever (including the internet) have been cited fully. I understand that the
reproduction of text without quotation marks (even when the source is cited) is plagiarism.
5 Ek verklaar dat die werk in hierdie skryfstuk vervat, behalwe waar anders aangedui, my eie oorspronklike werk is en dat ek dit nie vantevore in die geheel of gedeeltelik ingehandig het vir bepunting in hierdie
module/werkstuk of ‘n ander module/werkstuk nie.
I declare that the work contained in this assignment, except otherwise stated, is my original work and that I have not previously (in its entirety or in part) submitted it for grading in this module/assignment or another module/assignment
17180430
Studentenommer / Student number Handtekening / Signature
L Karsten
Voorletters en van / Initials and
surname
iv
Abstract
The Analysis of an Organic Rankine Cycle for Smaller
Concentrated Solar Powered Systems
Louis Karsten
Department of Mechanical and Mechatronic Engineering, Stellenbosch University,
Private Bag X1, Matieland 7602, South Africa
Thesis: MEng (Mech) December 2018
Small-scale energy consumers (500 kWe – 5 MWe), that are situated in off-grid areas are often left reliant on fossil fuels (like diesel generators) to meet their energy needs. The International Energy Association (IEA) however attempts to decarbonise the entire energy system and has set certain goals for the renewable energy sector. Most renewable energy sources offer only intermitted power solutions for small-scale off-grid applications and storing electrical energy for this scale becomes expensive. Concentrated solar power (CSP) can offer a non-intermitted solution by having the added benefit of thermal energy storage (TES). However, the critical barrier to the widespread usage of small-scale CSP is the lack of optimised and economically competitive technology. Steam Rankine cycles are typically integrated with CSP in large-scale applications but the thermodynamic properties of steam however prohibit water being used as suitable working fluid in lower temperature and lower power output applications. The aim of this thesis is therefore to determine whether the integration of an organic Rankine cycle (ORC), with a smaller CSP system can result in a feasible energy solution for off-grid applications.
The first step taken was to determine the technical feasibility of solar integrated organic Rankine cycle (SORC) technology. It was proven feasible by the operation of existing small-scale SORC plants. ORC’s and CSP as separate types of technology are being used in various industries. The integration of CSP with an ORC is however considered an immature technology.
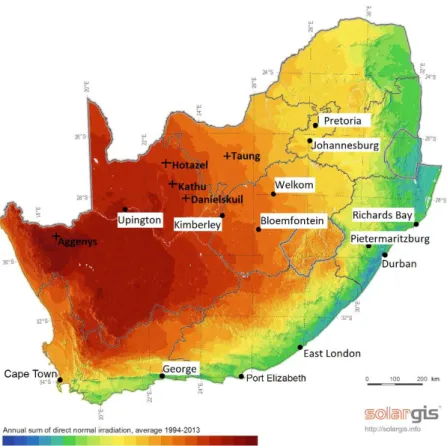
A small-scale application in the higher DNI region of South Africa was identified to use as case study. Black Mountain mine near the town Aggeneys was selected by using a multi criteria decision analysis tool. Even though Black Mountain mine is grid-connected, it is still a viable case study to analyse whether an SORC can be a feasible solution for a mine. In proving so, the proposition then exists to use a SORC for future mining developments in off-grid areas.
A SORC was theoretically analysed by looking at the solar field, TES and power block separately. The theory developed was then combined to create a model for a
v
SORC. The simulation was conducted on MatLab and the design point was resultantly determined at a plant efficiency of 12.8 % and a turbine inlet pressure and evaporating temperature of 2858.8 kPa and 186 °C respectively. The simulation was then expanded to run over a period of one year and a maximum capacity factor of 83 % was recorded. The lowest achievable levelised cost of electricity (LCOE) was 16.7 $c/kWh at a solar multiple (SM) of 1.7 and TES size of 6 hours. The conclusion was reached that SORC’s are economically competitive with diesel generators but cannot solely meet the required energy demand and must therefore utilise auxiliary energy sources.
vi
Uittreksel
Die Analise van ‘n Organiese Rankine Siklus vir die gebruik van
Kleiner Gekonsentreerde Son Aangedrewe Stelsels
Louis Karsten
Departement van Meganiese en Megatroniese Ingenieurswese, Universiteit van Stellenbosch,
Privaatsak X1, Matieland 7602, Suid Afrika
Tesis: MIng (Meg) Desember 2018
Kleinskaalse energie verbruikers (500 kWe – 5 MWe), wat buite elektrisiteitsnetwerkgebiede geleë is, is dikwels afhanklik van fossiel brandstowwe (soos diesel kragopwekkers) om hul energie behoeftes te bevredig. Die Internasionale Energievereniging (IEA) poog egter om die hele energiesisteem te koolstof vry te maak en het sekere doelwitte vir die hernubare energie sektor gestel. Die meeste hernubare energiebronne bied slegs onderbroke kragoplossings vir kleinskaalse buite elektrisiteitsnetwerk toepassings. Die stoor van elektriese energie op hierdie skaal word buitendien ook duur. Gekonsentreerde sonkrag (CSP) kan 'n ononderbroke oplossing bied deur die bykomende voordeel van warmte-energie berging (TES) te hê. Die kritieke beperking vir die wydverspreide gebruik van kleinskaalse CSP is egter die gebrek aan optimale en ekonomies mededingende tegnologie. Stoom Rankine siklusse word tipies geïntegreer met CSP in grootskaalse toepassings, maar die termodinamiese eienskappe van stoom verbied egter dat water as geskikte werkvloeistof in laer temperature en laer kraguitsettoepassings gebruik word. Die doel van hierdie tesis is dus om vas te stel of die integrasie van 'n organiese Rankine-siklus (ORC) met 'n kleiner CSP-stelsel tot 'n haalbare energie-oplossing vir buite elektrisiteitsnetwerk toepassings kan lei.
Die eerste stap is uitgevoer deur die tegniese uitvoerbaarheid van sonkrag-geïntegreerde organiese Rankine-siklus (SORC) tegnologie te bepaal. Die uitvoerbaarheid is bewys deur die bedryf van bestaande kleinskaalse SORC-aanlegte. ORC's en CSP as afsonderlike tipes tegnologie word in verskeie nywerhede gebruik. Die integrasie van CSP met 'n ORC word egter beskou as 'n onvolwasse tegnologie.
'n Kleinskaalse toepassing in die hoër DNI-streek van Suid-Afrika is geïdentifiseer as gevallestudie. Black Mountain myn naby die dorp Aggeneys is gekies met behulp van 'n multi-kriteria besluitanalise instrument. Selfs al is die Black Mountain myn aan die elektrisiteitsnetwerk verbind, is dit steeds 'n
vii
lewensvatbare gevallestudie om te ontleed of 'n SORC 'n haalbare oplossing vir 'n myn kan wees. Sodoende, bestaan die voorstel om 'n SORC te gebruik vir toekomstige ontginningsontwikkelings wat nie aan die elektrisiteitsnetwerk verbind is nie.
'n SORC is teoreties ontleed deur afsonderlik na die sonveld, TES en kragblok te kyk. Die teorie wat ontwikkel is, is dan gekombineer om 'n model vir 'n SORC te skep. Die simulasie is op MatLab uitgevoer en die ontwerppunt is gevolglik bepaal by 'n aanlegsbenuttingsgraad van 12.8 % en 'n turbine inlaatdruk en verdampingstemperatuur van onderskeidelik 2858,8 kPa en 186 °C. Die simulasie is dan uitgebrei om oor 'n tydperk van een jaar te hardloop en 'n maksimum kapasiteitsfaktor van 83 % is aangeteken. Die laagste haalbare gerealiseerde koste van elektrisiteit (LCOE) was 16.7 $c/kWh teen 'n sonveelvoud (SM) van 1.7 en TES grootte van 6 uur. Die gevolgtrekking is gemaak dat SORC's ekonomies mededingend is met dieselgenerators, maar nie alleen in die energie vraag kan voorsien nie en dus bykommende energie hulpbronne moet gebruik.
viii
Acknowledgements
I would like to honour and express my sincere gratitude to the following individuals and organisations for their contribution towards the successful completion of this thesis:
Dr Jaap Hoffmann for his guidance, advice, making it possible to attend a conference abroad and patience in the completion of this thesis.
Prof Frank Dinter for his supervision, guidance and inputs throughout the duration of the thesis.
My family especially my mother and father for their constant encouragement and motivation.
All my friends for their support especially Jan-Louis janse van Vuuren for his engagement in resolving the challenges my studies presented.
The whole of STERG for all the relevant and irrelevant conversations for creating a pleasant working environment.
The financial assistance of the National Research Foundation (NRF) towards this research is hereby acknowledged. Opinions expressed and conclusions arrived at, are those of the author and are not necessarily to be attributed to the NRF.
Most importantly, my Lord and Saviour Jesus Christ, for all things have been created through Him and for Him.
ix
Dedication
“Whatever you do, work at it with all your heart, as working for the Lord, not for human masters, since you know that you will receive an inheritance from the Lord
x
Table of Contents
Abstract ... iv Uittreksel ... vi Acknowledgements ... viii Dedication ... ix Table of Contents ... xList of Figures ... xiv
List of Tables ... xvii
Nomenclature ... xix 1 Introduction ... 1 1.1 Research background ... 1 1.2 Motivation ... 2 1.3 Objectives ... 3 1.4 Thesis layout ... 3 2 Literature Study ... 5 2.1 Introduction to SORC’s... 5 2.1.1 ORC overview ... 5 2.1.2 CSP technology ... 7
2.1.3 Current status of SORC plants ... 9
2.2 SORC technical overview ... 12
2.2.1 Working fluids ... 12
2.2.2 Thermodynamic cycle ... 18
xi
2.3 South African context ... 20
2.3.1 CSP in South Africa ... 20
2.3.2 Possible industries for SORC Plants ... 22
3 Site Selection ... 24
3.1 Industry selection ... 24
3.2 Specific site selection ... 25
4 Theoretical Analysis ... 28
4.1 SORC plant layout ... 28
4.2 Solar field ... 29
4.2.1 Hardware choice ... 29
4.2.2 Solar radiation and tracking ... 30
4.2.3 Thermal analysis of receiver ... 32
4.2.4 Pressure drop analysis ... 43
4.3 Storage ... 45
4.4 Power block ... 47
4.4.1 Working fluid selection ... 47
4.4.2 Power block layout ... 51
4.4.3 Turbine ... 52
4.4.4 Evaporator ... 55
4.4.5 Condenser ... 55
4.4.6 Recuperator ... 56
4.4.7 Pump ... 56
xii
5.1 Design point simulation methodology ... 58
5.2 Input data ... 61
5.3 Results ... 64
5.3.1 Solar field results ... 64
5.3.2 Comparison between working fluids ... 66
5.3.3 Design point conditions ... 67
5.3.4 Sensitivity analysis ... 69
6 Annual Simulation ... 71
6.1 Annual simulation methodology ... 71
6.2 Input data ... 72
6.3 Results and validation ... 74
6.3.1 Capacity factor results ... 74
6.3.2 LCOE results ... 74
6.3.3 Solstices energy production ... 75
6.3.4 Annual simulation validation ... 77
7 Conclusion ... 78
7.1 Discussion of results ... 78
7.2 Recommendations for future work ... 79
7.3 Conclusion... 79
Appendix A: Fluid Properties ... 82
Appendix B: Simulation Flowcharts ... 84
Appendix C: Design Point Validation ... 85
xiii
C.2 Solar field sample calculation ... 86
C.3 Power block results validation ... 92
C.4 Power block sample calculation ... 93
Appendix D: SAM Simulation ... 97
D.2.1 Location and resource ... 97
D.2.2 Solar field ... 97 D.2.3 Collectors (SCA’s) ... 98 D.2.4 Power cycle ... 99 D.2.5 Thermal storage ... 99 D.2.6 Parasitics ... 100 D.2.7 Financial parameters ... 101 References ... 102
xiv
List of Figures
Figure 1: Proposed range of Rankine Cycles, adapted from (Dickes 2016) ... 3
Figure 2: ORC heat resources, adapted from (Southon, 2015) ... 6
Figure 3: ORC output application industries, adapted from (Southon, 2015) ... 6
Figure 4: Total installed capacity per heat source (a) and per manufacturer (b) (Tartière & Astolfi, 2017) ... 6
Figure 5: Main CSP technologies (IEA, 2014) ... 8
Figure 6: ORC plant layout, adapted from (Ojan, 2015). ... 10
Figure 7: ORC Plus pilot plant layout (ORC Plus, 2015) ... 11
Figure 8: T-S diagram of fluids (a) wet, (b) isentropic and (c) dry, (Badr et al., 1985) ... 13
Figure 9: Classification of working fluids according to their temperature ranges, (Vélez et al., 2012) ... 14
Figure 10: Organic Rankine cycle with internal heat exchanger schematic and T-S diagram, (Li, 2016) ... 18
Figure 11: South Africa's national grid development plan 2015-2024, (Eskom, 2014) ... 20
Figure 12: South African DNI map, (GeoSun Africa, 2016) ... 24
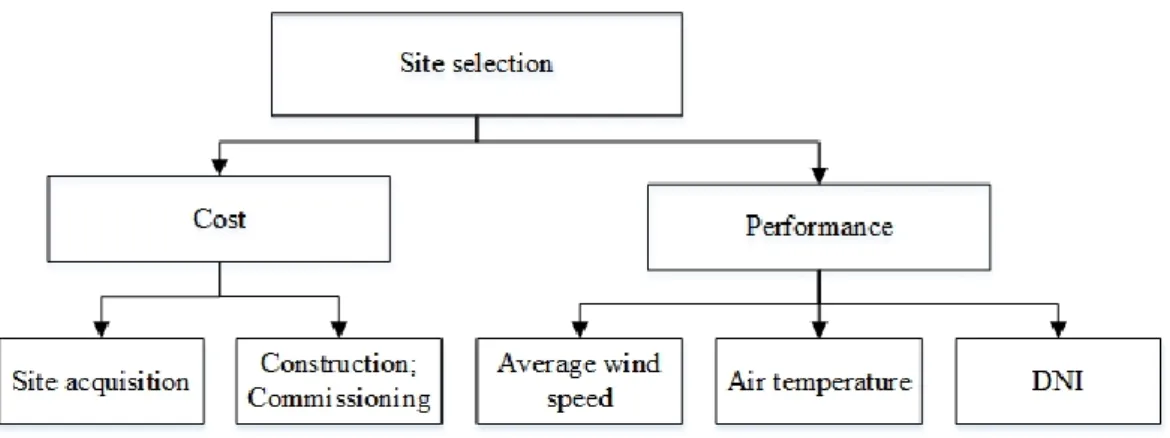
Figure 13: Site selection value tree ... 26
Figure 14: General plant layout (Dickes et al., 2015) ... 28
Figure 15: Central feed layout, adapted from (Lovegrove & Stein, 2012) ... 30
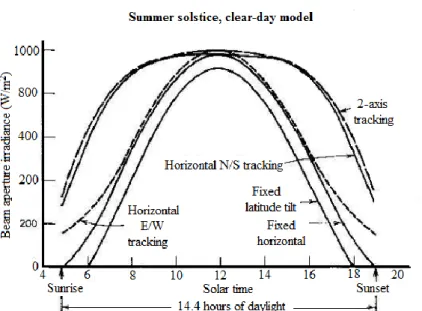
Figure 16: Solar irradiance that reaches the different tracking types' collectors, (Stine & Geyer, 2001) ... 31
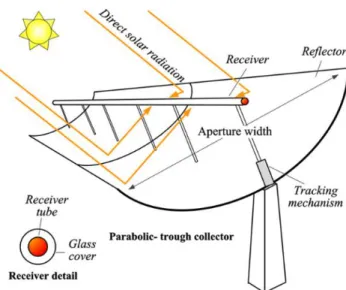
Figure 17: Parabolic trough collector (Cabrera et al., 2013) ... 32
Figure 18: Differential control volume of the receiver, (Yilmaz & Söylemez, 2014) ... 34
xv
Figure 19: Cross-section of the receiver tube with the accompanying the thermal
resistance diagram, adapted from (Yilmaz & Söylemez, 2014) ... 36
Figure 20: Thermocline sensible heat storage schematic, adapted from (Stine & Geyer, 2001) ... 46
Figure 21: T-S diagram of typical organic fluids used in solar applications ... 50
Figure 22: A schematic diagram of the ORC (a) with accompaning T-S diagram (b), (Guo et al., 2014) ... 52
Figure 23: Resultant efficiency correlations for single stage ORC turbines, (Macchi & Astolfi, 2017) ... 54
Figure 24: Simulation SORC plant schematic, adapted from (Saini et al., 2015) . 58 Figure 25: Design point simulation main function ... 60
Figure 26: The effect of the solar field mass flow rate on PT collector efficiency (a), PT outlet temperature (b) and heat gained (c) for different inlet temperatures ... 65
Figure 27: Effect of turbine inlet temperature on plant efficiency for a 1 MWe turbine output ... 67
Figure 28: Design point T-S diagram ... 68
Figure 29: The SORC capacity factor for different TES sizes and SM's ... 74
Figure 30: The SORC LCOE values for different TES sizes and SM's ... 75
Figure 31: Summer solstice – 22 December ... 75
Figure 32: Winter solstice – 21 June ... 76
Figure 33: TES level monitoring ... 76
Figure B.1: Solar field simulation flow chart ... 84
Figure D.1: SAM location and resource input ... 97
Figure D.2: SAM solar field input parameters ... 97
Figure D.3: SAM collector input parameters ... 98
xvi
Figure D.5: SAM power block input parameters ... 99
Figure D.6: SAM TES input parameters ... 100
Figure D.7: SAM parasitic input parameters ... 101
xvii
List of Tables
Table 1: Comparison between ORC compared to steam Rankine cycles, (Southon,
2015) ... 13
Table 2: Estimated maximum functional temperature for most commonly used organic fluids, (Macchi & Astolfi, 2017) ... 15
Table 3: CSP projects in South Africa, (Rycroft, 2018) ... 21
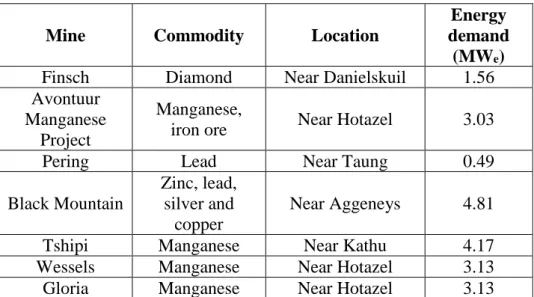
Table 4: Smaller mines in the higher DNI region of SA, (World Bank Database, 2016) ... 25
Table 5: Possible mining locations for SORC implementation, (SODA, 2014) ... 26
Table 6: SMART selection ... 27
Table 7: RMSE PT collector model comparison ... 33
Table 8: Constants for equations to calculate the mixed convective regime heat transfer ... 41
Table 9: Solar field fittings for a PT collector loop ... 45
Table 10: N-pentane regarding the selection considerations ... 50
Table 11: Design point simulation constraints and constants ... 61
Table 12: Metrological input parameters ... 62
Table 13: Solar field input parameters ... 62
Table 14: Power block input parameters ... 64
Table 15: Resulting optimized plant efficiencies with nett power output ... 66
Table 16: Design point simulation results ... 68
Table 17: Input parameter sensitivity ... 69
Table 18: Metrological conditions sensitivity ... 70
Table 19: Annual simulation input data ... 73
xviii
Table A.1: N-pentane properties, (Chemistry Reference, 2017) ... 82
Table A.2: R134a properties, (Chemistry Reference, 2017) ... 82
Table A.3: R24fa properties, (Chemistry Reference, 2017) ... 83
Table A.4: Therminol 66 properties, (Eastman, 2017) ... 83
Table C.1: Solar field result comparison ... 85
xix
Nomenclature
Abbreviations
ACC Air cooled condenser CSP Concentrated solar power DHI Diffuse horizontal irradiation DNI Direct normal irradiance GHI Global horizontal irradiation HTF Heat transfer fluid
HVAC Heating, ventilation and cooling IEA International Energy Association ITD Initial temperature difference LCOE Levelised cost of electricity LFR Linear Fresnel reflectors MCDA Multi criteria decision analysis
NELHA National Energy Laboratory of Hawaii Authority NREL National Renewable Energy Laboratory
PT Parabolic trough
REIPPPP Renewable Energy Independent Power Producer Procurement Programme
RMSE Root mean square error RO Reverse osmosis SAM System advisor model SCA Solar collector assembly SF Solar field
SM Solar multiple
SMART Simple multi-attribute rating technique SORC Solar integrated organic Rankine cycle TES Thermal energy storage
xx Constants gc Proportionality constant [-] g Gravitational constant [m/s2] σ Stefan-Boltzmann constant [W/m2K4] Symbols A Area [m2] Cp Heat capacity [kJ/(kgK)] D Diameter [m] e Error [-]
Ea Net annual electricity [MWh]
EOT Equation of time [minutes]
f Friction factor [-]
Gr Grashof number [-]
H Bernoulli head [m]
ℎ Enthalpy [kJ/kg]
ℎ Heat transfer coefficient [W/(m2K)]
I Irradiation [W/m2]
l Length [m]
𝑘 Thermal conductivity [W/m °C]
𝑘𝑑 Annual debt interest rate [%]
𝑘𝑓 Burnt fuel costs [%]
𝑘𝑖𝑛𝑠𝑢𝑟𝑎𝑛𝑐𝑒 Annual insurance interest rate [%]
𝐾𝐿 Loss coefficient [-]
𝐾𝜃 Incidence angle modifier [-]
LC Longitude correction [hours]
LCT Local time [hours]
𝑚̇ Mass flow rate [kg/s]
N Number of day of the year [-]
xxi
𝑝 Perimeter [m]
P Pressure [kPa]
Pr Prandtl number [-]
𝑞̇ Heat transfer rate [W/m]
𝑄̇ Heat transfer rate [W]
𝑅 Thermal resistance [°C/W]
Ri Richardson number [-]
Re Reynolds number [-]
u Fluid velocity [m/s]
SP Turbine size parameter [-]
T Temperature [°C]
ts Solar time [hours]
V Velocity [m/s]
Vr Turbine volume flow ratio [-]
Ẇ Power [W]
𝑥 Function of day number N [°]
α Absorptance [-] δ Declination angle [°] 𝜀 Emissivity [-] 𝜂 Efficiency [%] θi Angle of incidence [°] 𝜃𝑧 Zenith angle [°] ∅ Latitude [°] μ Dynamic viscosity [kg/(m.s)] ν Kinematic viscosity [m2/s] 𝜌 Density [kg/m3] τ Transmissivity [-] ω Hour angle [°]
xxii Subscripts a Absorber air Air an Annulus ap Aperture avg Average bulk Bulk b,n Beam normal C Condenser c Cover cl Clean mirror comp Components cond Conduction conv Convection cr Critical da Dirt on receivers Dis Discharged dm Dirt on mirrors Dump Dumped e Electrical eff Effective evap Evaporator F Fan film Film gain Gained gen Generator ge Geometrical gross Gross
HTF Heat transfer fluid i Inlet conditions
xxiii
ia Inner absorber tube
ic Inner cover of absorber tube is Isentropic
L Loss
max Maximum
m Mean property condition net Net
o Outlet conditions oa Outer absorber tube
oc Outer cover of absorber tube opt Optical PT Parabolic trough PB Power block plant Plant pump Pump rad Radiation ref Reflector mirror rec Recuperator SF Solar Field sh Shadow sky Sky sol Solar T Turbine th Thermal tr Tracking un Unaccounted wall Wall
1
1
Introduction
1.1
Research background
According to scientific research the main cause of global warming is the human exacerbation of the greenhouse effect. Fossil fuels produce 80 % of the world’s current energy requirements and the energy demand is expected to increase by 61 % leading up to 2050 (IEA & IRENA, 2017). The environmental effects can become catastrophic if fossil fuels usage is continued at the current extent. During the COP21 conference in Paris a long-term goal was set to keep the average global warming below 2 °C. However, parties were urged to pursue efforts to limit it to 1.5 °C (C2ES, 2015). The International Energy Association (IEA) contributes to this goal by attempting to decarbonise the entire energy system and set certain goals for the renewable energy sector (IEA, 2014).
According to World Economic Forum (2018), a fifth of the current global energy is produced by renewable energy sources. From 2015 to 2016 solar power provided 50 % of all newly installed renewable energy capacity. It was also the first time in history that the added solar capacity exceeded all other electricity-producing technology. Wind power provided 33 % of newly installed renewable energy capacity followed by hydro power giving 15 % (World Economic Forum, 2018). Solar power is definitely on the fore front of renewable energy installations and the IEA set a goal in their latest roadmap specifically for concentrated solar power (CSP). With CSP having 5133 MW installed capacity at the end of 2017 (Helios CSP, 2018), the goal is to reach a global capacity of 1000 GW at 2050, (IEA, 2014).
Taking into account the large decrease in the price of photovoltaic technology price over the past decade, CSP technology must yet prove itself to the energy sector by highlighting the real value of CSP. Stakeholders are gaining confidence in the value of CSP as the technology is proving to offer a non-intermittent solution to help supply the ever-growing energy demand. Contributing factors include the vast amounts of research aimed at developing cost effective thermal energy storage (TES) and the successful implementation of various CSP systems. CSP developments are typically larger than 50 MWe and feeds into the national
grid.
The critical barrier to the widespread usage of off-grid small-scale CSP (500 kWe – 5 MWe), is the lack of optimised and economically competitive
technology. Small-scale consumers that want to utilize off-grid energy sources are often left reliant on fossil fuels (like diesel generators) during night time. Other renewable technology are intermitted power supplies and storing electrical energy at this scale becomes impractically expensive hence small-scale CSP can be a solution.
2
1.2
Motivation
The effect of deploying small-scale CSP reaches far beyond just the climate and environmental benefits. In South Africa the mining-, construction-, auto-, metal- and engineering sectors contribute about 20 % of South Africa’s gross domestic product, hence making it important to sustain these industries (SEIFSA, 2016). These industries are very reliant on energy and the widespread load shedding in 2015 left various concerns about the reliability of grid-offered energy. These industries are typical small-scale users that might be interested in a reliable, renewable energy source in order to hedge themselves against energy uncertainties for future developments. A reliable small-scale renewable energy alternative can be a key contributor in securing economic growth in South Africa.
In large scale CSP plants water is an excellent working fluid choice because high temperature energy resources benefits steam Rankine cycle efficiencies. The thermodynamic properties of steam however prohibit water being used as suitable working fluid in lower temperature and lower power output applications (Macchi & Astolfi, 2017). Andreasen et al. (2017) also concluded in a comparative study between working fluids that the use of steam greatly limits the design of high-efficiency turbines for low power output applications. The study highlighted that single-stage steam turbines are impractical solutions due to high supersonic flows at stator exit and rotor inlet, high liquid content at turbine exit, high volumetric ratios between inlet and outlet conditions and high peripheral speed. In order to achieve high efficiency values, a high number of stages is required. This makes steam turbines a complex and capital intensive solution for small-scale power applications.
Contrary to the above, organic Rankine cycles (ORC) are designed specifically to produce power within the lower temperature and lower power output ranges in a technically and economically feasible manner. For the power output range of 500 – 1000 kW ORC turbines can achieve thermal efficiencies of up to 85 % compared to the lower values of steam turbines ranging from 52 % - 71 % depending on the number of stages and turbine configuration (Andreasen et al., 2017). A promising advantage of coupling an ORC instead of a steam Rankine cycle with CSP, is that less and cheaper components are needed due to lower temperatures and cycle simplicity.
The successful completion of the 1 MWe solar integrated organic Rankine cycle
(SORC) plant in Arizona, USA in 2006, leads to a resurgence of interest in the research and development of small-scale SORC’s. If SORC’s can prove to be as a reliable and bankable replacement for fossil fuels in off-grid scenarios, the argument supporting the value of CSP will be strengthened. SORC’s can then form part of the solution to secure a sustainable energy future. The future of electricity generating Rankine cycles coupled with CSP may subsequently cover the whole spectrum of energy requirements as proposed in figure 1.
3
Figure 1: Proposed range of Rankine Cycles, adapted from (Dickes, 2016)
1.3
Objectives
The main goal of this research is to determine whether the integration of an ORC, with a smaller CSP system can result in a feasible solution for off-grid applications. The SORC gross power output range of 500 kWe – 5 MWe is
considered for a specific location and industry in Southern Africa. Even though the economics will play a role in the study, the focus will be on the technical aspects.
The objectives of the research are:
Determine the technological maturity and technical feasibility of integrating ORC technology with the small-scale CSP.
Identify an industry and site in Southern Africa as case study for the proposed SORC.
Analyse and simulate a SORC plant to component level. The first simulation is to determine the design point of the plant. The second simulation is an annual simulation for the identified site.
Perform a high level economic analysis of the SORC in order to determine the economic competitiveness of the technology.
1.4
Thesis layout
Chapter 1 introduces the background information leading up to the research problem. The research was further motivated and it was demonstrated how a SORC fits into the larger picture in securing a sustainable energy future. The objectives of the research were clearly defined.
4
Chapter 2 consists of a literature study and starts with giving an overview of ORC’s and CSP to gain an understanding of these types of technology. The chapter continues by looking at the status of SORC’s and gives a technical overview of the technology. The chapter ends off by drawing conclusions on the technological maturity and technical feasibility of integrating ORC technology with the small-scale CSP.
Chapter 3 goes through the process of identifying an industry for the possible deployment of a small-scale SORC and ends off by identifying a specific site.
Chapter 4 analyses the theory of all the functioning units in the SORC plant namely the solar field, storage and power block. The analysis goes to component level and provides the theory for the simulations in the following chapters.
Chapter 5 describes the first simulation to obtain the design point of the SORC plant for the specific location. The simulation methodology is carefully described, and all the input parameters of the simulation are tabulated.
Chapter 6 describes the annual simulation of the SORC plant. The simulation results are shown, and the high-level economic analysis follows.
Chapter 7 is the concluding chapter with a summary of the research and the main results. The chapter gives an overall conclusion on the research question as well as recommendations on future work.
5
2
Literature Study
The literature study aims to broaden the understanding of an SORC and concludes on the technological maturity and technical feasibility of integrating an ORC with small-scale CSP. In this chapter, an overview of ORC’s and CSP is given in their respective fields. The discussion continues to look at the status of SORC’s whereafter a technical overview of SORC’s is given. The chapter ends off by looking at the South African context.
2.1
Introduction to SORC’s
2.1.1
ORC overview
Even though steam Rankine cycles are more commonly used, the usage of organic fluids as working fluid is not a new concept. In 1826, Thomas Howard patented the first concept of an engine using ether as a working fluid, but the first commercially used organic fluid was Naphtha in 1890 where the Gas Engine & Power Company of New York claimed to have sold five hundred of these engines. (Casati, 2014).
The first operational solar ORC was built by Frank Shuman in Philadelphia USA in 1907 and was rated at 2.5 kW thermal output. With the 100 m2 collector area, direct vapour of Ether at 115 °C was used to drive an irrigation pump (Shuman, 1907). Another organic fluid namely Diphenyl oxide was also reportedly used in 1926 in a Rankine cycle (Curran, 1981). The first solar to electric application of an ORC came in 1961 when Israeli engineer Harry Zvi Tabor, alongside his partner Lucien Bronicki developed an ORC turbine. This was the first turbine to operate at low temperatures. Cheap fossil fuels prevented the widespread usage of this turbine but Bronicki went on to later find Ormat Industries that still develops and manufactures turbines to date (Keighley, 2013).
The commercial use of ORCs originated primarily from geothermal resources in the 1970’s (Southon, 2015). Currently ORC technology is used in a variety of industries mostly because of the modularity and versatility seeing that the technology can be used at a wide range of temperatures (Vélez et al., 2012). When referring to the industries using ORC technology, it can be divided into two categories. Firstly the heat resource and secondly the output application. Figure 2 shows the most common heat sources for an ORC system and the different output application industries are summarised in figure 3.
6
Figure 2: ORC heat resources, adapted from (Southon, 2015)
Figure 3: ORC output application industries, adapted from (Southon, 2015)
At the end of 2016, the ORC market reached a total installed capacity of 2701 MW distributed between 1754 ORC plants. Referring to figure 4 (a), geothermal applications is the market dominating heat source for ORC plants and accumulates to almost 75 % of installed capacity (Tartière & Astolfi, 2017). ORC geothermal plants vary from 200 kWe to the largest being the 88 MWe plant
named Ngatamariki in New Zealand (Southon, 2015). These plant sizes vary greatly because the temperature range of geothermal sources can range from a few tens of degrees up to 300 °C (Quoilin, 2011). Due to the multi-MW scale of geothermal plants, the number of plants is relatively low with only 337 installations. The market share per heat source and per manufacturer are shown in figure 4 (a) and figure 4 (b) respectively.
Figure 4: Total installed capacity per heat source (a) and per manufacturer (b) (Tartière & Astolfi, 2017)
7
Waste heat recovery is the second most utilised heat source by ORC plants with about 14 % of total installed capacity. Waste heat recovery accounts for a large number of plants as about 800 of these units installed by ORMAT are smaller than 4 kWe (Tartière & Astolfi, 2017). Biomass accounts for the third largest industry
with a market share of about 11 %. The cost is significantly lower than fossil fuels but a great investment cost is needed to achieve the clean biomass combustion needed for the boiler. To make the biomass ORC plants economically viable, combined heat and power is required but the plant is driven by an operating strategy bias to the heat requirement (Quoilin et al., 2013). Turboden is the largest ORC manufacturer in the biomass industry with 228 plants at present and many more under construction (Tartière & Astolfi, 2017).
Solar applications are almost negligible in comparison to the total market share of ORC’s. Two main possibilities of integrating solar energy with an ORC exist. The first is reversible ORC/heat pump units powered by solar thermal roofs and the second is CSP systems for power generation (Quoilin et al., 2015), (Southon, 2015). This thesis focuses on the latter case of integrating an ORC with CSP.
It can be concluded that ORC as technology has been established in the general market and that there are a number of companies driving the development of this technology. It became clear that the ORC technology is yet to be proven in the solar specific industry but the advantage for the solar thermal industry is that other industries are developing and optimising technology that can be easily implemented in the solar thermal field. On the other hand, as the solar thermal industry develops and optimises solar collectors for other thermodynamic cycles, the point could be reached where CSP and ORC can be combined in an economical way.
2.1.2
CSP technology
The rate at which incoming solar energy reaches the earth’s surface is called the solar irradiance or insolation and is measured in Watts per metre squared (W/m2). Just outside the earth’s atmosphere, the average solar irradiance is 1367 W/m2.
Designers are often interested in knowing how much solar energy falls on a certain area over a period of time and this summation of solar energy is called solar radiation or irradiation and is measured in Watt-hours per square meter (Wh/m2) (Stine & Geyer, 2001). The solar irradiation can be divided into three components where the beams coming directly from the sun’s disc are referred to direct normal irradiation (DNI), the scattered solar irradiance which seemingly comes from all directions is called the diffuse horizontal irradiation (DHI) and lastly the combination of DNI and DHI forms what is referred to as global horizontal irradiation (GHI). CSP systems can only harness the sun’s energy in the form of DNI while solar photovoltaic panels absorb the sun’s energy in the form of GHI.
8
CSP plants concentrate solar rays onto what is called the receiver, to heat up a fluid that in turn, with direct or indirect means run a turbine. The turbine is coupled with a generator that then generates electricity. One of the main advantages of CSP power plants compared to other renewable energy sources is the fact that a system can be integrated with a comparatively inexpensive thermal energy storage system. Energy is stored in the form of heat, most often in a molten salt solution. The main solar concentrating technologies are the linear Fresnel reflector, central receiver tower, parabolic dish and parabolic trough (PT) and these technologies are depicted in figure 5.
Figure 5: Main CSP technologies (IEA, 2014)
Parabolic dishes and central receiver towers have the highest concentration ratios leading to the high temperatures typically obtained by these types of technology. Central receivers are still a leading type of CSP technology. In terms of total installed capacity, Ivanpah Solar Electric Generating System located in Nevada, USA is the largest CSP plant. The plant consists of three central receiver towers each with its own turbine. Combined the plant gives a net power output of 377 MWe (NREL, 2014). Parabolic dishes have almost disappeared from the
commercial energy landscape because it has not proved possible to reduce the higher cost and risks associated with the technology. It also does not easily lend itself to storage (IEA, 2014).
Linear Fresnel reflectors (LFR) are also used on commercial size scale. Examples are the 30 MWe plant running in Calasparra, Spain and the 125 MWe plant built in
Rajasthan, India. LFR’s use flat mirrors and have the advantage over PT’s that they are easier and cheaper to manufacture. The disadvantage compared to troughs, is the optical loses the plant experiences when the sun is low in the sky in the mornings and late afternoons. All LFR plants currently use direct steam generation, (IEA, 2014).
One small PT plant in Thailand also uses direct steam generation but PT plants are mainly coupled to traditional steam Rankine cycles for power generation, working at temperatures between 300 °C to 400 °C (Quoilin, 2011), (IEA, 2014). PT plants require high temperature and high pressure to increase efficiency but this leads to expensive component investment costs. There is a natural temperature limit
9
imposed by the sun’s energy and in order for the plant to be profitable, high power output needs to be obtained (Quoilin, 2011). ORC seems to be a promising technology because a plant operates at much lower temperature and pressure and this significantly decreases the investment costs. The power output of such an ORC plant is however limited to a small-scale.
2.1.3
Current status of SORC plants
An example of an attempt to lower the investment cost of solar ORC was first seen in 1985 in Beith Ha’Arava, Israel. Engineers replaced the solar collectors with the newer concept of a solar pond. The pond works on the inversion effect where a mass of water can be hotter at the bottom than at the top by inhibiting natural convection. A further increase in temperature gradient is forced by the salt gradients present. Temperatures of up to 96 °C are reached at the bottom of these ponds. Heat is then extracted by pumping the brine through radial funnels to heat the thermodynamic working fluid of the ORC. Another realised advantage of this technology is the fact that the solar pond provides a large built in storage. This Israeli Solar Pond Power Plant used a 5 MW ORC turbine supplied by ORMAT and the power plant operated from 1985 until 1989. With thermodynamic conversion efficiencies of 5.5 % and an overall sun to electrical efficiency of under 1 % the plant was closed down because the power produced was not economically competitive with the cheap fossil fuels available at the time (Tabor & Doron, 1990), (Dickes, 2016). This however is unique to the high salinity of water from the Dead Sea and it is unlikely to be replicated elsewhere.
The first commercial SORC plant is the 1 MWe APS Saguaro PT plant in Arizona,
USA completed in 2006. The plant has 10 340 m2 of PT collectors using thermal oil at 300 °C as heat transfer fluid in the solar field. The ORC module uses n-pentane as working fluid with a 1 MWe turbine supplied by ORMAT. A major
increase in efficiency was seen with an overall solar to electrical efficiency of 12.1 % at design point. This is still the largest operating SORC plant in the world to date and a pioneer in SORC technology as it proved the simplicity of an ORC compared to that of a conventional steam Rankine cycle as this plant even allows for unattended operation. All of which are important factors in the economic considerations and commercial acceptance of this technology (Canada et al., 2005), (Dickes, 2016), (Quoilin et al., 2013).
In December 2009 another SORC plant was inaugurated in the Kona Desert at the National Energy Laboratory of Hawaii Authority (NELHA) in Hawaii. This project named the “Holaniku at Keahole Point” uses PT collectors. Sources differ about the output of the plant but most agree that it has an installed thermal capacity of 2 MW and an output of 500 kWe (PowerTechnology, n.d.),
(SolarServer, 2010), (SOPOGY, 2013), (Nelson & Starcher, 2011), (Kalaiselvam & Parameshwaran, n.d.) . The solar field uses thermal oil that is heated up to 200 °C when entering the power block. The power block consists of a closed loop ORC supplied by ElectraTherm, using a twin screw expander to power the
10
generator. The plant incorporates 2 hour TES and at present the plant produces an average of 4 GWh electricity per year. The plant uses a total of 1.5 ha of land and unfortunately no information was available about the overall plant efficiencies. (SOPOGY, 2013).
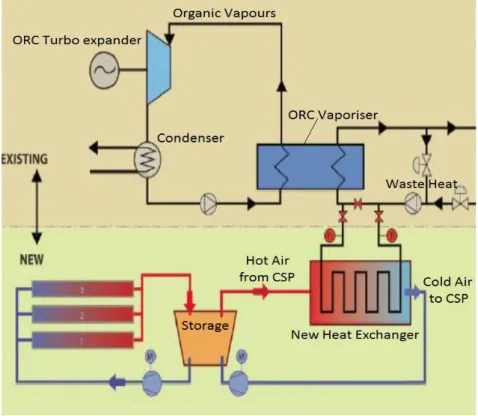
In Ait Baha Morocco a cement plant has been operating since 2010 and produces 5000 tons/day. It was using coal as its main fuel and had an existing ORC running from waste heat of the cement production process (Ojan, 2015). In 2014, a CSP system was installed to provide auxiliary heat to the ORC complementing the waste heat. The solar field consist of PT air receiver built by Airlight Energy with a 3.9 MWth peak thermal output. These receivers are quite revolutionary in their
designs and various studies found interest in their working (Good et al., 2013). Air enters the solar field at 270 °C and exits at 570 °C. Incorporated in the solar field is a packed-bed rock storage with 5 hour TES (Airlight Energy, 2015). A schematic layout of the plant can be seen in figure 6.
Figure 6: ORC plant layout, adapted from (Ojan, 2015).
The hot air from the storage enters a heat exchanger where more heat is added to industrial waste heat coming from the cement production plant before going to the evaporator of the ORC. The ORC working fluid reaches a temperature of about 200 °C. The power block has a turbine with 2 MWe designed output supplied by
11
Also in Morocco at Benguerir known as the Green Energy Park of the Research Institute for Solar Energy and New Energies, a 1 MWe ORC plant manufactured
by ENARRAY is under construction but the plant does not include TES (Gaggioli, 2016a), (IRESEN, 2016b) and (IRESEN, 2016a). Further development of this plant is planned with another project called the ORC-Plus project. The ORC-Plus project is a 6.4 M€ initiative funded by the EU Commission under the framework programme Horizon 2020. The project aims at developing an optimized combination of innovative TES and engineering solutions necessary to improve the dispatchability (production on demand) of an existing SORC (ORC Plus, 2015).
The current ORC plant as well as the planned ORC-Plus project uses type FLT Soltigua LFR’s with a net collecting surface of 11 434 m2. The HTF named
DelcoTermSolar E15 that is used is a paraffinic based oil with minimal environmental impact. The solar field will have working temperatures ranging between 180 °C and 300 °C. The ORC power block uses a 1 MWe rated Exergy
radial outflow turbine and an air cooled condenser (ACC) (Gaggioli, 2016a). The 20 m3 storage tank will provide 4 hours of full load production after sunset (Gaggioli, 2016b). The completed plant will serve as a pilot plant to validate the technology in a real operational environment and demonstrate its feasibility in increasing the dispatchability of CSP plants and lowering the levelised cost of electricity (LCOE) (IRESEN 2016a). In figure 7, a schematic layout of the plant upon completion is shown.
Figure 7: ORC Plus pilot plant layout (ORC Plus, 2015)
These are the only operating and developed SORC plants. The conclusion is that the combination of CSP and ORC as technology in the range from 500 kWe –
5 MWe is immature. This leads to investment and development being slow as this
technology has yet to prove successful whereafter widespread deployment will take place. A trend can be seen on the other hand with the increased interest in SORC over the past ten years.
12
On a micro scale (<10 kW) a few developments are taking place. The best documented is the 1 kW SORC plant installed in Lesotho in 2007 for rural electrification. The work was done by a collaboration between Massachusetts Institute of Technology, University of Liege, STG International and the Government of Lesotho. The plant uses a simple ORC without regeneration therefore the plant is robust and cheap. This is achieved by using and modifying commercial HVAC compressors and heat exchangers with a scroll expander and an overall efficiency of about 5 % is achieved (Orosz, 2009), (Quoilin et al., 2011), (Quoilin et al., 2013), (Quoilin & Lemort, 2009), (Tchanche et al., 2011), (Giovannelli, 2015), (Wang et al., 2013), (Kim & Han, 2015).
Other smaller SORC applications include the 10 kW power output plant running with an overall efficiency of 4.7 % operating off-grid in Indonesia since 2012 (Pikra et al., 2013), (Kim & Han, 2015). In 2012 the University of Louisiana in conjunction with CLECO Power LLC, constructed a 50 kW pilot scale PT trough Plant in Louisiana. The plant uses an ORC power block provided by ElectraTherm. The working fluid of the ORC is R245fa where the heat exchanger operates at 93 °C inlet and 121 °C outlet temperature. The plant had an overall efficiency of 6 % (Raush et al., 2013), (Desai & Bandyopadhyay, 2016). Granite Power completed a pilot SORC plant in 2014 that can generate up to 30 kW of electricity with 1 hour TES. They claim they have developed a high efficiency version of the ORC but no information on their operating efficiencies are available (Berlin, 2014).
2.2
SORC technical overview
2.2.1
Working fluids
The ORC is conceptually the same as a traditional steam Rankine cycle in the sense that it is based on the vaporization of high pressure liquid which is in turn expanded to a lower pressure to generate mechanical work. The difference is that an organic component is used as working fluid instead of water and thereby allowing for a more efficient system at these lower temperatures. Various organic components are available but it is typically a refrigerant, hydrocarbon, silicon oil or a perfluorocarbon that is used (Quoilin, 2011).
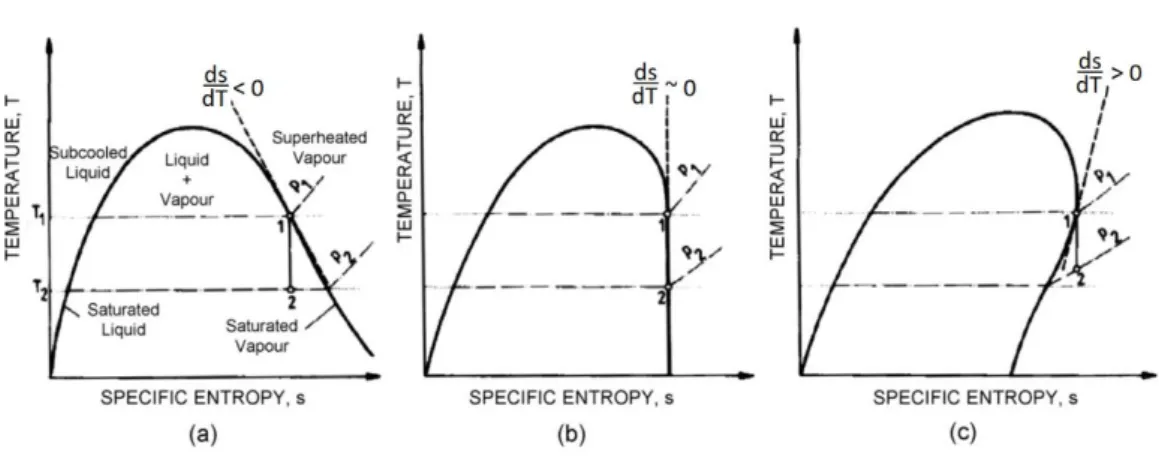
Working fluids can be categorised according to their saturation vapour curve. Three basic types of working fluids namely wet, dry and isentropic fluids can be categorised and the distinction between them are drawn regarding the vapour slope of the saturation curve. Referring to figure 8, wet fluids are classified by having a negative saturation curve slope, isentropic fluids have an infinite slope and dry fluids have a positive slope. Examples of wet fluids are water and ammonia; organic fluids are either dry or isentropic fluids.
13
Figure 8: T-S diagram of fluids (a) wet, (b) isentropic and (c) dry, (Badr et al., 1985) For wet fluids, a superheater is required to superheat the vapour and this increases the system cost. Since ORC’s focuses on lower heat sources the superheating of the vapour, as in the case for steam Rankine cycles, is not necessary (Vélez et al., 2012). If the wet fluid is expanded (between points 1 and 2) without superheating, the vapour falls in the liquid/vapour area and the condensate so formed can cause damage to the turbine. The same is not true for the organic fluids as it can be seen that the fluid still falls in the vapour region after the expansion process without being superheated before the expansion process, hence no vapour condensation happens in the turbine (Delgado-Torres & García-Rodríguez, 2010).
Another advantages of organic fluids over water, is the higher molecular weight associated with organic fluids. A further comparison between steam and organic fluids as working fluids can be seen in table 1.
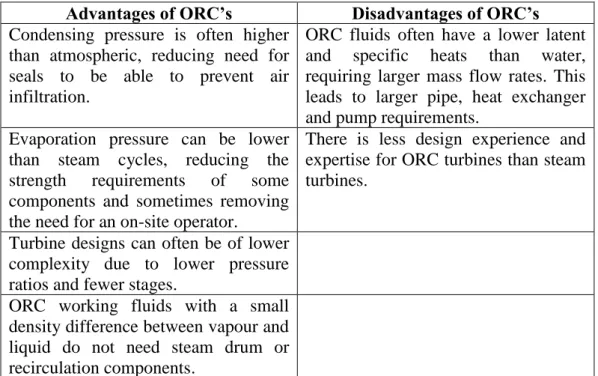
Table 1: Comparison between ORC compared to steam Rankine cycles, (Southon, 2015)
Advantages of ORC’s Disadvantages of ORC’s
Choosing a working fluid with a low boiling point can allow for economic conversion of low-temperature heat sources.
Working fluids are more expensive and often less chemically stable and environmentally friendly than steam.
Choosing a dry, high molecular weight working fluid can eliminate expensive superheating or reduce turbine strength requirements.
At high temperatures, complex steam cycle systems are capable of higher efficiency than current ORC designs.
Fluids with high vapour densities can lead to smaller turbine and piping requirements.
ORC fluids often have poorer heat transfer properties, requiring a larger heat exchanger than an equivalent steam system.
No need for de-aeration and demineralisation processes, and non-condensable gases removal systems are often simple.
ORC fluids often are more viscous, leading to higher pumping work and piping size requirements.
14
Advantages of ORC’s Disadvantages of ORC’s
Condensing pressure is often higher than atmospheric, reducing need for seals to be able to prevent air infiltration.
ORC fluids often have a lower latent and specific heats than water, requiring larger mass flow rates. This leads to larger pipe, heat exchanger and pump requirements.
Evaporation pressure can be lower than steam cycles, reducing the strength requirements of some components and sometimes removing the need for an on-site operator.
There is less design experience and expertise for ORC turbines than steam turbines.
Turbine designs can often be of lower complexity due to lower pressure ratios and fewer stages.
ORC working fluids with a small density difference between vapour and liquid do not need steam drum or recirculation components.
It can be concluded from table 1 that the application of water and organic fluids are different. Ultimately, the type of working fluid that would be selected also depends on the temperature range at which the ORC would be operating as fluids are limited by their own fluid- and thermodynamic properties. Figure 9 gives an indication of typical temperatures at which the most common types of fluids can be used.
15
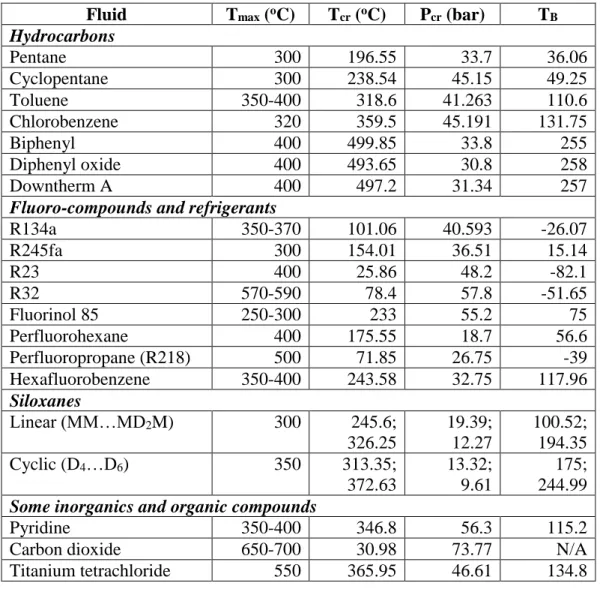
A summary of the thermochemical properties of the most commonly used organic fluids can be seen in table 2.
Table 2: Estimated maximum functional temperature for most commonly used organic fluids, (Macchi & Astolfi, 2017)
Fluid Tmax (oC) Tcr (oC) Pcr (bar) TB
Hydrocarbons Pentane 300 196.55 33.7 36.06 Cyclopentane 300 238.54 45.15 49.25 Toluene 350-400 318.6 41.263 110.6 Chlorobenzene 320 359.5 45.191 131.75 Biphenyl 400 499.85 33.8 255 Diphenyl oxide 400 493.65 30.8 258 Downtherm A 400 497.2 31.34 257
Fluoro-compounds and refrigerants
R134a 350-370 101.06 40.593 -26.07 R245fa 300 154.01 36.51 15.14 R23 400 25.86 48.2 -82.1 R32 570-590 78.4 57.8 -51.65 Fluorinol 85 250-300 233 55.2 75 Perfluorohexane 400 175.55 18.7 56.6 Perfluoropropane (R218) 500 71.85 26.75 -39 Hexafluorobenzene 350-400 243.58 32.75 117.96 Siloxanes Linear (MM…MD2M) 300 245.6; 326.25 19.39; 12.27 100.52; 194.35 Cyclic (D4…D6) 350 313.35; 372.63 13.32; 9.61 175; 244.99
Some inorganics and organic compounds
Pyridine 350-400 346.8 56.3 115.2 Carbon dioxide 650-700 30.98 73.77 N/A Titanium tetrachloride 550 365.95 46.61 134.8
No working fluid is optimal for all applications. Many studies over different applications have proved and the study of working fluid candidates must be integrated into the design process of a specific application. (Quoilin & Lemort, 2011). The thermodynamic and physical properties of working fluids are what differentiate it the most. For example the greater the latent heat and molecular weight of the fluid, the more energy the fluid can absorb during the evaporation process. This results in smaller pumps and decreases costs due to the decreased flow rate (Vélez et al., 2012).
16
The relationship between working fluid properties and thermodynamic cycle performance are discussed below:
Thermal stability: The thermal stability of the fluid that is used can limit the temperature of the heat source because fluids can chemically brake down certain temperatures. This alters the way the cycle operates and can result in toxic and irritating compounds which can induce health problems if leaked (Vélez et al., 2012).
Vaporization latent heat: Also referred to as enthalpy of vaporization, the higher the vaporization latent heat, the more available heat can be added to the working fluid in the heat exchanger. This effect decreases the necessity of regulating the superheating and expanding of the vapour through regenerative feed heating in order to obtain higher efficiencies (Maizza & Maizza, 2001). In terms of work output it has been found that for the same defined temperatures, a larger unit work output is produced with working fluids with a higher vaporization latent heat (Chen et al., 2010) in (Bao & Zhao, 2013). The scenario looks different for the case where the heat source is of varying temperature. Larjola (1995) in Bao and Zhao (2013) found that the temperature profile of the working fluid better follows the temperature profile of the heating fluid in the evaporator therefore fluid with a lower vaporization latent heat is desirable with a heat source of varying temperature. Due to storage incorporated the current applications aim for a high vaporization latent heat.
Density: Bao and Zhao (2013) states that a high vapour density is of key importance especially for working fluids with a low condensing pressure. A low density leads to higher volume flow rates which in turn lead to larger pressure drops in the heat exchangers and the bigger turbine sizes. All these have an adverse effect on the cost of the system. When looking at the isentropic efficiency that is described by the size parameter (SP) and the isentropic volume flow ratio or just volume flow ratio (Vr), both as
defined in subsection 4.4.3, a lower value for SP is desired to decrease the turbine size. A higher density at the turbine outlet decreases the SP hence a higher fluid density is beneficial.
Specific heat: A few researcher tried to propose relationships between the specific heat of the fluid and the required pump work (Chen et al., 2010), (Maizza & Maizza, 1996), (Papadopoulos et al., 2010) but Bao and Zhao (2013) concluded that there is no direct relationship between specific heat and specific or total pump work.
17
Critical temperature: Bao and Zhao (2013) studied the effect critical temperature has on cycle performance and concluded that a fluid with a higher critical temperature results in higher overall cycle efficiency but lower condensing pressure. An adverse effect of working with high critical temperatures is that low vapour densities are involved.
Boiling temperature: Mago et al. (2008) showed that the fluid with the highest boiling temperature, showed the best thermal efficiency. Bao and Zhao (2013) noted that that the study done by Mago et al. (2008) only considered a small number of working fluids and the results cannot be taken as absolute. Saleh et al. (2007) showed with a more comprehensive study that the above is only true when comparing working fluids out of the same family. The boiling temperature can be used as a relative indicator but it cannot be concluded that any one fluid will result in a higher thermal efficiency just because of a higher boiling temperature.
Freezing temperature: The lowest temperature in the cycle must be above the working fluids’ freezing point.
Molecular weight: Bao and Zhao (2013) concluded that high molecular weight has a positive impact on turbine efficiency but it must be noted that fluids with a high critical pressure and high molecular weight require higher heat transfer area. In choosing a working fluid a higher molecular weight is still desired.
Molecular complexity: Molecular complexity is directly related to whether a fluid is dry, wet or isentropic because of the definition given by Bao and Zhao (2013). As the molecular complexity increases, the vapour slope of the saturation curve becomes more positive. Some of the thermodynamic properties are directly influenced by the molecular complexity and as a rule for homologous fluids, the critical temperature increases with increasing molecular complexity whilst the critical pressure decreases. Molecular complexity will hence not be treated as an absolute criteria and as Bao and Zhao (2013) has shown, high molecular complexity can either have a positive or negative impact on cycle efficiency depending on a lot of factors (Bao & Zhao, 2013).
Viscosity: In order to maintain low friction losses in the pipes and heat exchangers, low viscosity is desired in both the liquid and vapour phase (Bao & Zhao, 2013).
18
Conductivity: In order to obtain a high heat transfer coefficient in the heat exchangers, a high conductivity is required (Bao & Zhao, 2013).
These above discussed thermodynamic and physical properties of working fluids are used in subsection 4.4.1 in a weighted decision analysis to determine the working fluid that is best suited for small scale SORC systems.
2.2.2
Thermodynamic cycle
A few thermodynamic cycles have been proposed in literature to convert low-grade heat into electricity. They include the supercritical Rankine cycle, trilateral flash cycle, Kalina cycle and the ORC. When considering the supercritical Rankine cycle’s high operating pressure, the trilateral cycle’s difficult two-phase expansion and the Kalina cycle’s complex system structure, the ORC remains the better option with its high reliability, low maintenance and simple cycle structure (Bao & Zhao, 2013). An ORC with an internal heat exchanger or also referred to as a recuperator is shown in figure 10.
Figure 10: Organic Rankine cycle with internal heat exchanger schematic and T-S diagram, (Li, 2016)
The fact that an ORC per definition works with lower temperature differences is the reason for the typical low efficiencies of ORC’s. However, there are still ways whereby the thermal efficiencies can be improved. The matter to consider would be if the cost of the added means of increasing thermal efficiency would justify the gain of increased thermal efficiency. Even small increases in thermal efficiency can mean large savings in money. The two basic principles to increase thermal efficiency are (Çengel & Boles, 2011):
Increase the average temperature at which heat is transferred to working fluid in the evaporator.
Decrease the average temperature at which heat is being rejected from the working fluid in the condenser.
19
When considering the internal heat exchanger, it is evident that the working fluid absorbs heat from the exhaust vapour coming from the turbine. This raises the temperature at which heat is added to the working fluid in the evaporator. The result then is a raise in the working fluid’s enthalpy at the evaporator entrance. For the same net power output as the baseline cycle, less heat is added to the working fluid which increases the thermal efficiency for the case with the internal heat exchanger (Li, 2016).
For an ACC the only way to reduce the condensing temperature is to decrease the initial temperature difference between the ambient air and the condensing vapour. The cost of an ACC increases as the initial temperature difference decreases therefore an optimum trade-off exists for each system.
2.2.3
ORC turbines
The turbine is the key component in an ORC and has the largest effect on cycle efficiency. It has the function of converting the working fluid’s kinetic energy into rotary mechanical energy, which is in turn converted to electrical energy by the generator coupled to the expander via a shaft. Depending on the size of the plant and working fluid, the turbine type varies over a large range of possibilities. Turbines can be divided in two main categories namely turbomachines and volumetric expanders (Macchi & Astolfi, 2017), (Quoilin & Lemort, 2011). Turbomachines are commonly referred to as turbines where volumetric expanders are referred to as expanders, but the terms are used interchangeably. Volumetric expanders are in effect a positive displacement machine where pockets of fluids are trapped during rotation, expanded and then discharged.
Scroll and screw expanders are generally used for applications where an output of less than 100 kWe is needed. For larger power outputs turbomachines are more
suitable and their typical power output range is between 100 kW and 15 MW. Depending on the relative motion of the working fluid to the turbine’s shaft, turbomachines can be categorized in three main categories namely axial, radial inflow or centripetal and radial outflow. For a power output of higher than 0.5 MW an axial turbine is the most common choice in ORC’s and is developed by both Turboden and Ormat (Macchi & Astolfi, 2017). Because the enthalpy drop is much lower for organic fluids during expansion, fewer stages are required on a turbine used in an ORC. Single-stage axial turbines can even be used for low temperatures ORC.
With proper design, an axial turbine can fit practically any application. In the ORC field however, off the shelf components are not readily available because of the wide range of applications and different working fluids being used. Most ORC turbine designs are customized for the specific application. As a rule for ORC’s, certain design decisions needs to be established prior to commencing with turbine design. This includes firstly selecting the working fluid and secondly the power cycle arrangement.
20
Various correlation diagrams and charts for the estimation of axial turbine efficiency are proposed in literature. Examples are the Baljé and Binsley plots (Binsley & Binsley, 1968) and the Smith charts (Smith, 1965), but they lack crucial variables relating to ORC applications. Because ORC’s operate at lower temperatures and have a smaller enthalpy drop over the turbine, ORC turbines normally are more compact with fewer turbine stages and have low loading coefficients. Contrary to steam and gas turbines with higher temperatures and mechanical stresses, peripheral speed is not a critical issue for ORC turbines in determining the stage number. Design processes taking into account actual blade dimensions and Mach number effects are more crucial for ORC turbines designs where turbine blades are characterized by large height variation, large flaring angles and supersonic velocities (Macchi & Astolfi, 2017).
2.3
South African context
2.3.1
CSP in South Africa
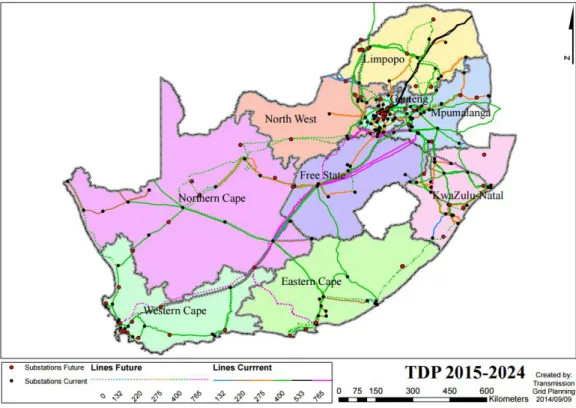
South Arica is a third world country with a population close to 56 million people living in about 13.2 million households. Currently 75 % of households are electrified leaving about 3.3 million households without electricity and these are mostly in the rural areas, (Jamal, 2015). South Africa does have an extensive existing electrical grid and with the planned grid up until 2024 shown in figure 11, the electrification rate will increase over the next few years.
21
The grid developed mostly around large cities and the coal fire power stations that still produce the majority of South Africa’s electricity. Despite this well-developed electrical grid, there still exists a large energy deficit in South Africa especially in the rural off-grid areas.
The South African government introduced the Renewable Energy Independent Power Producer Procurement Programme (REIPPPP) to prioritise renewable energy. The government aims to achieve 17800 MW of renewable energy by the year 2030 that will make out 42 % of the total energy production Through the REIPPPP, the South African Department of Energy has rolled out four bid windows in order to achieve their renewable energy goal. From these bids the leading renewable technologies were solar PV and wind energy with CSP lagging behind them (T. O. Craig et al., 2017). A total of seven CSP projects were conceived from the REIPPPP bidding windows with an additional CSP plant being built apart from the program. More details relating to these eight CSP projects currently running in South Africa are given in table 3.
Table 3: CSP projects in South Africa, (Rycroft, 2018)
Project Technology Capacity (MW) REIPPP P Window Nearest Town Status Bokpoort CSP PT 50 2 Groblershoop Operational Eskom CSP Central receiver tower
100 Other Upington Planning
Ilanga
CSP 1 PT 100 3 Upington Construction Kathu
Solar Park PT 100 3 Kathu Operational Kaxu
Solar 1 PT 100 1 Pofadder Operational Khi Solar 1 Central receiver tower 50 1 Upington Construction Redstone CSP Central receiver tower 100 3 Postmasburg Planning
Xina CSP PT 100 3 Pofadder Operational
Total 8 700
Kaxu Solar 1 was the first operational plant followed by Bokpoort and Khi. With the completion of all the CSP projects, South Africa will have a total installed capacity of 700 MW CSP.