Uppsala Center for Fiscal Studies
Department of Economics
Working Paper 2011:4
On the Role of Capital Gains in Swedish
Income Inequality
Uppsala Center for Fiscal Studies Working paper 2011:4
Department of Economics April 2011
Uppsala University P.O. Box 513
SE-751 20 Uppsala Sweden
Fax: +46 18 471 14 78
O
ntheR
OleOfC
apitalG
ainsins
wedishi
nCOmei
nequalityJespeR ROineand daniel waldenstRöm
Papers in the Working Paper Series are published on internet in PDF formats. Download from http://ucfs.nek.uu.se/
On the Role of Capital Gains in Swedish Income Inequality
*Jesper Roine
SITE, Stockholm School of Economics P.O. Box 6501, SE-113 83 Stockholm, Sweden
E-mail: jesper.roine@hhs.se
Daniel Waldenström Department of Economics
Uppsala University
P.O. Box 513, SE-751 20 Uppsala, Sweden
E-mail: daniel.waldenstrom@nek.uu.se
April 13, 2011
Abstract
Realized capital gains are typically disregarded in the study of income inequality. We show that in the case of Sweden this severely underestimates the actual increase in inequality and, in particular, top income shares during recent decades. Using micro panel data to aver-age incomes over longer periods and re-rank individuals according to income excluding capital gains, we show that capital gains indeed are a reoccurring addition to rather than a transitory component in top incomes. Doing the same for lower income groups, however, makes virtually no difference. We also try to find the roots of the recent surge in capital gains-driven inequality in Sweden since the 1980s. While there are no evident changes in terms of who earns these gains (high wage earners vs. top capital income earners), the pri-mary driver instead seems to be the drastic asset price increases on the post-1980 deregu-lated financial markets.
Keywords: Top incomes, Income inequality, Capital gains, Capital income, Swe-den, Welfare state.
JEL: D31
* We are grateful to seminar participants at Berlin Freie University, Helsinki University, Martin Jacob and two
anonymous referees for comments. The Bank of Sweden Tercentenary Fund and the Jan Wallander and Tom Hedelius Foundation are acknowledged for financial support.
1 Introduction
In recent decades income inequality has increased in many developed countries. A number of studies have shown that much of this development is due to increases in the very top of the distribution and this, in turn, has created an interest in understanding the details of top
in-comes.1 A key feature in terms of composition is that capital income is especially important in
the top, often being the largest source of income for top earners. Still, how to treat one specif-ic type of capital income, namely realized capital gains, has been a debated question. On the one hand, capital gains, realized and unrealized, are undoubtedly a source of income
accord-ing to the classic Haig-Simons income definition.2 On the other hand, data based on income
tax returns typically only show capital gains at the point of realization, making it difficult to properly allocate them in time. In addition, many top income studies use data that groups in-dividuals in different income brackets, making it impossible to allocate observed capital gains
to the right individuals.3
In the recent literature on top income shares the approach to capital gains has therefore been largely pragmatic. Where it has been possible, the repeated cross sections of income shares for different top segments of the population have been presented both including and excluding
realized capital gains.4 In other cases, various calculations and approximations have been
made to estimate the potential effect of realized capital gains.
The overall importance of capital gains to both trends and levels of top income shares is somewhat mixed. Historically they do not seem to make much of a difference for the long run series in most countries. For example, Saez and Veall (2003) and Veall (2010) show that in Canada, series with and without capital gains are very similar and display the same general pattern for the period 1972–2007. Piketty and Saez (2003, p. 18) draw similar conclusions for
1 See Atkinson and Piketty (2007, 2010) and Leigh (2009) for overviews of the top income literature.
2
According to Haig (1921) and Simons (1938), income is the value of consumption plus any increase in real net wealth, that is, it should include all capital gains, not just the realized ones.
3 Due to the difficulties of correctly allocating realized capital gains they are typically (for example in the
in-fluential Luxemburg Income Study) excluded from the income concept used. See Björklund, Palme and Svens-son (1995) for a discussion and an example of how to approximate capital gains incomes.
4
In most top income studies, grouped income data have been used, making even the allocation of capital gains to the right individuals difficult. So far, treating capital gains separately over the long-run has so far been possible in Canada and the US, in Sweden and in Finland, and in Spain. Estimates are also available for Japan but only for the top 0.1 per cent (see Moriguchi and Saez, 2010). See Atkinson, Piketty and Saez (2010) for a discussion of the definition of taxable income in the top income literature.
the US. In summing up the evidence from both these studies Saez (2005) concludes that the dramatic increase in top income shares in the US and Canada is “totally independent from the erratic evolution of capital gains” (Saez, 2005, p. 408).
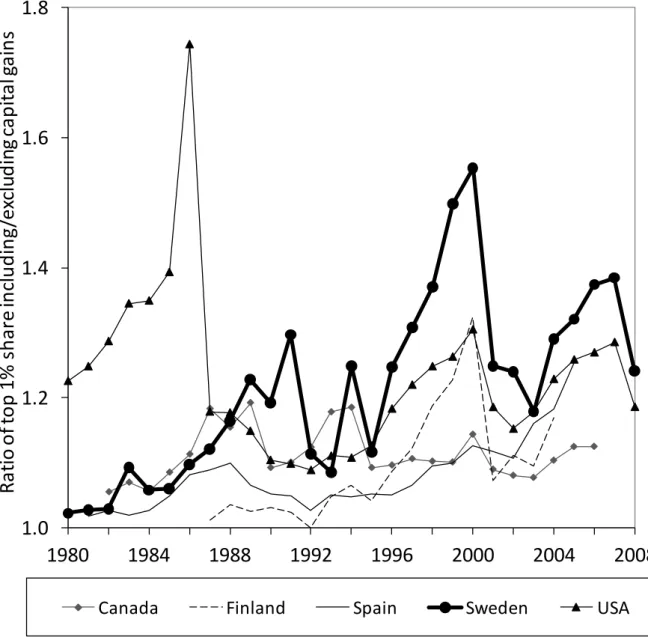
However, in some countries, and in particular during recent years, the role of capital gains in top incomes seems to have increased. Figure 1 displays the ratio between the share of total market income earned by the top income percentile when capital gains are either included or
excluded in countries for which such data are available.5 As is clear from the figure, this ratio
has trended upwards in Finland, Spain and Sweden in recent years.
[Figure 1 about here]
The pattern of an increased role of capital gains to top incomes is especially marked in the case of Sweden. Between 1990 and 2008 the income share of the top one percent when in-cluding realized capital gains is, on average, almost 40 percent higher than when exin-cluding
them.6 This means that the Swedish average yearly difference between excluding and
includ-ing realized capital gains over this period is larger than even annual peaks in the other coun-tries for which we have data, with only exception the U.S. tax reform spike in 1986.
The increased importance of capital gains in Sweden has also received some attention by Sta-tistics Sweden. In recent official publications over the income distribution, capital gains are included and it is noted that as they are concentrated in the top of the distribution they contri-bute to the increased inequality. For example, Gini coefficients since 1991 are on average
about 20 percent higher when including realized capital gains than when excluding them.7
Given the problems with using tax-based income records it is, however, not obvious how to interpret the differences between yearly cross sectional data when including or excluding rea-lized capital gains. Indeed, some of the most obvious spikes in Figure 1, such as the spike in
5 Again, as is standard in the top income literature, these ratios are based on repeated cross sections of the
in-come share of the top percentile. It is precisely the potential problems with this data that will be addressed in this paper. Also, as in the top income literature, the main income concept is total market income, which then in the analyses often is decomposed according to source.
6
Throughout this article (and in most of the literature on top incomes in general) “income share” refer to the share of total (gross) income from all sources before taxes and transfers, including or excluding realized capital gains.
7
This result holds for disposable income Gini index using equivalized household distributions (Statistics Swe-den, 2010, tables 2 and 4).
capital gains in the US in 1986 and the sharp increase in the Swedish capital gains in 1991 and 1994 are known to be linked to tax changes that made it advantageous to sell in these
par-ticular years.8 If the increased inequality when including realized capital gains only reflects
increased incentives to realize gains, or if the cross sectional data is not able to take into ac-count mobility and the possible re-ranking of individuals, then actual inequality may not be as high as suggested by the above series. If, on the other hand realized capital gains are more of a reoccurring addition to individuals already in the top of the distribution then excluding them may underestimate the actual increases in inequality. The main objective of this paper is to determine the true role of capital gains in the increase in income inequality in Sweden that started in the 1980s.
Main focus in the analysis will be on the top of the distribution of market incomes, which is motivated by the cross-sectional Swedish evidence, as well as some international evidence (e.g. Burman and Ricoy, 1997), showing that realized capital gains matters much in the top but make little difference further down in the distribution (see further section 3.1 below). Us-ing a nationally representative individual panel dataset for Sweden over the period 1980–2008 we can use two ways of getting at the key question. First, we compute annual top income shares including capital gains, but ordering individuals according to income either including or excluding capital gains. This answers the question: “to what extent are realized capital gains an addition to the incomes of those who are already in the top (when excluding capital gains)?”. Second, we recalculate top income shares including and excluding realized capital
gains, but this time ordering individuals according to their long-run average incomes using
multi-year windows.9 Doing this allows us to examine the impact of realized capital gains
holding potential cross-sectional mobility constant (over the respective time periods). If high incomes are relatively transitory, concentration should go down as we average over longer periods, and if this is especially true for realized capital gains the difference should be larger when these are included. We then go onto studying who it is that makes large capital gains. Are they dispersed widely across the top decile or concentrated in the very top? Are they in-dividuals who already have most of their income from capital (“rentiers”) or are they persons
8 In the U.S. case the 1986 Tax Reform Act has been subject to many studies. In particular, Auerbach (1988)
shows that this one time spike was due to changed tax incentives (see Saez, Slemrod, and Giertz, 2011, for fur-ther references). In the Swedish case, Björklund (1998) notes that ”…due to changes in the incentives to sell stock, realized capital gains were unusually high in 1991 and 1994” and goes on to treat the values of inequality in those years as outliers.
9
Our main analysis presents estimates using three- and five-year windows. We have constructed even longer averages (up to nine years) but the pattern does not change markedly beyond the five year average.
with high labor earnings (“working rich”)? Has the composition between these groups changed over time?
Our main finding is that the inequality increasing effect of including realized capital gains in Sweden is a real phenomenon, not one driven by problems in the previously used data, and it does alter the picture of Swedish inequality in important ways. Regardless of us ranking indi-viduals according to income including or excluding capital gains, or calculating top shares over longer periods, the effects remain. And the quantitative difference is important. The im-pact on the top percentile share of adding capital gains has grown from increasing by 50 per-cent in 1980 (from 4.3 to about 6.5 perper-cent) to more than 70 perper-cent today (from 4.3 to 7.4
percent).10 However, we also find that the impact of capital gains on income shares is almost
entirely a top percentile phenomenon. In the lower half of the top decile there is essentially no difference depending on how capital gains are treated. Finally, when searching for economic explanations to these results, we study the composition of income of those who earn large capital gains. We find no major trend shift between high wage earners and high capital in-come earners, nor has the top percentile increased its share of overall capital gains since 1980. Instead the capital gains-driven rise in top percentile income shares seems attributable to capi-tal gains becoming a larger part of all incomes in the economy. While we cannot entirely de-termine the drivers of this shift the growth of financial market values certainly appear to be the main contributor to this development.
2 Data and method
In the top income literature the series of top income shares are typically based on tax and oth-er administrative records for groups of earnoth-ers in diffoth-erent classes of income (see Roine and Waldenström, 2008, 2010 for details on the Swedish evidence). The use of income tax data has important advantages, in particular regarding its broad coverage of very high incomes, but
it also has some well-known problems.11 In terms of analyzing realized capital gains using
grouped data, the main problem is that they cannot be appropriately allocated to the right in-dividuals and, perhaps even more importantly, we do not know the extent to which the top
10 These numbers are likely to be lower bounds of this exercise. When comparing top shares in the total tax
sta-tistics and the LINDA sample (which we use in this paper) we see that especially for extreme years the top shares are lower in LINDA.
11 The pros and cons of using tax data when studying top income have been extensively discussed in just about
every paper in this literature and will not be reviewed in any detail here. For the main points, see Atkinson, Piketty and Saez (2010).
group making big capital gain is the same set of individuals from one year to the next. To be able to allocate realized capital gains to the right individuals and also to deal with the issues of mobility in the top we need longitudinal individual data. We therefore use a Swedish micro panel database, LINDA, which contains yearly observations of individuals’ incomes for a nationally representative sample (about three percent of the Swedish population,
approxi-mately 200,000 individuals) starting in 1968.12
Income in LINDA is taken from the exact same tax records that form the bases for the tabu-lated statistics previously used in Roine and Waldenström (2008, 2010), with individuals be-ing the unit of analysis. Consequently the main income concept, total income, is also the same, defined as income from all sources (labor, business and capital) before taxes and
trans-fers with the possibility to add realized net capital gains.13 Unfortunately, however, the
real-ized capital gains data has no information on what type of asset has been sold. Hence, we cannot, for example, distinguish between gains from real and financial assets, something that would obviously be interesting for the economic interpretation of these incomes.
We begin our analysis in 1980. The prime reason for this starting date is that before that year the amounts of realized capital gains were low, both in the economy as a whole and among top earners. Most likely this can be explained by the low returns on the Swedish financial
in-vestments (see further our discussion of this in section 5 below). 14 Prior to 1980 there are thus
no visible differences in the Swedish top income shares depending on how capital gains are treated (see further Roine and Waldenström 2008, 2010).
12 For a closer description of LINDA (Longitudinal INdividual Database), see Edin and Fredriksson (2000). The
estimated top income shares are essentially equal when using LINDA and when using total tax statistics. In years when realized capital gains have been extreme, the top shares in LINDA are somewhat lower, probably because of an underrepresentation of extreme observations. This means that if anything we are likely to underestimate the effect the importance of including realized capital gains for the very top groups when using LINDA There are some other differences as well. For example, the reference total income in the series based on total tax statistics include approximations for income of those not filing tax returns while the reference total in LINDA is the total income of all included individuals. This is, however, not likely to make much of a difference especially not after 1978 when virtually all individuals filed tax returns. Yet another difference lies in the population total which in the main series in Roine and Waldenström (2008, 2010) is the whole adult population aged 16 and above while it is 20 and up in the LINDA sample.
13
We only analyze net capital gains, i.e., gains net of losses, as these are what we observe in the data before 1991 whereas we observe both gross gains and losses from 1991 onwards.
14 We have done all calculations that appear in this text for the full period since 1968 and these confirm that there
is nothing happening in the period before 1980. Below we will discuss to what extent this is likely to reflect real circumstances, or whether it is due to reporting being less complete.
The consistency of our analysis relies on proper measurement of the capital gains in the econ-omy. The data are based on personal tax returns and this implies that the observation of capi-tal gains is closely associated with tax laws. For example, a change in the tax rate or possibili-ty to deduct losses could influence the timing of realizations as well as the share of gains that are taxable. We have therefore studied all changes in the income tax legislation with potential
relevance to the reporting of capital gains.15 Ideally we would also like to assess the coverage
of our tax data with respect to the reported capital gains by comparing them with other sources for estimating aggregate capital gains in the economy. Unfortunately, the Swedish
national accounts and financial accounts do not report capital gains of the households.16
The main tax legislation event during our period of analysis is the Swedish tax reform of 1991, when capital gains went from being added to and taxed at the same rate as all other per-sonal incomes to being taxed at a separate, flat capital income tax rate. For high income earn-ers, the reform effectively cut the capital gains tax rate by an order of magnitude and those who were able to shift their realizations from 1990 to 1991 did so, as seen in the spikes in both the amounts realized and the top income share in 1991 (see Figures 1, 2, 7, and 8). Apart from the comprehensive reform in 1991, there have been a number of changes of the taxation
of capital gains during the study period.17
As outlined in the introduction our basic methodology is to utilize the panel structure of the dataset to investigate the impact of capital gains on inequality. First, we order all individuals aged 20 or above according to their total income when excluding realized capital gains. Main-taining this order we then add realized capital gains to the total income of each individual.
15
In 1977 (before our analysis begins), there was a legislative change in the taxation and reporting of capital gains. Before no gains made on assets held longer than five years were taxable, and for shorter holding periods an increasing fraction of the gains were taxed. From 1977, no exemptions were made but for assets held over two years only 40 percent of the gain was made taxable. The impact of this change on the reported capital gains is not possible to discern but there is no evident shift in the time trend of capital gains during the 1970s. When calculating up pre-1991 gains assuming that half of them were long term (and thus only reported at 40 percent), the overall trend of an increasing share for capital gains is unchanged except for a sharper increase in the late 1980s.
16
In a recent overview of the financial accounts-based statements of assets and debts among Swedish households and private firms, the lack of proper measures of capital gains over and beyond the tax returns-based sources was discussed as being a “blind spot” in the statistics (Bergman, Djerf and Lindström, 2010, p. 89).
17 The right to deduct losses were somewhat restricted in 1989–1990 when only 40 percent of losses on
short-term sales was made deductible (previously they were fully deductible, just as the short-short-term gains were fully taxable). The tax on financial asset gains was lowered from 30 to 25 percent in 1992, and lowered again to 12.5 percent in 1994 but raised to 30 percent in 1995. The tax rate on housing sales was 30 percent 1991–1993, lo-wered to 15 percent in 1994 and raised to 20 percent in 2001. For further details on the capital gains changes, see National Tax Board (2009). Recent tax incidence studies also suggest that these capital gains tax changes were of importance for realization behavior (Daunfeldt, Praski-Ståhlgren and Rudholm, 2010; Jacob, 2011).
Doing so gives an indication of how important the addition of realized capital gains is to those
who already have the highest incomes.18 Second we calculate three- and five-year averages of
total income, both excluding and including realized capital gains.19 We then order individuals
according to their total income over these longer periods and calculate top income shares.
By studying the degree to which shares including and excluding capital gains drop, when av-eraging over longer periods, we get an indication of how much more transitory capital gains are compared to other income. This, in turn, provides an estimate of their impact on actual income. Put differently, if the difference between shares including and excluding capital gains remain important even for long-run averages of individuals’ incomes , this would indicate that realized capital gains in top incomes are not so infrequent after all and that they do, in fact, add substantially to income inequality.
3 Main Results
3.1 The role of capital gains across the distribution of market incomes
Let us begin by looking at the differences in income shares across the full distribution depend-ing on how realized capital gains are treated. Figure 2 clearly illustrates to what an extent this seems to be a top income phenomenon. For all groups below the top percentile the maximum deviation in the yearly cross sectional data is about five percent. For the top decile income shares seem to increase when adding realized capital gains but the rest of the distribution gets a smaller share. This indicates that we should focus on determining what is going on the top of the distribution.
[Figure 2 about here]
3.2 Are capital gains mainly transitory and unrelated to other incomes?
In this section, we study the impact on inequality from adding realized capital gains to total income, both using different income concepts by which we have sorted individuals and when averaging individual incomes over several years. In Figure 3, we show three different
18 This is precisely what Piketty and Saez (2003) do for the U.S. concluding that shares become slightly different
but that this does not affect the overall trend.
19
When calculating multi-year averages, we drop observations for which there is at least one year missing. We have also run the analysis using nine-year average, with similar results as for the five-year average.
sentations of the top percentile income share: one where incomes include capital gains and tax units are ranked according to this concept, a second with incomes including capital gains but where tax units are ranked according to incomes excluding capital gains and a third one where incomes excluding capital gains throughout was used. As the figure clearly shows, realized capital gains appear to be an important addition to total income for those who make up the top percentile even without capital gains, i.e. much of capital gains realized every year seem to go to individuals who are already in the top of the income distribution. Furthermore the impor-tance of this additional income seems to have been growing markedly over time. In fact, in a recent study of the presence of statistically significant structural breaks in top income shares series, Roine and Waldenström (2011) find that when adding capital gains not only is the in-equality trend since 1980 steeper but it begins earlier (in the early 1980s instead of the 1990s, when excluding capital gains).
[Figure 3 about here]
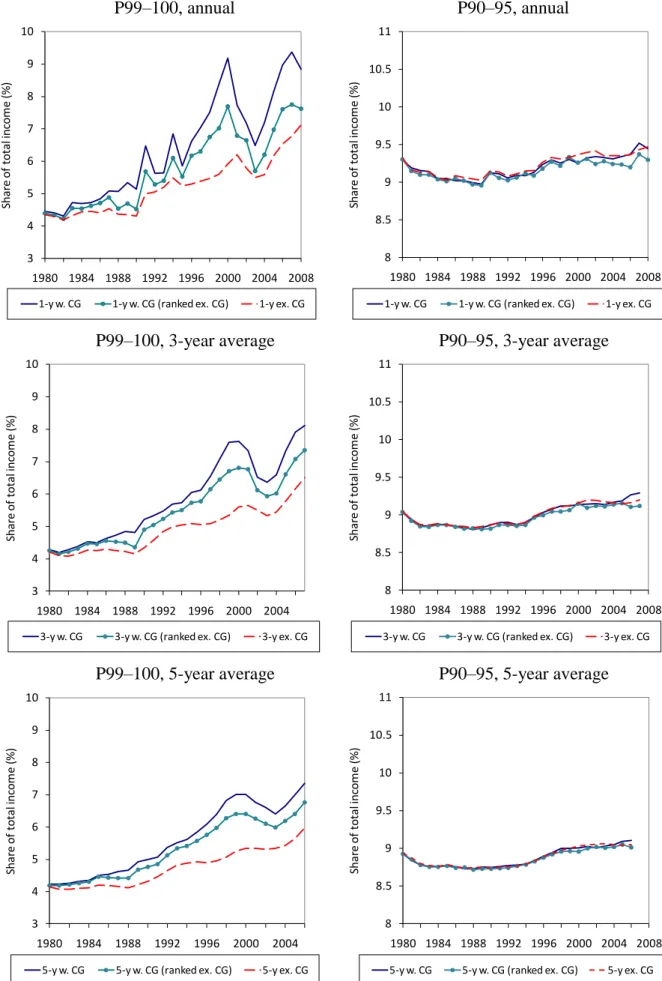
The message of Figure 3 does, however, only indirectly address the concern that capital gains may be transitory and not appropriately measured in the tax data. A more direct way to deal with this issue is to repeat the exercise but this time averaging individual incomes over longer time periods in order to reduce the relative importance of a one-time realization of a capital gain. The left panels of Figure 4 shows the same three income cases as in Figure 3 (i.e., in-cluding capital gains, inin-cluding capital gains but ranking incomes exin-cluding capital gains, and excluding capital gains) but adding to the annual observations incomes averaged over three and five years. If high incomes are relatively transitory we should see a decrease in concentra-tion as we average over longer periods. While this also turns out to be the case, the decrease is limited and instead the strong upward trend in the income share remains in the averaged series ranked according to incomes excluding capital gains. Consequently capital gains among top earners are not only made up of one-time events that create spikes in individual years, but indeed a complementary source of income that increases their share of total income. In short, including realized capital gains makes an important difference to top income inequality in Sweden.
3.3 Are large capital gains a top phenomenon only?
One part of understanding what might lie behind the importance of realized capital gains in the Swedish context is to examine if they are mainly a top phenomenon or if they also make a big difference for broader top groups. As previously stressed in Roine and Waldenström (2008), the top decile is a very heterogeneous group in terms of income composition, in par-ticular with respect to capital being much more important for the top percentile. The right panels of Figure 4 show that this difference within the top is present with respect to the impor-tance of capital gains too. For the lower half of the top decile group (P90–95) the inclusion of realized capital gains makes virtually no difference for their income share. When comparing the standard yearly shares including capital realized capital gains to those where we first rank individuals excluding realized capital gains and then add these gains, we see virtually no dif-ference. The same is true when averaging over longer time periods. When we average over longer time periods income shares fall slightly due to mobility, but again there is no noticea-ble difference with respect to the treatment of realized capital gains.
3.4 Are the capital gains associated with labor earnings or wealth returns?
Another interesting issue is to what extent the rise in capital gains in the top income percentile are associated with labor earnings e.g. as part of a capital-based remuneration scheme, or if they are returns to personal wealth. Unfortunately, the Swedish tax data do not detail what assets e.g. stock or homes, which have been sold with a capital gain. Indirectly, however, oth-er items in the tax registoth-ers allow us to acquire information about this issue. For example, one could plausibly assert that a necessary condition for capital gains to emanate from financial asset sales is a prior ownership of such assets. We do have some information about such own-ership. In the Swedish Wealth Register, available since 1999, individual asset holdings are specified across a range of categories. Moreover, income statements on interest earnings and dividends also indicate ownership of income-yielding financial assets. Based on these back-ground facts we make a crude distinction of individuals within the top percentile group; we call them “working rich”, “rentiers”, and “hybrids”. The working rich are those who get at least two thirds of their total income from labor income, the rentiers get at least two thirds from interest and dividends, and the hybrid group consists of those who are neither working
rich nor rentiers according to these definitions.20
20 These particular definitions are of course arbitrary and we have no particular theory for why to set the cut off
at 2/3 of total income (excluding capital gains) from a particular source. For our purposes this does not matter
Figure 5 shows that seen over the whole period there is no evidence of significant trends in the relative income shares of these three categories of income earners within the top percen-tile. Clearly, the working rich is the dominant group representing roughly 80 percent of all incomes while rentiers and hybrids represent about one tenth each. There seems to be a rather dramatic shift in recent years with the share of working rich falling and the rentier group be-coming larger but overall compositional shifts across these groups do not match the observed rise in the top percentile share when capital gains are included.
[Figure 5 about here]
But perhaps such a compositional shift should not be expected to materialize in terms of total incomes, as displayed in Figure 5, but rather in terms of realized capital gains? When examin-ing the share of all capital gains earned by the top percentile (not shown graphically), we find two things. First, it is strikingly high: around 20–25 percent of all capital gains were earned
by the top percentile even when ranked according to incomes excluding capital gains. Second,
the share exhibits no evident time trend since 1980. Also when we split this relatively stable share between the three subgroups, working rich, rentiers, and hybrids, a similar picture emerges. While there is variation between single years within these groups, there are no ob-vious trends that can match the distinct capital gains-driven rise in the top percentile income share that was documented in Figure 3.
3.5 Have capital gains become a more important source of income in the economy?
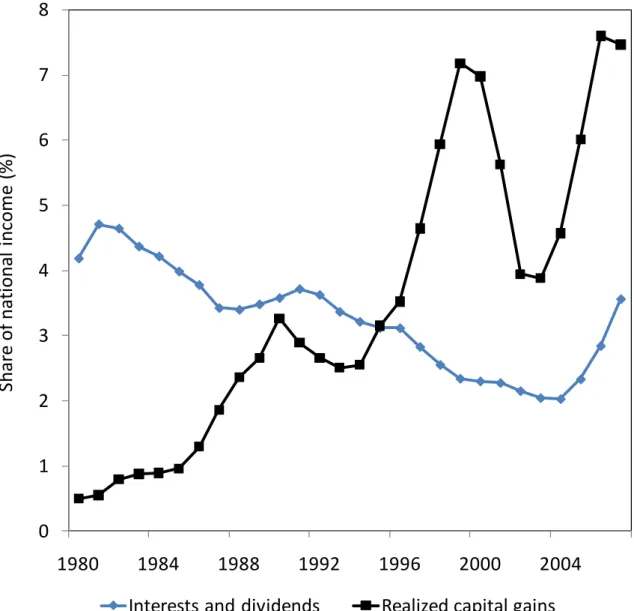
Our starting point was the fact that realized capital gains have had a marked impact on the rise in top income shares since 1980. The subsequent analysis showed no signs of capital shares becoming more important for any particular top group over time. This leads us to a final can-didate explanation: have capital gains become a more important source of income in the economy as a whole and, thus, that those who have always earned a lot of capital gains have simply benefited from such a development? As Figure 6 shows this is indeed the case.
earning wage income or mainly earning capital income. We have tried different cut-offs (1/10, 1/5) and the prin-cipal difference lies in a shift of levels while the trend (which is what we mainly care about here) is not sensitive to our choice of cut off.
Since the early 1980s, interest and dividend income has declined steadily from about four percent of total income to just above two percent in recent years, though with a marked in-crease since 2004. Realized capital gains, by contrast, has inin-creased from being well below one percent of total income in 1980 to, on average, being above four percent in recent years with a maximum of almost eight percent today. The fact that top income earners have kept their share of this rapidly growing income component explains why their income shares have grown so much more when including realized capital gains.
[Figure 6 about here]
4 The Swedish Transition – a possible explanation?
Our main results above conclusively show that the role of capital gains in top income shares in Sweden has grown substantially since 1980. While questions about the economic explana-tions for this increase remain, our analysis of how these gains are spread across the top decile, how they are divided between different types of income earners, and how this has changed over time, offer some indications.
For example, we rule out real estate realizations as main driver of the increased capital gains in the top percentile. Even though we have seen important increases in real estate values over
this period the magnitudes are simply not large enough.21 Furthermore, real estate sales are
less frequent than financial assets transactions, implying that differences between yearly esti-mates and top shares averaged over longer time periods should be larger than what they ap-pear to be if this was the main driver of what we observe. Also, if real estate was a key factor we would expect differences to show for groups below the top percentile as well.
Another unlikely primary explanation is a capital-based “topping-up” of high wage incomes. The Swedish tax reform in 1991 introduced a much lower marginal taxation of capital income (including capital gains) than on high wages, which certainly made it attractive to device strategies where part of wages would take the form of capital gains. If this were the case Swe-den would be an “Anglo-Saxon country in disguise” in the sense that increased wage inequali-ty would lie behind the increased top income shares, but that this would not show up in
21
Between 1981 and 1990, the real price of one- or two-family houses increased by one percent per year and between 1990 and 2000 they did not increase at all in real terms (+0.01 percent) (Statistics Sweden, 2001).
ported wages but in capital gains.22 However, then we would also expect a higher (and grow-ing) share of all realized capital gains in the top to be earned by top wage earners and, also, that individuals with high capital income be earning a relatively smaller share of capital
gains.23 This is, as we saw above, not the case. By this we do not mean to say that there are no
capital gains related to work effort, or that no remuneration schemes include things that in the end show up as realized capital gains. However, in a recent survey of executive remuneration in Sweden, Bång and Waldenström (2009) show that fixed salary represents about two thirds of Swedish top executive pay while the remaining part is predominantly annual bonuses. Long-term incentive plans, including stock- or options-based compensation plans play a
rela-tively minor role, in the case of options mainly for tax reasons.24 Hence, based on the
availa-ble evidence from executive pay in Sweden it is not likely that the increased share of capital gains in total income is directly explained by an increasing substitution of traditional salaries for capital-based compensation in the top groups.
The explanation we find most plausible relates to what we might call “the Swedish Transi-tion”. In 1980 Sweden was a highly regulated economy with virtually no stock market activi-ty, regulated capital and credit markets, and with a debate about so-called “wage earner funds”, which were schemes designed to shift corporate ownership over to trade unions by way of increased corporate taxes. In a series of reforms, starting with the deregulation of capi-tal markets and international capicapi-tal movements in the 1980s, tax reforms in the mid-1980s and early 1990s and the abolishment of the wage-earner funds in the early 1990s, all these things changed dramatically. The impacts of these profound changes have been the subject of
extensive discussions and research.25 In this study, we are primarily interested in its effect on
22
As pointed out in many previous studies the increase in Anglo-Saxon top income shares, in particular in the UK and in the US, have primarily been driven by increases in top wages. See Atkinson and Piketty (2007) and (2010) for overviews.
23 These statements are not just mirror images of each other. It would be possible for an individual to show up as
someone earning a small share of income from wages if that person received close to all his work related benefits as a capital gain, but it is not possible (nor would it be desirable) for a person with most of his income from capi-tal to show up as such in our data. Hence, given that individuals with substantial shares of their tocapi-tal income from capital have kept their share of realized capital gains, at the same time as the share of total capital gains has increased in the economy, capital income earners have benefitted from the underlying reason for the increase just as much as high wage earners.
24 Before 1990, stock options hardly existed in Sweden, and after the 1991 tax reform, they were made quite
disadvantageous for their holders. The reason is that although any options-related capital gains were taxed at a relatively low rate (a flat rate around 30 percent), their assessed “tax benfit value” (before execution) to the hold-er was taxed as labor income at a much highhold-er marginal rate (around 52–57 phold-ercent). Furthhold-ermore, in the case of
a sharp stock price drop, perhaps making the options worthless, the holder would generate a net loss because of
the previous wage taxes paid without any subsequent capital gain.
25
See, e.g. Swedenborg, Freeman and Topel (1997, 2009) and Lindbeck (1997). Domeij and Flodén (2010) study inequality trends over the period 1978–2004 focusing on earnings inequality both pre and post tax. They
financial asset values since we believe these are the most important contributors to the trend in capital gains realizations among top earners.
Swedish stock market values have experienced dramatic changes that parallel this transition. In the twenty years between 1960 and 1979, the Swedish economy grew at a real rate of 3.4
percent per year but at the same time real stock prices decreased by 2.6 percent on average.26
A number of factors contributed to this poor stock market development, and among the most important ought to have been the strict rules for issuing and floating new shares, listing and
participation in the trading at the Stockholm Stock Exchange.27 After around 1980, the
Swe-dish stock market went into a booming period with average annual real price increases of 13 percent during the 1980s and over 16 percent in the 1990s. As a reference, real stock prices on the New York Stock Exchange increased annually by a relatively modest 3 percent in the 1980s and 6 percent in the 1990s. All of this is clearly visible in Figure 7, which shows real stock prices in Sweden and the U.S. as well as real Swedish GDP between 1960 and 2008.
[Figure 7 about here]
Linking these stock market developments to capital gains realizations in the income top re-quires information about individual stock ownership and transactions and personal incomes. In particular, how dispersed was stock ownership in the income top in the early years of our study period? Unfortunately, we lack detailed knowledge about these things in the early years. One reliable source of information is a study of the Swedish wealth distribution in 1985, which finds that 44 percent of the persons in the top income decile held exchange-listed shares with an average value of SEK 287,000 and given what we know about concentration of stock ownership in the wealth distribution (the top percentile of the wealth distribution held almost half of the total privately held stock, with an average value of 523,000 SEK) it seems
likely that much of this was concentrated to the top.28 Interestingly, this matches the starting
capital a person would need in order to keep realizing the average capital gain of the top in-come percentile every year from 1980 onwards, given that the capital grows according to the find clear inequality increases in market outcomes (i.e. pre tax and transfers) but also that this increase is much smaller when looking at disposable income.
26
Real returns, i.e., price gains plus dividends increased at a rate of one percent per year.
27 For a description of how Swedish stock market regulations hampered activities and values and how the
devel-opments from 1980 onwards changed all this, see Hägg (1989, p. 57–100).
28
Jansson and Johansson (1987, p. 91–97). The average value among all earners in the top decile (including also those not owning shares) is SEK 123,000.
stock market index.29 From the Wealth Register we have similar data at the end of our study period. In year 2000, over 80 (88) percent of all income earners in the top income decile (per-centile) held corporate stock, with average values of SEK 584,000 (SEK 2,484,000).
A final piece of information from Figure 7 is the amounts of capital gains realized by the top percentile alongside the stock price index at the Stockholm Stock Exchange. Both the visual pattern and the correlation coefficient of 0.95, are clear indications of a close link between stock prices and realized capital gains.
5 Conclusion
In this paper we have shown that including income from realized capital gains significantly adds to the recent increase in top income inequality in Sweden. We have also shown that the effect of capital gains has become increasingly important over time since 1980. Using a large, nationally representative, individual panel dataset we have shown that this result remains re-gardless of ranking individuals excluding or including capital gains before adding capital gains to total income, as well as when computing long-run averages of individual incomes..
The distributional impact of capital gains also appears to be exclusively a top income pheno-menon. While capital gains are, of course, also earned at lower income levels, they make
vir-tually no difference for the income shares of groups below the top percent. When relating
capital gains to the general income composition of those who earn them, essentially contrast-ing high wage earners and capital income earners, we find no trends over time in their respec-tive share of total capital gains. Instead, their increasing importance can be found in the fact that total capital gains as a share of all incomes have increased substantially since 1980. This paired with the fact that their distribution is highly skewed seems to be the most likely expla-nation to their increasing contribution to inequality.
These findings are important for some key questions about how to interpret the recent in-creases in top income shares in Sweden. In the U.S. context it seems clear that the main driv-ing force behind top income growth is increasdriv-ing wage inequality. In the European, and espe-cially in the Swedish case, there is much less evidence of such pronounced wage dispersion
29 Our back of the envelope calculations show that one would need about 270,000 SEK in 1980 (with 300,000
one would still have 1,000,000 left in 2004 and starting with 400,000 one would have about 3,000,000 left in 2004).
(though wage inequality also has gone up). If the capital gains that we have found to make a big difference to inequality in Sweden stem from work effort and are in effect “hidden” wage income then the Swedish development is much closer to the recent Anglo-Saxon development than what previous studies suggest. If, on the other hand, the main reason for growing inequa-lity in Sweden is more related to a skewed distribution of private wealth and large increases in asset values the story is a different one.
Given our data we cannot conclusively discriminate between these scenarios, but as pointed out above the strongest channel seems to be personal wealth holdings, and especially owner-ship of corporate stock that has increased in value substantially over the past decades. While these fortunes may indeed emanate from high labor incomes as part of a successful career, the role of capital-based remuneration schemes (e.g. stock- or option-plans in executive pay) have most likely been relatively minor in Sweden, making a direct channel from labor income to capital gains less likely.
Finally, our results also raise a number of questions regarding the role of realized capital gains elsewhere, especially in the other Scandinavian countries. After all, the changes described above as the Swedish transition, have in various ways happened in these countries too. It would, therefore, be interesting to explore whether capital gains have been more important than previous studies suggest, or if Sweden indeed is different in this respect (and if so, to understand why).
References
Atkinson, Anthony B. and Thomas Piketty (Eds.) (2007), Top Incomes over the Twentieth
Century: A Contrast between European and English-Speaking Countries, Oxford: Ox-ford University Press.
Atkinson, Anthony B. and Thomas Piketty (Eds.) (2010), Top Incomes: A Global Perspective.
Volume II, Oxford: Oxford University Press.
Atkinson, Anthony B, Thomas Piketty and Emmanuel Saez (2010), “Introduction”, in:
Atkin-son, Anthony B. and Thomas Piketty (Eds.), Top Incomes: A Global Perspective.
Vo-lume II, Oxford: Oxford University Press.
Auerbach, A. J. (1989), “Capital Gains Taxation and Tax Reform”, National Tax Journal 42
(3): 391–401.
Bång, Joakim and Daniel Waldenström (2009), “Rörlig ersättning till vd – vad säger
forsk-ningen?”, Ekonomisk Debatt 37(5), 41–56.
Bergman, Bo, Olle Djerf and Anders Lindström (2010), Tillgångar, skulder och kapitalvinster
– Balansräkningarnas roll underskattas i statistik och analys, Statistics Sweden, Stock-holm.
Björklund, A., “Income Distribution in Sweden: What Is the Achievement of the Welfare
State?”, Swedish Economic Policy Review, 5, 1998.
Björklund, Anders, Mårten Palme and Ingemar Svensson (1995), “Tax Reforms and Income
Distribution: An Assessment Using Different Income Concepts”, Swedish Economic
Policy Review, 2, 229–266.
Burman, Leonard E. and Peter D. Ricoy (1997): Capital Gains and the People Who Realize
Them, National Tax Journal 50 (3): 427–451.
Daunfeldt, S.-O., Praski-Ståhlgren, U. and N. Rudholm, “Do High Taxes Lock-In Capital
Gains? Evidence from a Dual Income Tax System”, Public Choice 145(1): 25, 2010.
Domeij, David and Martin Flodén (2010), “Inequality Trends in Sweden 1978–2004”, Review
of Economic Dynamics 13(1), 179–208.
Edin, Per-Anders and Peter Fredriksson (2000), ”LINDA - Longitudinal INdividual DAta for Sweden”, Working Paper 2000:19, Department of Economics, Uppsala University.
Haig, Robert M. (1921). The Federal Income Tax, New York: Columbia University Press.
Hägg, Ingemund (Ed.) (1989), Riskkapitalmarknaden, Stockholm: SNS Förlag.
Jacob, Martin (2011), ”The Effect of Introducing a Proportional Capital Gains Tax – Evidence from Sweden”, Working Paper, WHU – Otto Beisheim School of Management.
Jansson, Kjell and Sten Johansson (1987), Förmögenhetsfördelningen 1975–1987, Rapport om utvecklingsarbete med redovisning av förmögenhetsfördelningen bland hushållen i Sverige, Statistics Sweden.
Leigh, Andrew (2009), “Top Incomes”, in Wiemer Salverda, Brian Nolan and Timothy
Smeeding (Eds.), The Oxford Handbook of Economic Inequality, (Oxford, Oxford
Uni-versity Press).
Lindbeck, Assar (1997), “The Swedish Experiment”, Journal of Economic Literature 35(3),
1273–1319.
Moriguchi, Chiaki and Emmanuel Saez (2008), “The Evolution of Income Concentration in
Japan, 1885–2002: Evidence from Income Tax Statistics”, Review of Economics and
Statistics 90(4), 713–734.
National Tax Board (2009), Skattestatistisk årsbok 2009, Stockholm: Elanders.
Piketty, Thomas and Emmanuel Saez (2003), “Income Inequality in the United States, 1913–
1998”, Quarterly Journal of Economics 118(1), 1–39.
Roine, Jesper and Daniel Waldenström (2008), “The Evolution of Top Incomes in an
Egalita-rian Society: Sweden, 1903–2004”, Journal of Public Economics 92(1–2), 366–387.
Roine, Jesper and Daniel Waldenström (2010), “Top Incomes in Sweden over the Twentieth
Century”, in: Atkinson, Anthony B. and Thomas Piketty (Eds.), Top Incomes: A Global
Perspective. Volume II, Oxford: Oxford University Press.
Roine, Jesper and Daniel Waldenström (2011), “Common Trends and Shocks to Top
In-comes: A Structural Breaks Approach”, Review of Economics and Statistics,
forthcom-ing.
Saez, Emmanuel (2005), “Top Incomes in the United States and Canada over the Twentieth
Century”, Journal of the European Economic Association Papers and Proceedings
3(2-3), 402-411.
Saez, E., J. Slemrod and E. Giertz, “The Elasticity of Taxable Income with Respect to
Mar-ginal Tax Rates: A Critical Review”, Journal of Economic Literature, forthcoming.
Saez, E. and M. R. Veall (2005), “The Evolution of High Incomes in Northern America:
Les-sons from Canadian Evidence”, American Economic Review 95(3), 831–849.
Simons, Henry (1938), Personal Income Taxation: the Definition of Income as a Problem of
Fiscal Policy. Chicago: University of Chicago Press.
Statistics Sweden, (2001). Fastighetsprisstatistik 2000. Småhus, hyreshus, industrifastigheter,
lantbruk och obebyggda tomer. Prices of real estates in Sweden 2000, Statistics Swe-den.
Statistics Sweden (2010), Income distribution survey 2008, Statistiska Meddelanden HE 21
Swedenborg, Birgitta, Richard Freeman and Robert Topel (1997), The Welfare State in Tran-sition: Reforming the Swedish Model, Chicago: University of Chicago Press.
Swedenborg, Birgitta, Richard Freeman and Robert Topel (2010), Reforming the Welfare
State: Recovery and Beyond in Sweden, Chicago: University of Chicago Press.
Veall, M., “Top Income Shares in Canada: Updates and Extensions”, WP, McMaster Univer-sity.
Figure 1: Ratio of top percentile shares including and excluding capital gains in five countries.
Source: Table A1.
1.0
1.2
1.4
1.6
1.8
1980
1984
1988
1992
1996
2000
2004
2008
Ra
ti
o
o
f t
o
p
1
%
s
h
ar
e
in
cl
u
d
in
g/
ex
cl
ud
in
g
ca
p
it
al
g
ai
n
s
Figure 2: Swedish top income percentile with different capital gains status and ranks.
Source: Table A3.
3
4
5
6
7
8
9
10
1980
1984
1988
1992
1996
2000
2004
2008
Sh
ar
e
o
f t
o
ta
l i
n
co
m
e (
%)
Figure 3: The role of capital gains in the Swedish income distribution.
Source: Table A2.
0.9
1.0
1.1
1.2
1.3
1.4
1.5
1.6
1980
1984
1988
1992
1996
2000
2004
2008
R
ati
o
be
tw
ee
n
incom
e
sha
re
s
incl
. a
nd
e
xc
l.
ca
pi
ta
l g
ai
ns
P0-25 P25-50 P50-75 P75-90 P90-99 P99-100Figure 4: Income shares, averaged 1, 3 and 5 years, different rankings and fractiles.
P99–100, annual P90–95, annual
P99–100, 3-year average P90–95, 3-year average
P99–100, 5-year average P90–95, 5-year average
Note and source: “CG” denotes including realized capital gains. Table A2 and A3.
3 4 5 6 7 8 9 10 1980 1984 1988 1992 1996 2000 2004 2008 Sh ar e o f to tal in co m e (% )
1-y w. CG 1-y w. CG (ranked ex. CG) 1-y ex. CG
8 8.5 9 9.5 10 10.5 11 1980 1984 1988 1992 1996 2000 2004 2008 Sh ar e o f to tal in co m e (% )
1-y w. CG 1-y w. CG (ranked ex. CG) 1-y ex. CG
3 4 5 6 7 8 9 10 1980 1984 1988 1992 1996 2000 2004 Sh ar e o f to tal in co m e (% )
3-y w. CG 3-y w. CG (ranked ex. CG) 3-y ex. CG
8 8.5 9 9.5 10 10.5 11 1980 1984 1988 1992 1996 2000 2004 2008 Sh ar e o f to tal in co m e (% )
3-y w. CG 3-y w. CG (ranked ex. CG) 3-y ex. CG
3 4 5 6 7 8 9 10 1980 1984 1988 1992 1996 2000 2004 Sh ar e o f to tal in co m e (% )
5-y w. CG 5-y w. CG (ranked ex. CG) 5-y ex. CG
8 8.5 9 9.5 10 10.5 11 1980 1984 1988 1992 1996 2000 2004 2008 Sh ar e o f to tal in co m e (% )
Figure 5: Income share of the top percentile, divided into subgroups.
Note: Earners are ranked according to total income excluding capital gains. “Working Rich” are those in the top
percentile whose labor income represents at least 2/3rds of their total income excluding capital gains. “Rentiers” are those with interest earnings and dividends exceeding 2/3rds of their total income excluding capital gains, and “Hybrids” are all others. Three-year averages are used.
Source: Table A4.
0
10
20
30
40
50
60
70
80
90
100
1980
1984
1988
1992
1996
2000
2004
Sha
re
o
f
to
p
pe
rc
ent
ile
i
ncom
es
(
%)
Figure 6: Aggregate shares of “Interests and dividends” and “Realized capital gains”.
Note: Data based on calculations in LINDA.
Source: See Table A6.
0
1
2
3
4
5
6
7
8
1980
1984
1988
1992
1996
2000
2004
Shar
e
of
nat
iona
l
inc
om
e
(%)
Figure 7: Top percentile capital gains, stock prices in Stockholm and New York and GDP.
Note: Income earners are ranked according to total income including capital gains. Capital gains (right y-axis)
are in thousands of Swedish kronors and in 2008 prices. Real stock prices and real GDP are indices with 1960 as base year.
Source: See Table A7 and A8.
0
200
400
600
800
1000
1200
0
2
4
6
8
10
12
14
1960
1970
1980
1990
2000
A
ve
ra
ge
c
api
ta
l g
ai
ns
(
1
0
0
0
's
S
EK)
Ind
ex
(
1
9
6
0
=
1
)
Real stock price Stockholm Real stock price New York
Table A1: Total income shares when excluding or including realized capital gains, for five countries.
USA Canada Sweden Finland Spain
Ex Inc Ratio Ex Inc Ratio Ex Inc Ratio Ex Inc Ratio Ex Inc Ratio
1980 8.18 10.02 1.23 4.44 4.35 1.02 1981 8.03 10.02 1.25 4.41 4.29 1.03 7.50 7.63 1.02 1982 8.39 10.80 1.29 7.9 8.3 1.05 4.30 4.19 1.03 7.75 7.95 1.03 1983 8.59 11.56 1.34 7.8 8.3 1.07 4.72 4.32 1.09 7.65 7.79 1.02 1984 8.89 11.99 1.35 7.9 8.3 1.06 4.69 4.43 1.06 7.61 7.81 1.03 1985 9.09 12.67 1.39 7.9 8.6 1.08 4.72 4.46 1.06 7.75 8.12 1.05 1986 9.13 15.92 1.74 8.1 9.0 1.11 4.84 4.41 1.10 8.21 8.88 1.08 1987 10.75 12.66 1.18 8.3 9.8 1.18 5.09 4.54 1.12 3.40 3.44 1.01 8.40 9.15 1.09 1988 13.17 15.49 1.18 9.2 10.7 1.15 5.07 4.36 1.16 3.63 3.76 1.04 8.36 9.19 1.10 1989 12.61 14.49 1.15 9.9 11.7 1.19 5.34 4.35 1.23 3.69 3.78 1.02 8.47 9.01 1.06 1990 12.98 14.33 1.10 9.4 10.3 1.09 5.14 4.31 1.19 3.52 3.63 1.03 8.37 8.80 1.05 1991 12.17 13.36 1.10 9.4 10.4 1.10 6.48 4.99 1.30 3.49 3.57 1.02 8.08 8.47 1.05 1992 13.48 14.67 1.09 9.4 10.5 1.12 5.63 5.05 1.11 3.65 3.65 1.00 8.21 8.42 1.03 1993 12.82 14.24 1.11 9.6 11.4 1.18 5.64 5.20 1.09 3.84 4.02 1.05 7.83 8.22 1.05 1994 12.85 14.23 1.11 9.7 11.5 1.18 6.84 5.48 1.25 3.54 3.77 1.06 7.89 8.27 1.05 1995 13.53 15.23 1.13 10.0 11.0 1.09 5.85 5.24 1.12 4.07 4.24 1.04 7.89 8.29 1.05 1996 14.11 16.69 1.18 10.6 11.6 1.10 6.61 5.30 1.25 3.95 4.29 1.09 7.93 8.32 1.05 1997 14.77 18.02 1.22 11.3 12.5 1.11 7.04 5.38 1.31 4.46 5.00 1.12 8.03 8.55 1.07 1998 15.29 19.09 1.25 11.8 13.1 1.10 7.51 5.48 1.37 4.77 5.66 1.19 8.17 8.94 1.09 1999 15.87 20.04 1.26 12.1 13.3 1.10 8.38 5.59 1.50 5.73 7.03 1.23 8.62 9.47 1.10 2000 16.49 21.52 1.31 12.8 14.7 1.14 9.19 5.92 1.55 5.44 7.20 1.32 8.84 9.95 1.13 2001 15.37 18.22 1.19 12.8 13.9 1.09 7.74 6.20 1.25 6.08 6.52 1.07 8.80 9.82 1.12 2002 14.64 16.87 1.15 12.4 13.4 1.08 7.17 5.79 1.24 5.82 6.47 1.11 8.54 9.46 1.11 2003 14.87 17.53 1.18 12.3 13.3 1.08 6.48 5.50 1.18 5.85 6.40 1.09 8.59 9.96 1.16 2004 16.08 19.75 1.23 12.7 14.0 1.10 7.20 5.58 1.29 6.00 7.01 1.17 8.62 10.20 1.18 2005 17.42 21.92 1.26 13.2 14.8 1.12 8.16 6.18 1.32 8.79 11.02 1.25 2006 17.98 22.82 1.27 13.8 15.5 1.12 8.98 6.53 1.37 2007 18.29 23.50 1.29 13.8 15.7 1.14 9.38 6.77 1.38 2008 17.67 20.95 1.19 8.84 7.12 1.24
Note and source: Income earners are ranked according to the income concepts used. Series are from Atkinson and Piketty (2010) except Canada (Veall, 2010).
Table A2: Total income shares when including or excluding realized capital gains in Sweden.
P0–25 P25–50 P50–75 P75–90 P90–99 P99–100
Inc Ex Ratio Inc Ex Ratio Inc Ex Ratio Inc Ex Ratio Inc Ex Ratio Inc Ex Ratio
1980 6.64 6.56 1.01 18.27 18.33 1.00 29.05 29.13 1.00 22.80 22.83 1.00 18.81 18.80 1.00 4.44 4.35 1.02 1981 6.95 6.88 1.01 18.64 18.68 1.00 28.92 29.03 1.00 22.59 22.66 1.00 18.50 18.45 1.00 4.41 4.29 1.03 1982 7.03 6.85 1.03 18.89 18.88 1.00 28.99 29.19 0.99 22.38 22.54 0.99 18.40 18.36 1.00 4.30 4.19 1.03 1983 7.71 7.53 1.02 18.62 18.69 1.00 28.33 28.71 0.99 22.04 22.18 0.99 18.59 18.57 1.00 4.72 4.32 1.09 1984 7.77 7.76 1.00 18.74 18.80 1.00 28.37 28.49 1.00 21.94 22.07 0.99 18.49 18.45 1.00 4.69 4.43 1.06 1985 7.89 7.91 1.00 18.98 18.99 1.00 28.10 28.30 0.99 21.78 21.88 1.00 18.52 18.47 1.00 4.72 4.46 1.06 1986 7.91 7.92 1.00 19.03 19.08 1.00 27.92 28.20 0.99 21.74 21.84 1.00 18.55 18.55 1.00 4.84 4.41 1.10 1987 8.03 8.00 1.00 19.07 19.20 0.99 27.66 28.03 0.99 21.59 21.69 1.00 18.56 18.55 1.00 5.09 4.54 1.12 1988 8.14 7.84 1.04 19.19 19.51 0.98 27.51 28.09 0.98 21.55 21.74 0.99 18.54 18.46 1.00 5.07 4.36 1.16 1989 8.18 8.20 1.00 19.19 19.52 0.98 27.35 27.79 0.98 21.44 21.74 0.99 18.50 18.40 1.01 5.34 4.35 1.23 1990 8.08 8.03 1.01 19.02 19.32 0.98 27.38 27.77 0.99 21.61 21.89 0.99 18.78 18.69 1.00 5.14 4.31 1.19 1991 8.01 8.15 0.98 18.66 19.16 0.97 26.50 27.23 0.97 21.13 21.51 0.98 19.22 18.95 1.01 6.48 4.99 1.30 1992 7.96 8.00 1.00 19.15 19.31 0.99 27.05 27.35 0.99 21.24 21.39 0.99 18.96 18.90 1.00 5.63 5.05 1.11 1993 7.68 7.69 1.00 19.14 19.31 0.99 27.18 27.36 0.99 21.31 21.46 0.99 19.06 18.98 1.00 5.64 5.20 1.09 1994 7.40 7.46 0.99 18.75 19.17 0.98 26.63 27.26 0.98 21.04 21.44 0.98 19.34 19.19 1.01 6.84 5.48 1.25 1995 7.49 7.52 1.00 19.05 19.24 0.99 27.04 27.32 0.99 21.36 21.54 0.99 19.21 19.14 1.00 5.85 5.24 1.12 1996 6.97 7.05 0.99 18.58 18.98 0.98 26.90 27.49 0.98 21.36 21.71 0.98 19.58 19.47 1.01 6.61 5.30 1.25 1997 6.67 6.79 0.98 18.33 18.87 0.97 26.77 27.53 0.97 21.37 21.82 0.98 19.83 19.61 1.01 7.04 5.38 1.31 1998 6.68 6.83 0.98 18.40 19.00 0.97 26.52 27.39 0.97 21.17 21.70 0.98 19.72 19.60 1.01 7.51 5.48 1.37 1999 6.65 6.89 0.97 18.01 18.94 0.95 25.96 27.29 0.95 20.87 21.63 0.96 20.13 19.66 1.02 8.38 5.59 1.50 2000 6.66 6.92 0.96 17.71 18.71 0.95 25.63 27.06 0.95 20.71 21.57 0.96 20.10 19.82 1.01 9.19 5.92 1.55 2001 6.83 6.94 0.98 18.08 18.50 0.98 26.23 26.87 0.98 21.13 21.54 0.98 19.99 19.96 1.00 7.74 6.20 1.25 2002 6.83 6.95 0.98 18.31 18.67 0.98 26.49 27.03 0.98 21.30 21.67 0.98 19.89 19.90 1.00 7.17 5.79 1.24 2003 7.42 7.52 0.99 18.41 18.71 0.98 26.54 27.00 0.98 21.30 21.57 0.99 19.85 19.69 1.01 6.48 5.50 1.18 2004 7.24 7.40 0.98 18.18 18.68 0.97 26.31 27.02 0.97 21.18 21.61 0.98 19.88 19.71 1.01 7.20 5.58 1.29 2005 6.98 7.18 0.97 17.80 18.48 0.96 25.87 26.83 0.96 20.98 21.54 0.97 20.21 19.79 1.02 8.16 6.18 1.32 2006 6.77 7.04 0.96 17.45 18.34 0.95 25.47 26.72 0.95 20.84 21.53 0.97 20.50 19.84 1.03 8.98 6.53 1.37 2007 6.49 6.81 0.95 17.10 18.14 0.94 25.22 26.68 0.95 20.80 21.57 0.96 21.01 20.02 1.05 9.38 6.77 1.38 2008 6.35 6.51 0.97 17.43 18.00 0.97 25.86 26.70 0.97 21.07 21.57 0.98 20.45 20.10 1.02 8.84 7.12 1.24
Table A3: Income shares of top income percentile (P99–100), with incomes and rankings ei-ther including or excluding capital gains, using 1-, 3- and 5-year averages, 1980–2008 (%).
Income: Ranking:
Income incl. capital gains same
Income excl. capital gains same
Income incl. capital gains Income excl. capital gains
Average: 1-year 3-year 5-year 1-year 3-year 5-year 1-year 3-year 5-year
1980 4.44 4.28 4.22 4.35 4.21 4.14 4.40 4.25 4.19 1981 4.41 4.20 4.23 4.29 4.09 4.08 4.33 4.15 4.18 1982 4.30 4.28 4.26 4.19 4.08 4.07 4.23 4.21 4.21 1983 4.72 4.39 4.31 4.32 4.15 4.11 4.56 4.31 4.26 1984 4.69 4.53 4.35 4.43 4.26 4.11 4.54 4.47 4.30 1985 4.72 4.50 4.50 4.46 4.26 4.20 4.62 4.46 4.46 1986 4.84 4.63 4.53 4.41 4.30 4.18 4.71 4.56 4.43 1987 5.09 4.73 4.62 4.54 4.25 4.15 4.89 4.53 4.41 1988 5.07 4.85 4.67 4.36 4.22 4.12 4.53 4.50 4.41 1989 5.34 4.82 4.93 4.35 4.15 4.22 4.70 4.36 4.67 1990 5.14 5.22 4.99 4.31 4.35 4.32 4.51 4.90 4.76 1991 6.48 5.33 5.06 4.99 4.57 4.47 5.68 5.04 4.85 1992 5.63 5.48 5.37 5.05 4.84 4.65 5.28 5.23 5.12 1993 5.64 5.69 5.51 5.20 4.98 4.82 5.39 5.44 5.35 1994 6.84 5.74 5.61 5.48 5.04 4.88 6.11 5.50 5.41 1995 5.85 6.05 5.84 5.24 5.09 4.92 5.52 5.74 5.57 1996 6.61 6.11 6.09 5.30 5.06 4.90 6.17 5.78 5.76 1997 7.04 6.55 6.39 5.38 5.08 4.95 6.30 6.14 5.97 1998 7.51 7.08 6.83 5.48 5.20 5.07 6.75 6.44 6.28 1999 8.38 7.59 7.00 5.59 5.35 5.25 7.02 6.70 6.41 2000 9.19 7.62 7.01 5.92 5.60 5.33 7.70 6.81 6.40 2001 7.74 7.34 6.77 6.20 5.65 5.34 6.79 6.76 6.25 2002 7.17 6.52 6.60 5.79 5.51 5.32 6.64 6.12 6.10 2003 6.48 6.36 6.41 5.50 5.33 5.34 5.69 5.93 5.99 2004 7.20 6.59 6.65 5.58 5.44 5.43 6.20 6.02 6.18 2005 8.16 7.33 6.99 6.18 5.77 5.64 6.98 6.61 6.40 2006 8.98 7.91 7.36 6.53 6.16 5.98 7.61 7.09 6.77 2007 9.38 8.11 6.77 6.50 7.76 7.36 2008 8.84 7.12 7.63
Note: To begin in 1980, the three- and five-year averages include incomes since 1978 and 1976, respectively.
Table A4: Income shares of working rich, rentiers and hybrids in top percentile, 1980–2008, three-year averages, (%).
Groups within the top percentile:
“Working Rich” “Rentiers” “Hybrids”
1980 88.92 7.36 3.72 1981 87.99 8.47 3.53 1982 87.13 9.21 3.65 1983 86.46 10.16 3.38 1984 85.44 11.21 3.35 1985 85.77 10.61 3.62 1986 85.07 12.03 2.90 1987 85.35 11.46 3.19 1988 85.64 10.24 4.12 1989 87.48 8.34 4.18 1990 81.53 11.86 6.61 1991 81.68 12.35 5.96 1992 81.47 11.23 7.30 1993 83.94 8.79 7.27 1994 83.96 8.66 7.38 1995 82.92 8.54 8.54 1996 80.68 9.33 9.99 1997 78.80 10.16 11.04 1998 79.44 11.25 9.31 1999 81.23 8.09 10.68 2000 83.09 9.41 7.50 2001 81.25 6.39 12.36 2002 82.08 6.98 10.93 2003 81.86 8.66 9.48 2004 83.17 10.76 6.07 2005 75.66 15.13 9.21 2006 69.98 17.61 12.41 2007 64.68 21.20 14.12
Note: For definition of income earner groups, see Figure 5 and the text.
Table A5: Population totals for income from “interests and dividends” and “realized capital gains” as share of total income (%).
Interest and dividends (% of national income)
Realized capital gains (% of national income) 1980 4.19 0.50 1981 4.71 0.55 1982 4.65 0.79 1983 4.37 0.87 1984 4.22 0.89 1985 3.99 0.96 1986 3.78 1.29 1987 3.43 1.86 1988 3.40 2.36 1989 3.48 2.65 1990 3.58 3.27 1991 3.72 2.89 1992 3.63 2.66 1993 3.37 2.51 1994 3.22 2.55 1995 3.12 3.15 1996 3.12 3.52 1997 2.83 4.65 1998 2.55 5.94 1999 2.34 7.18 2000 2.30 6.98 2001 2.28 5.63 2002 2.15 3.95 2003 2.05 3.88 2004 2.03 4.57 2005 2.33 6.02 2006 2.84 7.60 2007 3.56 7.47
Table A6: Real stock price and GDP indexes, 1960–2008 (1960 base year). Average capital gains
in top percentile Stockholm stock price NYSE stock price Real GDP
1960 1.00 1.00 1.00 1961 0.97 1.01 1.06 1962 0.85 1.16 1.10 1963 1.01 1.08 1.16 1964 1.14 1.25 1.24 1965 1.15 1.39 1.29 1966 0.84 1.48 1.31 1967 0.85 1.30 1.36 1968 13.67 1.12 1.41 1.41 1969 29.72 1.10 1.45 1.48 1970 23.54 0.79 1.21 1.57 1971 16.66 0.89 1.19 1.59 1972 18.29 0.93 1.27 1.63 1973 29.00 0.86 1.40 1.69 1974 36.45 0.75 1.04 1.74 1975 30.52 0.89 0.70 1.79 1976 28.55 0.83 0.88 1.81 1977 28.87 0.62 0.90 1.78 1978 31.16 0.67 0.73 1.81 1979 28.99 0.60 0.74 1.88 1980 22.88 0.65 0.72 1.91 1981 28.82 0.93 0.77 1.91 1982 38.09 1.15 0.63 1.93 1983 99.32 1.75 0.74 1.96 1984 58.11 1.43 0.82 2.05 1985 56.72 1.71 0.82 2.09 1986 90.93 2.49 0.96 2.15 1987 129.72 2.18 1.20 2.23 1988 226.32 3.12 1.09 2.29 1989 251.35 3.64 1.19 2.35 1990 222.01 2.26 1.35 2.37 1991 422.98 2.21 1.22 2.35 1992 175.12 2.16 1.52 2.32 1993 147.43 3.20 1.54 2.27 1994 365.24 3.27 1.63 2.36 1995 171.42 3.78 1.56 2.46 1996 332.02 5.23 2.01 2.49 1997 459.32 6.43 2.43 2.55 1998 567.35 7.19 3.01 2.65 1999 855.56 11.76 3.84 2.77 2000 1023.10 10.21 4.26 2.89 2001 550.53 8.30 3.84 2.92 2002 475.42 5.10 3.25 2.99 2003 383.65 6.53 2.49 3.05 2004 565.64 7.65 2.95 3.18 2005 740.21 9.98 3.18 3.28 2006 933.00 12.31 3.21 3.42 2007 1078.32 11.09 3.53 3.51 2008 732.81 6.37 3.54 3.50
Source: Swedish GDP and stock prices Swedish Riksbank (www.riksbank.se/research/historicalstatistics),
WORKING PAPERS
Uppsala Center for Fiscal Studies Editor: Håkan Selin
2009:1 Sören Blomquist and Håkan Selin, Hourly Wage Rate and Taxable Labor Income Responsiveness to Changes in Marginal Tax Rates. 31 pp.
2009:2 Luca Micheletto, Optimal nonlinear redistributive taxation and public good provision in an economy with Veblen effects. 26 pp.
2009:3 Håkan Selin, The Rise in Female Employment and the Role of Tax
Incentives. An Empirical Analysis of the Swedish Individual Tax Reform of 1971. 38 pp.
2009:4 Håkan Selin, Marginal tax rates and tax-favoured pension savings of the self- employed Evidence from Sweden. 32 pp.
2009:5 Tobias Lindhe and Jan Södersten, Dividend taxation, share repurchases and the equity trap. 27 pp.
2009:6 Che-Yan Liang, Nonparametric Structural Estimation of Labor Supply in the Presence of Censoring. 48 pp.
2009:7 Sören Blomquist, Vidar Christiansen and Luca Micheletto, Public Provision of Private Goods and Nondistortionary Marginal Tax Rates: Some further
Results. 42 pp.
2009:8 Laurent Simula and Alain Trannoy, Optimal Income Tax under the Threat of Migration by Top-Income Earners. 26 pp.
2009:9 Laurent Simula and Alain Trannoy, Shall We Keep Highly Skilled at Home? The Optimal Income Tax Perspective. 26 pp.
2009:10 Michael Neugart and Henry Ohlsson, Economic incentives and the timing of births: Evidence from the German parental benefit reform 2007, 21 pp.
2009:11 Laurent Simula, Optimal Nonlinear Income Tax and Nonlinear Pricing: Optimality Conditions and Comparative Static Properties, 25 pp.
2009:12 Ali Sina Onder and Herwig Schlunk, Elderly Migration, State Taxes, and What They Reveal, 26 pp.
2009:13 Ohlsson, Henry, The legacy of the Swedish gift and inheritance tax, 1884-2004, 26 pp.
2009:14 Onder, Ali Sina, Capital Tax Competition When Monetary Competition is Present, 29 pp.