Children’s Physical Activity
:
The
Contribution of Playing and Walking
Roger L. Mackett* and James Paskins
Centre for Transport Studies, University College London, London, UK
This paper draws on research in which 200 children were fitted with motion sensors and asked to keep travel and activity diaries. The findings show that walking and playing away from home can contribute significantly to children’s volume of physical activity, with consequent implica-tions for their health. Not only do both playing and walking provide high levels of physical activ-ity, they are linked to other behaviours which further augment the level of physical activity. Children who walk rather than use the car tend to be generally more active than other children, and children tend to be more active when they are out of their homes than when they are in them. The findings are placed in the context of other research about children’s travel and physi-cal activity, and conclusions drawn about the need to reverse current trends in children’s pat-terns of travel and physical activity. Ó 2007 The Author(s). Journal compilation Ó 2007 National Children’s Bureau.
Introduction
There is growing concern about the decreasing volumes of physical activity in the whole population including children. There is considerable evidence that lack of physical activity can lead to a number of adverse health conditions including obesity (Department of Health, 2004). In Great Britain, the percentage of children aged 2–10 who are obese increased from 9.9% in 1995 to 13.7% in 2003. Over the same period, the percentage who were overweight rose from 22.7% to 27.7% (Jotangia and others, 2005).
Biddle and others (1998) recommended that all young people participate in physical activity of at least moderate intensity for 1 h per day. This is now the guideline recommended by the Department of Health (2004). Biddle and others (1998) stated that moderate intensity activi-ties for children may include brisk walking, cycling, swimming, most sports or dance, and that such activities may be carried out as part of transportation, physical activity, games, sport, recreation, work or structured exercise and, for younger children, as part of active play.
The purpose of this article is to demonstrate how walking and playing contribute to chil-dren’s levels of physical activity using results from a project entitled ‘Reducing chilchil-dren’s car use: the health and potential car dependency impacts’. The research has been carried out in the Centre for Transport Studies at University College London (UCL) in collaboration with others including Hertfordshire County Council, with fieldwork being carried out in Hertford-shire, an area immediately north of London. The project has been described in more detail elsewhere (Mackett and others, 2004, 2005). The research was approved by the UCL Research Ethics Committee.
Methodology
A major strand of the project was the assessment of travel and activity patterns by fitting chil-dren with portable motion sensors and asking them to keep diaries of their travel and activities. Eight schools in Hertfordshire were selected on the basis of their willingness to co-operate. All children in years 6 and 8 were invited to take part. Year 6 (age 10–11) is the top year of primary school and year 8 (age 12–13) is the second year of secondary school. The children were briefed by the researchers and then given a letter to take home to their parents or guardians. The letter explained about the project and sought written permission for their children to participate. All children who wished to take part, who had parental permission, were included in the study. This was partly to avoid selection bias and partly to avoid disap-pointing children who wished to participate. Up to 20 children could take part at any one time, a constraint imposed by the quantity of equipment available and the time required to manage the data collection. The participating children all had their height and weight mea-sured, because these values needed to be input into the accelerometers, along with their age and gender, in order to convert the results from arbitrary ones to meaningful ones, using cal-ibrated functions programmed into the software. From their height and weight it was possi-ble to calculate their body mass index (BMI). BMI is defined as weight in kilograms divided by the square of height in metres. It is a measure of body composition which may be an explanatory variable for some of the differences in physical activity levels. Care needs to be taken in interpreting BMI as a measure of body composition especially for children (Centers for Disease Control and Prevention, 2007).
The equipment used was the RT3 tri-axial accelerometer (Stayhealthy of Monrovia, CA, USA), which measures movements in three directions. The RT3s combine all three accelera-tion vectors to produce an overall vector magnitude expressed in terms of activity counts. These can be converted into activity calories using formulae programmed into the equipment using data on the age, gender, weight and height of the child. Activity calories are calories used in undertaking physical activity. The RT3s can also convert activity calories to total cal-ories, i.e. including the calories that are used by the body to function and develop even when the person is passive, by adding on a constant based on the physical characteristics of the person. Activity calories are used in this work. The RT3s are the size of a small pager and are worn around the waist in a purpose-made holster on a belt. They can be worn for all events except those which would make them wet. They were set to record movements on a minute-by-minute basis. An example of the output is shown in Figure 1. Trost and others (2000) have shown that 4 days of monitoring of physical activity is required. Rowlands and others (2004) have carried out validation tests for the RT3 monitor for men and boys, and found that it is a valid tool for measuring physical activity in boys as well as men, but that it can give higher counts than other physical activity monitors. In this study, the volunteers wore the monitors from a Wednesday to a Monday, with data being collected for the 4 days Thursday to Sunday. In presenting the results, the data for the weekdays have been multi-plied by 2.5 and added to the weekend data to provide an estimate of physical activity for 1 week.
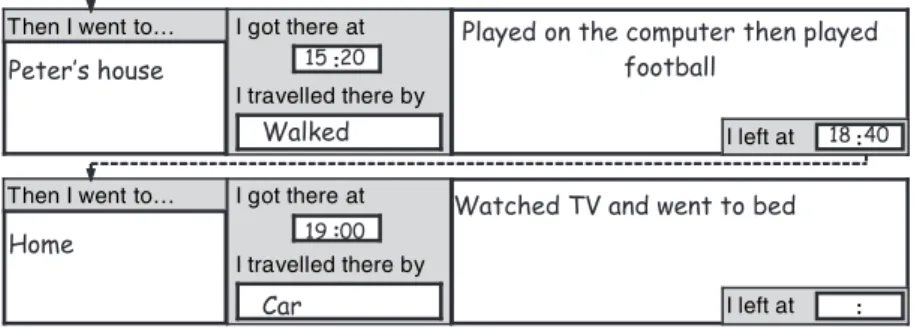
The children were asked to complete a travel and activity diary for the 4 days. An example extract from the diary is shown in Figure 2. The RT3 output was used as a visual aid by the child and a researcher to refine the times of specific events identifiable from the diary. The
events recorded in the children’s activity and travel diaries were classified, using the typol-ogy shown in Mackett and others (2005) and put into an Access database. Because of the ambiguity of the word ‘activity’, which can mean either any event that a person attends or imply the level of energy consumed in attending an event, the word ‘event’ will be used to describe activities such as being at school or an out-of-home activity. For the school day, the only type of lesson that is differentiated is physical education (PE) or games lessons, as these are likely to be significantly more active than other lessons. Periods not in class have been classified as ‘break’, including the period before entering school, lunch time and morn-ing break. The children’s events outside home and school are divided into three categories: ‘Structured out-of-home events’, ‘Unstructured out-of-home events’ and ‘Shopping etc.’ ‘Structured out-of-home events’ are events such as football lessons and youth clubs organ-ised by adults to provide formal training or lessons for children, often after school, and will be referred to as ‘clubs’. ‘Unstructured out-of-home events’ are events in which children decide what to do, and are essentially playing, and so will be referred to as ‘playing’. ‘Shop-ping etc.’ includes not only shop‘Shop-ping but also meals out, visits to the doctor and visits to the cinema. The data were collected in March and May in 2002 and 2003.
Results
Two hundred children at the eight schools in Hertfordshire were involved in the study. Five children provided inadequate data for analysis, leaving a sample of 195, split fairly evenly between boys and girls. They were in two year groups: year 6 (age 10–11) and year 8 (age
I left at : :
I got there at
:
I travelled there by Then I went to…
I left at : :
I got there at
:
I travelled there by Then I went to…
Figure 2: An example extract from a travel and activity diary.
0.0 0.5 1.0 1.5 2.0 2.5 3.0 3.5 4.0 4.5 5.0 5.5 07:00 08:00 09:00 10:00 11:00 12:00 13:00 14:00 15:00 16:00 17:00 18:00 19:00 20:00 Time of day
Activity calories (kcal)
12–13). Their characteristics are shown in Table 1. Not surprisingly, the older children are taller and heavier than the younger ones. They also have a higher BMI. Within each age group, the girls are heavier and have higher BMI values, on average. In year 6, the girls are slightly taller, which may be partly due to being slightly older, on average.
From the travel and activity diaries it is possible to establish which modes of travel are used to attend the various events. Table 2 shows the number of events of each type that the children attended, broken down by mode of travel used to reach them. It can be seen that car and walk are used almost equally, but there are some interesting differences. Much of the walking is to school, whereas car use is spread more evenly over various events. The largest category of car use is to go shopping etc. Car tends to be used to go to clubs, while walking is more popular for going out to play. It can also be seen that other modes are not used very much, and much of their use, particularly bus, is to school. It is interesting to note that one of the major uses of travel by children to reach other people’s homes is split fairly evenly between walk and car.
The mean intensity (activity calories consumed per minute) for each of the events in the clas-sification system was calculated by dividing the total number of activity calories consumed on the various events by the time spent on them for each child. Table 3 shows the intensities. Examining travelling first, children consume over twice as many activity calories per minute walking than travelling in the car. Few young children travelled by bus, and bicycling was not a common mode of travel for any group, so the intensity values for bus and bicycle must be treated with caution. It can be seen that, overall, walking comes after PE or games lessons and ball games in intensity, and higher than all the other club and playing events. Some of the children are heavier than others, and so will consume more activity calories simply
mov-Table 1: Characteristics of the children
Year 6 (age 10–11) Year 8 (age 12–13)
Boys Girls Boys Girls
Number of children 54 58 42 41
Mean age in years 10.7 10.8 12.8 12.8
Mean height in cm 145.6 147.2 157.7 157.6
Mean weight in kg 39.2 40.9 48.5 50.1
Mean BMI 18.4 18.7 19.3 20.1
BMI, body mass index.
Table 2: Number of events each week per child classified by mode of travel to the activity
Walk Car Bicycle Bus Other Total
At school 2.6 1.4 0.1 0.4 0.0 4.6 Clubs 0.3 0.8 0.0 0.0 0.0 1.2 Playing 0.7 0.4 0.0 0.0 0.0 1.2 Shopping etc. 0.6 1.7 0.1 0.0 0.1 2.4 Other homes 1.5 1.4 0.1 0.1 0.0 3.1 Other 0.3 0.3 0.0 0.0 0.0 0.7 Total 5.9 6.1 0.4 0.6 0.1 13.1
ing their body weight. When walking is compared with all the other events in terms of inten-sity, taking into account the children’s body weight, the difference is statistically significant (t¼10.55, d.f.¼194, P< 0.0005, two-tailed). Break times at school are very important for children’s energy consumption. Overall, it can be seen that clubs have an intensity of 1.7 activity calories per minute while playing has a value of 2.2. This difference is statistically significant (t¼2.56, d.f. ¼206.55, P¼0.011, two-tailed). When the children’s weight is taken into account, the difference is still statistically significant (t¼3.06, d.f.¼206.52,
P¼0.003, two-tailed, equal variances not assumed). When the 46 children who both went to clubs and played events are examined, the mean intensity is 1.5 activity calories per min-ute for the former and 2.3 for the latter. This difference is statistically significant (t¼3.68, d.f.¼45, P¼0.001, two-tailed). If the intensities are divided by the child’s weight, the respective intensities become 0.034 and 0.052 activity calories per kg of body weight per minute. This difference has even greater statistical significance (t¼3.88, d.f.¼45,
P< 0.0005, two-tailed). The lowest intensity event is being at home, which uses 0.6 activity calories per minute. This does not include sleeping because the children did not wear the monitors in bed. The overall intensity for all other events, outside the child’s own home, is 1.1 activity calories per minute (SD¼0.5). This difference is statistically significant (t¼
Table 3: Intensity of various events undertaken by children in activity calories per minute
Year 6 Year 8
Overall Boys Girls Boys Girls
At school PE or games lesson 2.7 2.6 3.2 4.2 3.1 Other lessons 0.6 0.5 0.7 0.7 0.6 Break 2.0 1.6 2.4 2.1 1.9 Overall 1.0 0.8 1.2 1.2 1.0 Clubs
Structured ball games 2.0 2.3 2.5 2.6 2.4 Other structured sport 2.0 1.4 2.7 1.9 1.8
Organisations 1.6 1.2 1.8 0.8 1.4
Tuition 0.7 0.9 0.4 0.5 0.7
Overall 1.5 1.4 2.3 1.8 1.7
Playing
Unstructured ball games 1.9 1.1 3.4 3.2 2.8 Other unstructured events 1.6 1.9 2.1 3.2 2.1
Other outdoor play 1.5 1.6 1.5 2.1 1.6
Overall 1.6 1.7 2.8 2.8 2.2
Shopping etc. 1.1 1.1 1.3 1.2 1.1
At own home 0.6 0.5 0.7 0.6 0.6
At other people’s homes 0.9 0.8 1.3 0.8 0.9 Travel Walking 1.8 1.9 2.7 3.0 2.3 Car 0.9 0.9 1.1 1.1 1.0 Bicycle 1.6 1.2 2.0 2.3 1.7 Bus – 1.2 1.6 1.5 1.5 Overall 1.3 1.3 1.9 2.0 1.6 Other Physical work 0.7 1.7 1.3 1.0 1.1 Waiting 1.0 0.9 1.0 1.3 1.1 Overall 0.8 1.0 1.1 1.3 1.1 Overall 0.8 0.9 1.2 1.0 0.9
Source: RT3s and activity and travel diaries.
17.80, d.f.¼194, P< 0.0005). If the intensities are adjusted by body weight, the respective values become 0.013 and 0.026 activity calories per kg of body weight per minute (t¼19.47, d.f.¼194,P< 0.005, two-tailed). This suggests that children are nearly twice as active when out of their own homes as they are when there.
It has been shown that walking is not very far below PE or games lessons in intensity, but the durations may be different. The time spent in PE or games lessons per week is 70 min while 153 min a week is spent walking, mainly to and from school. One way to make a com-parison is to see how many calories would be consumed over a week. Table 4 shows the number of calories that would be spent in five journeys to and from school and in 2 h of PE or games lessons, obtained by scaling the figures given in the diaries and from the RT3 sensors. The travel to school is classified by the mode used for the greatest duration. For example, most bus trips include an element of walking to and from the bus stop. The energy consumed spent in this walking is included in the bus trips. None of the younger children travelled to school by bus, and no older girls cycled. Tests were carried out on the effects of the motion of the car on the outputs from the RT3. The car was found to have negligible effects because the acceleration and deceleration rates of a car are very much less than those of a person. Much of the calorie expenditure in car travel is spent walking to and from the car. Two hours of PE or games lessons has been used because the National Healthy School Standard Guidance (Department of Health, Department for Education and Employment, 2000) includes Standard 3.5 which says that schools can meet the requirements of the Standard by offering all pupils, regardless of their age and ability, 2 h of physical activity a week within and outside the national curriculum. Because there are fewer secondary schools than primary schools, the older children will live further from school than the younger children, on aver-age. This may partly explain why they spend more considerably calories walking to school than the younger children.
It is possible to examine the relationship between the intensity of various events and the mode of travel used to travel there, as shown in Table 5. For the events that occurred at school, it is the mode used to travel to school. It can be seen that, overall, the children who walk use 1.7 activity calories per minute and those who go by car use 1.3. When individual events are examined, there are some larger differences, some of which are statistically signif-icant (in each case equal variances are not assumed). For example, for PE or games lessons,
Table 4: A comparison of the number of activity calories consumed in a week trav-elling to and from school with 2 h of PE or games lessons
Year 6 Year 8
Overall Boys Girls Boys Girls
Walk to and from school 209 201 522 625 374 Car to and from school 152 160 172 226 165 Bicycle to and from school 433 365 411 – 414 Bus to and from school – – 420 346 380 Overall travel to and from school 193 183 455 472 305 PE or games lessons for 2 h 326 307 388 499 371
Source: RT3s and activity and travel diaries.
Note: the journeys to and from school have been classified by the mode used for the greatest duration where more than one mode was used.
the walkers use 3.5 activity calories a minute, compared with 2.4 for the car users (t¼3.02, d.f.¼84.60, P¼0.002, one-tailed), while for clubs, the walkers use 2.4 and the car users consume 2.0 activity calories per minute (t¼1.84, d.f.¼84.88, P¼0.035, one-tailed); for shopping etc., the values are 1.5 and 1.0 activity calories per minute respectively (t¼3.09, d.f.¼86.61, P¼0.002, one-tailed) and for being at another house the values are 1.1 and 0.8 activity calories per minute respectively (t¼2.37, d.f.¼122.41, P¼0.01, one-tailed). For most types of event, those who walk to them are more energetic when at the event than those who travel by car. The only group for whom the converse is sometimes true is the year 6 girls.
It seems that children who walk more consume more calories not only in travelling, but also when they arrive at their destination. This can be taken further by dividing the children into two groups: those who spend more time walking than they do in the car, and those who Table 5: Intensity of various events in activity calories per minute, classified by the mode of travel used to arrive
Year 6 Year 8
Overall
Boys Girls Boys Girls
Walk Car Walk Car Walk Car Walk Car Walk Car
PE or games lesson 3.0 2.3 2.7 2.4 3.6 2.9 4.7 2.4 3.5 2.4 Other school lessons 0.6 0.5 0.5 0.4 0.6 0.7 0.8 0.5 0.6 0.5
School break 2.0 1.8 1.6 1.5 2.3 2.4 2.4 1.2 2.0 1.7 Clubs 1.5 1.3 1.3 1.5 2.2 1.8 - 2.0 1.7 1.6 Playing 1.7 1.6 1.4 1.8 3.4 2.5 2.7 2.3 2.4 2.0 Shopping etc. 1.1 0.8 1.5 0.9 1.6 1.1 1.6 1.2 1.5 1.0 At another home 1.0 0.8 0.8 0.7 1.9 1.0 0.9 0.8 1.1 0.8 Overall 1.5 1.2 1.3 1.2 2.1 1.6 2.1 1.2 1.7 1.3
Source: RT3s and activity and travel diaries.
PE, physical education.
Table 6: Intensity of various events in activity calories per minute, classified by whether they travel more by walk-ing or by car
Year 6 Year 8
Overall
Boys Girls Boys Girls
Walk Car Walk Car Walk Car Walk Car Walk Car
PE or games lesson 2.5 2.8 3.4 2.3 3.4 3.0 3.5 4.9 3.3 3.0 Other school lessons 0.6 0.5 0.5 0.4 0.7 0.7 0.7 0.7 0.6 0.6
School break 2.0 2.0 1.7 1.5 2.7 2.0 1.8 2.4 2.1 1.9 Clubs 2.0 1.3 1.4 1.4 2.8 1.8 1.6 1.9 2.0 1.5 Playing 1.7 1.6 1.8 1.6 2.8 2.9 3.5 1.9 2.5 1.9 Shopping etc. 1.3 0.9 1.6 0.9 1.2 1.4 1.2 1.1 1.3 1.0 At own home 0.6 0.5 0.6 0.5 0.7 0.7 0.6 0.6 0.6 0.6 At another home 1.1 0.9 1.0 0.7 1.6 1.0 0.8 0.9 1.1 0.8 Travel 2.3 1.5 2.4 1.6 2.3 1.5 2.4 1.6 2.1 1.2 Overall 0.9 0.8 0.9 0.7 1.3 1.1 1.1 1.0 1.0 0.9
Source: RT3s and activity and travel diaries.
spend more time in the car than they do walking. This is shown in Table 6. It can be seen that, when all the children are considered together, for all the events except sitting in class, those who walk more also spend more calories per minute than those who are taken by car more. For six out of the nine event categories the differences are statistically significant. When the comparison is made for the individual age-gender cohorts the picture is not quite so clear-cut, partly because the sample size is smaller. In all cases, not surprisingly, those who walk more than they use the car consume more calories when travelling than those who use the car more. For 19 of the 32 combinations of events and age-gender cohorts, those who walk more have higher intensities while for seven cases, the car users tend to have higher intensities. In the other six they are the same. The majority of cases, where the car users have higher intensities than the walkers, are for the year 8 girls, which is the smallest group.
A possible explanation for the difference between the intensities of activities undertaken by the children who walk more and those who use the car more may be that they have different body compositions. Putting it simplistically, there may be fatter children who use the car more and are generally less energetic, and less fat children who walk more and are more energetic. A comparison was made between the two sets of children (those who walk more and those who use the car more) for each age-gender cohort. Of the four cohorts, the older boys showed the expected relationship, that is, with the car users with a statistically signifi-cant higher BMI. However, the younger boys showed exactly the opposite relationship, with the walkers having a higher BMI. The two girls’ cohorts showed no significant differences. From this it is concluded that no significant relationship can be established between body composition and tendency to use the car or walk.
Discussion
The key findings from this work are:
d Walking provides much more physical activity than travelling by car.
d Children who walk to events tend to be much more active than those who travel by car. d Playing provides more physical activity than organised clubs.
d Children tend to walk when they go out to play whereas they tend to be taken to clubs
by car.
d Children are much more active during school breaks than at other times at school, other
than in organised PE or games lessons.
d Children are less active when they are at home than when they are out of it.
Because this is a cross-sectional study, it is not possible to draw direct conclusions about time trends in these factors, but evidence from the literature, as discussed below, helps to explain how underlying changes in society have led to shifts from the more active events to the less active ones, as indicated in the findings above.
Children are walking less than they used to. The percentage of trips by children who were walked declined from 47% in 1985/86 to 33% in 2005, while the percentage of trips by chil-dren that are by car increased from 35% to 55%, over the same period, with even greater shares of the total distance travelled. Cycling has also shown a major decline, from 4% to 2% of children’s trips (Department for Transport, 2006). The major factor causing the
decrease in walking is the growth in car use. There are a number of causal factors including increasing car ownership, the general process of urban decentralisation, school admission policies, women’s employment and childcare arrangements, and concerns about children’s safety. For example, the number of children in Britain aged 5–10 years travelling to school alone fell from 21% in 1985/86 to 6% in 2005 (Department for Transport, 2006). Much of the general increase in car use is associated with meeting the needs of children, particularly for short trips (Mackett, 2001, 2003). It is likely that these trends will continue (Mackett, 2002).
Playing has been shown above to be a major contributor to children’s physical activity, consuming more calories per minute than the equivalent structured event. This is probably because structured activity is usually some form of lesson or training and so involves time spent listening rather than being active. Also time will be spent changing into and out of special clothing. In comparison, half an hour of playing can be a non-stop event for 30 min. Unfortunately, from the physical activity perspective, the emphasis is shifting from playing to more structured events. The National Institute of Child Health and Development (2000) reported a survey on about 3600 American children under the age of 13 carried out in 1997 and compared it with a similar survey in 1981. It was found that, in 1997, chil-dren spent about 3 h a week less in unstructured play and outdoor events than they did in 1981, and that they had more than doubled the time they spent in organised sports to more than 5 h a week over the same period. It was also found that, on average, children whose mothers worked outside the home tended to spend more time in school and day care and less time in free play than other children do. This suggests that one factor caus-ing the reduction in children’s outdoor play may be the increascaus-ing participation of women in the workforce.
Children also play when they are at school during break time. This was shown to be much more active than time spent in lessons other than PE or games. In Britain there is increasing pressure for children to enhance their academic achievement by spending more time study-ing. One way to do this is to reduce the length of breaks. The findings here suggest that this will lead to a reduction in children’s volume of physical activity.
This research showed that children are about twice as active, on average, when they are out of the home as when they are in it (and this excludes sleeping). The attractions to children of staying at home are increasing with the expansion of home entertainment technology so that children now have a range of opportunities at home to listen to music, play electronic games and watch multichannel television. These may have reduced the relative attractiveness of going out to play.
In this study, it was found that walking is one of the best forms of physical activity that children can do, and that for some children walking to and from school can consume more calories than the recommended quantity of physical activity and games lessons. Walking has the advantage that it requires no preparation, no special equipment or venues, and no expen-diture of money. It may seem surprising that children are not more active in PE or games lessons than has been shown here, but this is quite possible. In the USA (US Department of Health and Human Services, 1996) only 19% of all high school students report being physi-cally active for 20 min or more in daily PE classes. There was a decline from 81% to 70% in the percentage of American high school students who enrolled in PE and reported being physically active for at least 20 min during the first half of the 1990s. However, Fairclough
and Stratton (2005) have shown that PE can make a significant contribution to children’s regular physical activity if lessons are planned and delivered with moderate and vigorous physical activity in mind.
The comparison between walking to and from school with 2 h of PE or games lessons was made because the proportion of children’s total energy expenditure that was spent travelling to school was fairly small. Just walking to school may not make a large enough contribution to a child’s total physical activity to produce health benefits. Sleap and Warburton (1993) looked at 1133 children aged 4–11 and drew that conclusion. However, Tudor-Locke and others (2002) have calculated, using a longitudinal survey of 1171 Russian children aged 7–13, that including walking to school as a source of physical activity increases the number of children who reach the recommended levels of physical activity. It has been estimated, on the basis of data on 1518 Filipino adolescents included in the Cebu Longitudinal Health and Nutrition Survey (Tudor-Locke and others, 2003), that the difference in physical activity in travelling by car rather than walking to school could lead to a weight gain of 2–3 lb (about 1 kg) a year, all other things being equal. More generally, Tudor-Locke and others (2001) argued that walking to school offers an opportunity for physical activity which has been lar-gely overlooked in favour of the assessment of the time spent by children in more vigorous events.
This is reinforced by the findings of this study that walking is related to greater physical activity in other events. Table 5 shows that for most events, those who walk to them are more energetic when there than those who travel by car. The only group for whom the con-verse is sometimes true is the year 6 girls, and this may reflect greater use of the car to escort them to some very energetic events, and parental reluctance to allow them out to walk much. Similar results are shown by Cooper and others (2003) who found that boys who walked to school were more active after school and in the evening, compared with those who travelled to school by car.
The direction of causality between the amount of walking and the volume of physical activity is not clear. It may be that walking has helped make the children healthier and so more active in other events. Alternatively, taking part more actively in the various events than the car-using children may make them keener to walk. Or, there may be a third independent factor, such as parental behaviour, which makes them more active in events which also influences their travel choices. Fogelholm and others (1999) found that parental inactivity was a strong and positive predictor of child inactivity in a study of 129 obese children and 142 normal weight children plus their parents. Brustad (1993) found that children with two active parents were six times as active as those with inactive parents. Freedson and Evenson (1991) concluded that children had activity pat-terns similar to that of their parents regardless of whether their parents were active or inactive.
A major factor underlying these trends has been the growth in car use, and so there is a need to change children’s attitudes to sustainable travel. However, as Davison and others (2003) argued, making children aware of such issues is not necessarily sufficient to change attitudes or behaviour. It is important to target such messages, with boys more responsive to health and fitness messages and girls to the social aspects of travel, and walking and using buses.
Conclusions
A major objective of this article has been to show that walking and playing away from the homes can contribute significantly to children’s volume of physical activity. This seems to be the case. Not only do both playing and walking provide high levels of physical activity, they have consequential links which reinforce the volume of physical activity: first, children tend to walk when they go out to play; secondly, when children walk to events they tend to be more active when they arrive. More generally, children who walk more than they use the car tend to be more active than other children. It was also found that children tend to be more active when they are out of their homes than when they are in them.
These findings suggest that children should be encouraged to go out more, walk more and play outdoors more. Unfortunately, as has been shown, all the trends are in the opposite direction: they are going out less, walking less and playing freely less. These factors may be significant contributions to the undesirable trends in children’s health associated with carry-ing out less physical activity.
To sum up, this article has shown that everyday activities can make significant contributions to children’s volumes of physical activity and that society needs to address the issues that prevent children from going out more to enjoy and experience the local environment around their homes because by doing so, children’s health should benefit.
Acknowledgements
This article is part of a project entitled ’Reducing children’s car use: the health and potential car dependency impacts’ funded by the UK Engineering and Physical Sciences Research Council under grant GR/N33638 at the Centre for Transport Studies at University College London. The co-operation of the children who took part in this exercise, and their parents and teachers, is greatly appreciated. The Environment Department of Hertfordshire County Council is a non-academic partner in the project and has facilitated much of the fieldwork, which is appreciated. The fieldwork was carried out by Lindsey Lucas and Jill Turbin whose efforts are greatly appreciated.
References
Biddle S, Cavill N, Sallis J. 1998. Policy framework for young people and health-enhancing physical activity, Chapter 1. In Young and Active? Young People and Health-enhancing Physical Activity – Evidence and Implications. Biddle S, Sallis J, Cavill N (eds). Health Education Authority: London: 3–16.
Brustad RJ. 1993. Who will go out and play? Parental and psychological influences on children’s attraction to physical activity.Pediatric Exercise Science5: 210–223.
Centers for Disease Control and Prevention (2007) BMI — Body Mass Index. Available at http:// www.cdc.gov/nccdphp/dnpa/bmi/index.htm [Accessed 16 July 2007].
Cooper AR, Page AS, Foster LJ, Qahwaji D. 2003. Commuting to school: are children who commute more physically active?American Journal of Preventative Medicine25: 273–276.
Davison P, Davison P, Reed N, Halden D, Dillon J (2003) Children’s attitudes to sustainable transport. Report produced for the Scottish Executive. Available at http://www.scotland.gov.uk/Publications/ 2003/12/18668/30698 [Accessed 16 July 2007].
Department for Transport. 2006. National Travel Survey: 2005. Transport Statistics Bulletin. Available at http://www.dft.gov.uk/pqr/statistics/datatablespublications/tsqb [Accessed 16 July 2007].
Department of Health. 2004. At least five a week: evidence on the impact of physical activity and its relationship to health. Available at http://www.dh.gov.uk/PublicationsAndStatistics/ Publications/PublicationsPolicyAndGuidance/PublicationsPolicyAndGuidanceArticle/fs/en?CONTENT_ ID¼4080994&chk¼1Ft1Of [Accessed 16 July 2007].
Department of Health, Department for Education and Employment. 2000. Healthy Schools: National Healthy School Standard, Physical Activity. Available at http://www.wiredforhealth.gov.uk/PDF/ Brochurenewpdf [Accessed 16 July 2007].
Fairclough S, Stratton G. 2005. ‘Physical education makes you fit and healthy’. Physical education’s contribution to young people’s physical activity levels. Health Education Research: Theory and Practice20: 14–23.
Fogelholm M, Nuutinen O, Pasanen M, Myohanen E, Saatela T. 1999. Parent–child relationship of phys-ical activity patterns and obesity. International Journal of Obesity Related Metabolic Disorders 23: 1262–1268.
Freedson PS, Evenson S. 1991. Familial aggregation in physical activity.Research Quarterly for Exercise and Sport62: 384–389.
Jotangia D, Moody A, Stamatakis E, Wardle H. 2005. Obesity among children under 11. Report pro-duced for the Department of Health, in collaboration with the Health and Social Care Centre. Avail-able at http://www.dh.gov.uk/Publicationsandstatistics/Publications/PublicationsStatistics/DH4109245 [Accessed 16 July 2007].
Mackett RL. 2001. Policies to attract drivers out of their cars for short trips. Transport Policy8: 295– 306.
Mackett RL. 2002. Increasing car dependency of children: should we be worried? Proceedings of the Institution of Civil Engineers: Municipal Engineer151: 29–38.
Mackett RL. 2003. Why do people use their cars for short trips?Transportation30: 329–349.
Mackett RL, Lucas L, Paskins J, Turbin J. 2004. Reducing children’s car use: the health and potential car dependency impacts. Available at http://www.cts.ucl.ac.uk/research/chcaruse/ [Accessed 16 July 2007].
Mackett RL, Lucas L, Paskins J, Turbin J. 2005. The therapeutic value of children’s everyday travel. Transportation Research A39: 205–219.
National Institute of Child Health and Development. 2000. How do children spend their time? Children’s activities, school achievement, and well being, Research on Today’s Issues, Issue number 11, August 2000, Population Reference Bureau for the Demographic and Behavioral Sciences Branch, Center for Population Research, National Institute of Child Health and Human Development, National Institutes of Health. Available at http://www.nichd.nih.gov/publications/pubs/upload/ti11pdf [Accessed 16 July 2007].
Rowlands AV, Thomas PWM, Eston RG, Topping R. 2004. Validation of the RT3 triaxial accelero-meter for the assessment of physical activity. Medicine & Science in Sports & Exercise 36: 518– 524.
Sleap M, Warburton P. 1993. Are primary school children gaining heart health benefits from their jour-neys to school?Child: Care Health & Development19: 99–108.
Trost SG, Pate RR, Freedson PS, Sallis JF, Taylor WC. 2000. Using objective physical activity measures with youth: how many days of monitoring are required?Medicine & Science in Sports & Exercise32: 426–431.
Tudor-Locke C, Ainsworth BE, Popkin BM. 2001. Active commuting to school: an overlooked source of children’s physical activity?Sports Medicine31: 309–313.
Tudor-Locke C, Neff LJ, Ainsworth BE, Addy CL, Popkin BM. 2002. Omission of active commuting to school and the prevalence of children’s-health related physical activity levels: the Russian Longitudi-nal Monitoring Study.Child: Care Health & Development28: 507–512.
Tudor-Locke C, Ainsworth BE, Adair LS, Popkin BM. 2003. Objective physical activity of Filipino youth stratified for commuting mode to school. Medicine & Science in Sports & Exercise 35: 465– 471.
US Department of Health and Human Services. 1996. Physical Activity and Health: A Report of the Surgeon-General, Centers for Disease Control and Prevention. National Center for Chronic Disease Prevention and Health Promotion: Atlanta, GA.
*Correspondence to: Professor Roger Mackett, Centre for Transport Studies, University College London, Gower Street, London WC1E 6BT, UK, Tel.: 020 7679 1554; Fax: 020 7679 1567. E-mail: rlm@transport.ucl.ac.uk
Accepted for publication 13 April 2007
Contributors’ details
Roger Mackettis Professor of Transport Studies in the Department of Civil and Environmental Engi-neering at UCL. His research interests include analysis of the impact of policy, the inter-relationship between transport, urban activities and the environment, public transport planning and operations, and the impact of new technology and lifestyles on locational and travel demand.
James Paskinsis a Research Fellow in the Centre for Transport Studies at UCL. He is currently working on the CAPABLE project, examining children’s behaviour in their local environments and studying for a part-time PhD. He has previously worked on projects investigating children’s car use and transport-related social exclusion.