University of South Florida
Scholar Commons
Graduate Theses and Dissertations
Graduate School
June 2018
Similarity Based Large Scale Malware Analysis:
Techniques and Implications
Yuping Li
University of South Florida, [email protected]
Follow this and additional works at:
https://scholarcommons.usf.edu/etd
Part of the
Computer Sciences Commons
This Dissertation is brought to you for free and open access by the Graduate School at Scholar Commons. It has been accepted for inclusion in Graduate Theses and Dissertations by an authorized administrator of Scholar Commons. For more information, please contact
Scholar Commons Citation
Li, Yuping, "Similarity Based Large Scale Malware Analysis: Techniques and Implications" (2018).Graduate Theses and Dissertations. https://scholarcommons.usf.edu/etd/7691
Similarity Based Large Scale Malware Analysis: Techniques and Implications
by
Yuping Li
A dissertation submitted in partial fulfillment of the requirements for the degree of
Doctor of Philosophy in Computer Science and Engineering Department of Computer Science and Engineering
College of Engineering University of South Florida
Major Professor: Xinming Ou, Ph.D. Lawrence Hall, Ph.D. Jarred Ligatti, Ph.D. Nasir Ghani, Ph.D. Jiyong Jang, Ph.D. Date of Approval: June 13, 2018
Keywords: Binary Similarity Analysis, Malware Clustering, Malware Detection, Machine Learning Copyright c 2018, Yuping Li
DEDICATION
ACKNOWLEDGMENTS
I would like to express my sincere gratitude and appreciation to my advisor Xinming Ou, for his continuous support and help during my Ph.D. life. He gave me tremendous insightful guidance and invaluable advice for critical thinking, and provided me great opportunities to conduct meaningful research for solving real-world problems. I feel truly thankful to be his student and work with him over the past several years.
I feel truly indebted to Dr. Lawrence Hall, Dr. Jarred Ligatti, Dr. Nasir Ghani and Dr. Jiyong Jang for serving on my dissertation committee. This dissertation would not be possible without their numerous constructive feedback and extremely helpful suggestions. In particular, Dr. Jang is always an amazing collaborator and his early work on software security analysis has been an incredible source of inspiration; Dr. Hall’s commitment to excellence greatly improved my paper writing and his broad knowledge consistently helped me to conduct the Machine Learning related research in the right way.
I truly appreciate all the talented coauthors and colleagues for their help and critical feedback for all the great work. Special thanks go to all the past and current members of Argus Cyber Security Lab for their wonderful friendship that makes my Ph.D. life more exciting and memorable.
This work was partially supported by the U.S. National Science Foundation under Grant No. 1314925 and 1622402.
TABLE OF CONTENTS LIST OF TABLES iv LIST OF FIGURES vi ABSTRACT vii CHAPTER 1: INTRODUCTION 1 1.1 Background 1 1.2 Malware Analysis 2
1.2.1 Desktop Malware Analysis 3
1.2.2 Android Malware Analysis 5
1.2.3 Machine Learning Based Malware Analysis 7
1.3 Objectives 9
1.4 Contributions 11
1.4.1 Accurate and Efficient Binary Similarity Analysis Tool 11
1.4.2 Specialized Android Malware Clustering System 11
1.4.3 Practical Implications of ML Based Android Malware Detection 12
1.5 Organization of the Dissertation 12
CHAPTER 2: ACCURATE AND EFFICIENT BINARY SIMILARITY ANALYSIS 14
2.1 Approach Overview 16
2.1.1 Basic Block Type Abstraction 16
2.1.2 Blendedn-gram Graphical Features 18
2.1.3 Graph Signature Format and Comparison 19
2.1.4 Fuzzy Hash Generation and Comparison 21
2.2 Evaluation of CFG Similarity Analysis Algorithms 22
2.2.1 Existing CFG Similarity Comparison Algorithms 23
2.2.2 CFG Comparison Algorithm Evaluation Strategy 24
2.2.3 Experiment Data Preparation 26
2.2.4 Evaluation Results 27
2.2.5 Overall Performance 30
2.3 Evaluation of Binary Similarity Analysis Tools 31
2.3.1 Binary Graph Signature Accuracy 32
2.3.2 Graphical Fuzzy Hash Accuracy 33
2.3.3 Similarity Tool Output Consistency 34
2.3.4 Similarity Tool Accuracy Analysis 35
2.3.5 Malware Detection Analysis 37
2.4 Limitations 41
2.4.1 CFG Construction Accuracy 41
2.4.2 Obfuscation and Evasion Techniques 41
2.4.3 Feature and Signature Collision 42
2.5 Summary 43
CHAPTER 3: PAYLOAD MINING BASED ANDROID MALWARE CLUSTERING 44
3.1 Overview of Android Malware Clustering System 46
3.2 App Fingerprint Representation and Utilization 48
3.2.1 Fingerprint Generation and Fingerprint Comparison 49
3.2.2 Fingerprint Based Library Code Removal 51
3.2.3 Fingerprint Based Candidate Payload Extraction 52
3.2.4 Fingerprint Based Malicious Payload Reconstruction 53
3.3 Malicious Payload Mining 53
3.4 Optimize Overall Clustering Efficiency 56
3.4.1 Opt-1: Optimize Each Pairwise Computation 56
3.4.2 Opt-2: Employ Approximate Clustering 58
3.5 Experiments 59
3.5.1 Data Preparation 59
3.5.2 Feature Collision Analysis 60
3.5.3 Library Removal Accuracy 61
3.5.4 Malware Clustering Results 62
3.5.5 Key Findings for Malicious Payload Analysis 64
3.6 Limitations 65
3.7 Summary 67
CHAPTER 4: EVALUATION OF MACHINE LEARNING BASED MALWARE
DETEC-TION SYSTEMS WITH UNKNOWN KNOWLEDGE 68
4.1 Issues with Traditional ML Based Malware Detection 69
4.2 Zero-day Malware Detection Based Evaluation 71
4.2.1 Malware Prediction Approach 72
4.2.2 Mislabel Identification Approach 73
4.2.3 Evaluation of Zero-day Detection Results 75
4.3 Experiment Preparation 76
4.3.1 Malware Samples 76
4.3.2 Benign Samples 77
4.3.3 Unknown Samples 77
4.3.4 Feature Construction 78
4.4 Malware Prediction Experiment 78
4.4.1 Testing with BenignB-2016Dataset 79
4.4.2 Testing with UnknownUDataset 81
4.5 Mislabel Identification Experiment 82
4.5.1 Testing with BenignB-2016Dataset 83
4.5.2 Testing with UnknownUDataset 84
4.6 Manual Verification of Zero-day Malware 85
CHAPTER 5: CONCLUSIONS 87
REFERENCES 90
LIST OF TABLES
Table 2.1 Combined basic block types 18
Table 2.2 Optimal clustering results for different algorithms 27
Table 2.3 Distance ranges for different CFG pairs 29
Table 2.4 Time taken to finish all pairwise distance calculation 31
Table 2.5 Malicious ground truth dataset 32
Table 2.6 BingSim-O Accuracy with differentn-gram sizes 33
Table 2.7 Optimal clustering results for different tools 36
Table 2.8 Benign ground truth dataset 38
Table 2.9 Malware detection results for similarity analysis tools 38
Table 2.10 Packer identification results 40
Table 2.11 Similarity calculation impacts for similarity analysis tools 40 Table 3.1 Major feature categories and main differences comparing with Juxtapp 50
Table 3.2 Clearly labeled malware families 60
Table 3.3 Clustering results of different sub-version datasets 63
Table 3.4 Malicious payload under popular libraries 66
Table 4.1 Summary of the prepared datasets 78
Table 4.2 Experiment results for B-2016 dataset using malware prediction techniques 80 Table 4.3 Experiment results forUdataset using malware prediction techniques 80 Table 4.4 Experiment results forB-2016dataset using mislabel identification techniques 82
Table 4.5 Experiment results forUdataset using mislabel identification techniques 83
LIST OF FIGURES
Figure 2.1 The BingSimworkflow 16
Figure 2.2 Distribution of in-degree value, out-degree value and combined basic block types 17
Figure 2.3 A simple CFG and its blended N-gram features 18
Figure 2.4 Single-linkage clustering results for different CFG comparison algorithms 28 Figure 2.5 Average-linkage clustering results for different CFG comparison algorithms 29 Figure 2.6 Complete-linkage clustering results for different CFG comparison algorithms 30 Figure 2.7 Cumulative distance distribution for different CFG comparison algorithms 31
Figure 2.8 Mean and Std. 34
Figure 2.9 Histogram 34
Figure 2.10 Single-linkage clustering results for different tools 37 Figure 3.1 Overview of the clustering system with five Android malware samples. 47
Figure 3.2 Overall fingerprint generation procedure 49
Figure 3.3 Example procedure to safely remove legitimate “twitter4j” library code 51 Figure 3.4 Extracting a candidate payload from two malware applications 52
Figure 3.5 Random feature collision status 61
Figure 3.6 Benign apps lib removal accuracy 61
Figure 3.7 Clustering analysis results for Android genome dataset 63
Figure 4.1 Malware prediction experiment overview 72
ABSTRACT
Malware analysis and detection continues to be one of the central battlefields for cybersecurity industry. For the desktop malware domain, we observed multiple significant ransomware attacks in the past several years, e.g., it was estimated that in 2017 the WannaCry ransomware attack affected more than 200,000 computers across 150 countries with hundreds of millions damages. Similarly, we witnessed the increased impacts of Android malware on global individuals due to the popular smartphone and IoT devices worldwide. In this dissertation, we describe similarity comparison based novel techniques that can be applied to achieve large scale desktop and Android malware analysis, and the practical implications of machine learning based approaches for malware detection.
First, we propose a generic and effective solution for accurate and efficient binary similarity analysis of desktop malware. Binary similarity analysis is an essential technique for a variety of security analysis tasks, including malware detection and malware clustering. Even though various solutions have been developed, existing binary similarity analysis methods still suffer from limited efficiency, accuracy, and usability. In this work, we propose a novel graphical fuzzy hashing scheme for accurate and efficient binary similarity analysis. We first abstract control flow graphs (CFGs) of binary codes to extract blended n-gram graphical features of the CFGs, and then encode the
graphical features into numeric vectors (called graph signatures) to measure similarity by compar-ing the graph signatures. We further leverage a fuzzy hashcompar-ing technique to convert the numeric graph signatures into smaller fixed size fuzzy hash outputs for efficient comparisons. Our compre-hensive evaluation demonstrates that our blendedn-gram graphical feature based CFG comparison
is more effective and efficient compared to existing CFG comparison techniques. Based on our CFG comparison method, we develop BingSim, a binary similarity analysis tool, and show that BingSim outperforms existing binary similarity analysis tools while conducting similarity analysis based malware detection and malware clustering.
Second, we identify the challenges faced by overall similarity based Android malware clus-tering and design a specialized system for solving the problems. Clusclus-tering has been well studied for desktop malware analysis as an effective triage method. Conventional similarity-based cluster-ing techniques, however, cannot be immediately applied to Android malware analysis due to the excessive use of third-party libraries in Android application development and the widespread use of repackaging in malware development. We design and implement an Android malware clustering system through iterative mining of malicious payloads and checking whether malware samples share the same version of malicious payloads. Our system utilizes a hierarchical clustering technique and an efficient bit-vector format to represent Android apps. Experimental results demonstrate that our clustering approach achieves precision of 0.90 and recall of 0.75 for the Android Genome mal-ware dataset, and average precision of 0.98 and recall of 0.96 with respect to manually verified ground-truth.
Third, we study the fundamental issues faced by traditional machine learning (ML) based Android malware detection systems, and examine the role of ML for Android malware detection in practice, which leads to a revised evaluation strategy that evaluates an ML based malware detection system by checking their zero-day detection capabilities. Existing machine learning based Android malware research obtains the ground truth by consulting AV products, and uses the same label set for training and testing. However, there is a mismatch between how the ML system has been evaluated, and the true purpose of using ML system in practice. The goal of applying ML is not to reproduce or verify the same potentially imperfect knowledge, but rather to produce something that is better — closer to the ultimate ground truth about the apps’ maliciousness. Therefore, it will be more meaningful to check their zero-day detection capabilities than detection accuracy for known malware. This evaluation strategy is aligned with how an ML algorithm can potentially benefit malware detection in practice, by acknowledging that any ML classifier has to be trained on imperfect knowledge, and such knowledge evolves over time. Besides the traditional malware prediction approaches, we also examine the mislabel identification approaches. Through extensive experiments, we demonstrate that: (a) it is feasible to evaluate ML based Android malware detection systems with regard to their zero-day malware detection capabilities;
(b) both malware prediction and mislabel identification approaches can be used to achieve verifiable zero-day malware detection, even when trained with an old and noisy ground truth dataset.
CHAPTER 1: INTRODUCTION
1.1 Background
Malicious software,a.k.a.malware, is an generic term used to refer to a variety of intentionally hostile, harmful, or intrusive software programs, such as virus, worms, Trojan, bot, backdoor,
etc. In this work, we mainly consider the malicious programs for the Windows platform, and the malicious applications from the Android platform at the same time, even though they need separated detection and analysis techniques.
Dating back 2014, executives from the leading antivirus (AV) company Symantec already claimed [1] that antivirus was “dead” because: (1) companies were gradually shifting from protect to detect and response; and (2) dedicated hackers can get into a system even if AV products were installed. However, we observe that: (a) more companies were building AV detection solutions in recent years,e.g., the number of AV products listed on VirusTotal [2] increased from around 40 in 2010 to about 70 in 2018; (b) all size organizations and companies are still heavily using the AV products as an important layer of security defense mechanism.
Indeed, malware remains one of the major attacking tools for cyber criminals and is responsi-ble for many notorious cyber attacks in recent years. Besides spying on user activity and harvesting for credentials, malware evolved with more advanced approaches for amplifying the damage and gaining profits. For example, Mirai [3] was a malware that continuously scans for networked In-ternet of Things (IoT) devices and turns the IoT devices into remotely controlled “bots”. The Mirai botnet was used to launch multiple large-scale distributed denial of service attacks (DDoS) in 2016; Utilizing the NSA leaked EternalBlue and DoublePulsar exploits, hackers created Wan-naCry [4] ransomware which infected more than 200,000 computers across 150 countries in 2017; Thanks to the boom of cryptocurrencies in 2017, miscreants also started to create cryptomining
malware (e.g., Trickbot) which turns infected machines into coin miners thereby stealthily collecting lucrative cryptocurrency profits.
Due to the increased popularity of smartphone devices, we also noticed the gradually increas-ing malware threats in recent years on mobile platforms, especially for Android. Like all the trends that we have observed on the Windows platform, hackers also developed various creative techniques for Android malware to spy on user activity, steal personal or financial data, clear suspicious activ-ity traces and maintain persistence access, escalate to administrator privilege using root exploits, or multiple ways to achieve anti-analysis using string renaming, encryption, dynamic loading, native payload,etc. Over the years, cyber criminals developed different approaches for monetization, such as sending premium SMS messages, selling the stolen banking credentials, showing aggressive ad-vertisements, and carrying out fraud campaigns. In addition, the emerging threats observed from the desktop malware domain were also found within Android malware domain. For instance, in 2017 researchers [5] found a type of ransomware named DoubleLocker which can change the PIN number and encrypt the data on Android devices.
Comparing to malware threats in the past, system vulnerability (e.g., exploiting) and human vulnerability (e.g., phishing) remains the main vehicles for spreading the malware, but nowadays malware authors have more options to profit massively within a short period of time, and a successful malware campaign typically causes more severe financial damages to impacted organizations or individuals. Malware analysis is an on-going arm race process between security defenders and cyber criminals, we believe malware will remain to be one of the major security threats in future and malware analysis will continue to be a necessary and relevant technique within security industry.
1.2 Malware Analysis
In the real world, malware authors can reuse existing code to create new instances of malware that have the same functionality as existing malware, those newly created malware instances are often referred as malware “variants”. Malware variants are observed within both the desktop malware and Android malware domain, thus a single malware family may contain a huge number of different malware samples, and many of them share the same malware functionalities.
To cope with the ever increasing number of real world malware samples that are variants of existing malware families, similarity analysis techniques were frequently used for creating scalable malware analysis solutions. For example, analyzing certain samples of the malware family thor-oughly, then extracting the critical signatures for that family and checking whether other samples also present the same signatures. Or converting all samples into an efficient feature representation, then checking whether the newly processed samples are similar to malware samples in their feature representation.
Over the past two decades, lots of researchers have worked in the malware analysis domain and provided numerous techniques or systems for handling specific malware analysis tasks. In this work, we mainly aim to categorize previous research works that are related to similarity based malware analysis, and do not intend to cover all previous research works in the malware analysis domain. We separate similarity based malware analysis into the following categories: desktop malware analysis, Android malware analysis, and machine learning based malware analysis.
1.2.1 Desktop Malware Analysis
The early works in the desktop malware analysis domain were pioneered by anti-virus com-panies, which aimed to develop standalone detection systems by providing distinctive malware signatures for each malware family. In the early days, malware signatures were often carefully created by thorough manual analysis to avoid false positives, which is labor intensive and time con-suming. Hancock [6] was the first string signature generation system that automatically generated contiguous byte sequences as signatures, it employed various categories of heuristics to create string signatures with a sufficiently low false positive rate. Tabish [7] designed a malware detection system using statistical analysis of byte-level file content, it achieved 90% malware detection without rely-ing on specific byte sequences or strrely-ings of the file content. Jang [8] provided a malware clusterrely-ing system called BitShred by extracting n-gram features from malware code section byte sequences
and applying feature hashing technique to dramatically reduce the feature space. BitShred was experimentally shown to be effective and scalable for malware clustering. Jacobet al. [9] presented packer-agnostic filter approach to detect similar malware samples by firstly categorizing malware code into unpacked, compressed, encrypted, and multi-layer encrypted, then applying different
sim-ilarity measurements accordingly. ssdeep [10] was a representative fuzzy hashing algorithm that was used to detect homologous files using context triggered piecewise hashes, it couldn’t recognize significant number of samples that are known to be similar due to the byte sequences level oper-ations adopted. nextGen-hash [11] was a concretized fuzzy hashing approach based on the main ideas developed in BitShred, which generated signatures from the program code section, but its significant fingerprint size made it hard to use in practice.
In addition to byte sequences malware analysis, researchers also explored malware detection through analysis of instruction sequences (e.g., assembly opcodes), which provides richer semantic information compared to low level byte sequences. Christodorescu et al. [12] presented a malware detection algorithm by incorporating instruction semantics to detect malicious program traits, and showed that it can detection malware variants with a relatively low run-time overhead. Santos [13] provided a malware detection solution based on the frequency of appearance of opcode sequences and described an method to mine the relevance of opcodes and weight the opcode sequence fre-quency. Moskovitch [14] both proposed n-gram features from opcode sequences, and demonstrated it to be more effective than n-gram features extracted from byte sequences. MutantX-S [15] was a scalable framework designed to effectively cluster a large number of malware samples by extracting n-gram features from disassembled program opcode sequences, and showed that the system can
achieve a good balance between accuracy and scalability.
Instruction sequences provide more semantics information than byte sequences, but they are still susceptible to obfuscation and suffer from accuracy in reality. Therefore, analyzing malware based on the graph representation of malware samples was also adopted in the security community. Bruschi [16] proposed to detect the metamorphic malicious code inside a program based on the comparison of the CFGs of the program against the CFGs of known malware, and provided exper-imental data supporting the validity of the strategy. Hu [17] designed a multi-resolution malware indexing system that can efficiently detect malware by comparing the similarity of function-call graphs and demonstrated effective detection capabilities. Cesare et al. [18] supplied a similarity search approach using distance metrics of malware control flow graphs (CFG). They created mal-ware signatures for the malmal-ware by decomposing the CFGs into either fixed size k-subgraphs (from
structural representation), or q-gram strings (from string representation). Kong [19] presented a generic framework that extracts structural information from malware programs as attributed function call graphs, and learns discriminant malware distance metrics and evaluate the similarity between the attributed function call graphs of two malware programs. Similarly, Alam [20] provided a malware detection scheme using Annotated Control Flow Graph (ACFG), and demonstrated that ACFG generated more accurate results than CFG based detection approach.
The majority of existing similarity based desktop malware analysis works are based on static analysis. A higher level of program representation was shown to be more resilient against instruction level obfuscation, but still suffered from advanced obfuscation such as compressing, encryption, and virtualization etc. In order to fight against malware obfuscation, dynamic analysis based systems were also developed, the dynamic behaviors or traces collected from such systems were typically further forwarded for anomaly analysis or machine learning based analysis, we therefore describe such systems in Section 1.2.3.
1.2.2 Android Malware Analysis
An Android app is an archive file with a “apk” extension, it commonly contains program’s code (“.dex” files), resources, assets, certificates, and manifest file. Android apps are typically de-veloped in the Java language and compiled to bytecode, then converted from Java Virtual Machine compatible “.class” files to Dalvik virtual machine compatible “.dex” files before installation on Android-powered devices. The Android operating system is a multi-user Linux system in which each app is a different user and lives in its own security sandbox.
Being a Java application, it becomes easier for attackers to disassemble the compiled app code into an intermediate representation (e.g., smali) or even source code representation, which subsequently make it easier to create new Android apps by repackaging existing legitimate and popular Android apps. This malicious practice was frequently used used by miscreants to replace in-app advertisements or reroute revenues or inject backdoor or malicious payloads within the repackaged apps.
A significant amount of early research in this domain was mainly designed for detection of repackaged malware, and similarity analysis between malicious apps and known benign apps was
adopted because of the nature of the app repackaging procedure. Zhouet al. [21] developed Droid-MOSS to effectively localize and detect the changes from app repackaging behavior by using a fuzzy hashing technique to disassembled instruction sequences. Hanna et al. designed Juxtapp [22], a scalable infrastructure for code similarity analysis among Android applications by extractingn-gram
features from instruction sequences and applying a feature hashing technique. DNADroid [23] can be used to analyze Android programs and compare program dependency graphs between methods in candidate applications. In addition, Lin [24] suggested to identify repackaged apps by checking thread-grained system call sequences, which does not require the original benign apps to identify the repackaged apps. Besides analysis from Dalvik instruction sequences, core application resources were also used for detecting repackaged apps [25], because of the close relationships between the original app and the repackaged app. It can identify repackaged apps efficiently and effectively even if the code has been obfuscated. Zhang proposed ViewDroid [26], a user interface based repackaging detection system through view graphs of the app. View graph represents a new birthmark of the app that can characterize Android apps from a higher level abstraction, which also make it resilient to code obfuscation.
Even though clustering analysis systems were shown to be effective for large scale desktop malware triage, the traditional similarity based clustering systems cannot be immediately applied for Android malware clustering because of the following reasons: (1) the malicious code segments often constitute only a small fraction of an Android malware sample. (2) there are excessive usages of third-party legitimate libraries in Android application development, which means samples from different families may share high level of overall similarity when they both contain the same large library code; (3) attackers frequently use repackaging techniques to create new malware samples, which means samples from the same families may share a low level of overall similarity when they are repackaged based on different apps. Over the past few years, we only observed a few systems that tried to address the Android malware clustering problem, but the overall performance was limited because of the above constraints. For example, Samra [27] extracted features from Android app manifest files, and could only cluster applications into two categories using the K-means algorithm. ClusTheDroid [28] was a system for clustering Android malware using 38 features extracted from
profiles of reconstructed dynamic behaviors. Without properly excluding the features or behaviors that belong to the original benign apps or legitimate libraries, traditional clustering approaches would not be able to produce promising results.
As shown above, similarity analysis techniques in the Android domain were mainly used to identify repackaged malicious apps by comparing them against known legitimate apps instead of comparing them against known malicious apps. Repackaged malware represents a significant por-tion of Android malware, but it has been observed [29] that standalone malware is increasing in recent years. In order to detect malware based on knowledge of existing malware samples, malicious payload identification and extraction is essential. Zhou and Jiang [30] manually analyzed malicious payloads of Android malware and summarized the findings in the Android Malware Genome project. DroidAnalytics [31] presented a multi-level signature based analytics system to examine and as-sociate repackaged Android malware. AndroSimilar [32] was a signature based malware detection solution utilizing statistically improbable features, it applied a syntactic foot-printing mechanism to detect unknown malware by identifying statistically similar regions. MassVet [33] analyzed graph similarity at the function level and extracted the shared non-legitimate functions as malicious pay-loads through commonality and differential analysis, and it applied a whitelist to exclude legitimate library code from analysis. MassVet was shown to be effective for vetting Android apps, but it failed to extract the malicious payloads if they are injected under popular library namespaces or under existing functions.
1.2.3 Machine Learning Based Malware Analysis
Machine learning (ML) techniques have been applied for both desktop malware and Android malware analysis. Overall, ML based malware detection first converts malware samples into feature vectors through either static analysis or dynamic analysis, then trains on a labeled ground truth dataset and creates ML models for prediction. Essentially, the overall process tries to abstract certain implicit connections from the training dataset, and checks whether the testing samples are “similar” to the training samples in the features according to ML algorithms applied. In this section, we mainly discuss ML based malware detection systems that are commonly referred as malware classification or malware prediction.
ML based desktop malware detection systems using static features dates back 2001. Schultz
et al. [34] were among the first to suggest using data mining methods for detection of new malicious
executables. They explored various machine learning algorithms with different static features for malware classification and claimed that the ML detection rate was twice as compared to signature based method. Kolter [35] later tried n-gram features with different classifiers and concluded that
the boosted decision tree gave the best classification results. In [36], Tian et al. attempted to classify Trojans with the frequency of function length, which was measured by the number of bytes in the code. Siddiqui [37] used variable length instruction sequence along with machine learning for detecting worms in the wild. Santos [38] designed a semi-supervised learning approach which was able to learn from labeled and unlabeled data and provides a solution with respect to the intrinsic structure displayed by both labeled and unlabeled instances. Nataraj [39] proposed a method for visualizing and classifying malware using image processing techniques, which visualize malware binaries as gray-scale images. the authors compared binary texture based analysis (based on image processing techniques) with that of dynamic analysis.
Later, researchers began to apply dynamic techniques to improve the accuracy and effec-tiveness of malware classification systems. In [40, 41], Rieck et al. suggested to classify malware variants using their shared behavioral patterns. They used existing anti-virus products to prepare labeled malware, then monitored the behavior of malware samples in a sandbox environment. In order to apply the learning algorithms, they provided a way to effectively embed the observed behavior in a vector space. Bayer [42] designed a system that clusters large sets of malicious bi-naries based on their behavior reports. Their behavior reports are collected from Anubis sandbox and the approximate clustering algorithm was based on Locality Sensitive Hashing. Zolkipli [43] presented a malware classification approach using malware behavior reports collected CWSandbox and Anubis sandbox environments, but they relied on human analysis for processing the dynamic behavior reports.
In recent years, various ML based systems were also proposed for Android malware detection. Sahs [44] presented a ML based which uses static features such as permissions and trains a One-class SVM in an offline manner. Their experiments showed a low false negative rate but high false
positive rate. DroidMat [45] used a static analyst paradigm for detecting the Android malware, it utilized static information including permissions, deployment of components, Android Intent information and API calls for characterizing the Android applications behavior. Peiravian [46] proposed to combine permission and API (Application Program Interface) calls and use machine learning methods to detect malicious Android Apps, and validates the algorithm performance using real world apps. MAST [47] helped resource intensive operations (e.g., manual analysis) to triage their priority, thereby reducing the average computation overhead. This system utilizes a statistical method called Multiple Correspondence Analysis (MCA), and uses permissions, intents and the presence of native code to determine the probabilities of being malicious. Drebin [48] gathered a massive set (more than 500K) of features which contain different types of manifest features (permissions, etc.) and ‘code’ features (URLs, APIs etc.). It applied a SVM to train a detection model which later can be uploaded to a device to do on-device malware detection, and generated impressive performance results. DroidMiner [49] was a malicious Android app detection system that uses static analysis to automatically mine malicious program logic from known Android malware by computing the alignment of an application’s behavioral graph to a set of known malicious modalities. MUDFLOW [50] discovered that the sensitive information flow pattern was different between benign and malware apps which can be utilized to do malware detection. Such data flow information was then used as features in a standard SVM to train classifiers. Gason [51] proposed a malware detection method based on efficient embedding of function call graphs with an explicit feature map, and experimentally showed it outperformed several related approaches with few false alarms. DroidSIFT [52] was semantic-based approach which extracts weighted contextual API dependency graph as program semantics to construct feature vectors. Then the feature vectors were used to train a classifier to do anomaly detection or signature based malware detection, and it has shown to be resilient for bytecode level transformation attacks.
1.3 Objectives
Similarity based malware analysis is a huge topic, and significant number of researchers have worked in this field over the past two decades as shown in above section. This dissertation tries to solve several key remaining challenges for efficient desktop malware analysis and Android malware
analysis, and explores the role of ML based malware detection in practice and meaningful ways to properly evaluate ML based malware detection systems.
• Accurate and efficient binary similarity analysis solution: Binary similarity analysis is an essential technique for a variety of security analysis tasks, including malware detection and malware clustering. Even though various solutions have been developed, existing binary sim-ilarity analysis methods still suffer from limited efficiency, accuracy, and usability. Entering the era of big data, effective similarity analysis solutions will be more frequently used for malware analysis. Therefore, it is necessary to create a generic and effective binary similarity analysis solution. Our first objective is to generate hashing outputs specifically for binary files that are as compact as cryptographic hashes such as SHA-2, and at the same time maintaining the accuracy with regard to overall binary similarity.
• Effective Android malware clustering system: Clustering has been well studied for desktop malware analysis as an effective triage method. Conventional similarity-based clustering techniques, however, cannot be immediately applied to Android malware analysis due to: (1) the excessive use of third-party libraries in Android application development; (2) the widespread use of repackaging in malware development; (3) the ambiguity between legitimate Java libraries and bogus libraries which contain malicious payloads. To address the unique challenges presented Android domain, we intend to build an effective clustering system that is specifically designed for processing Android malware.
• Proper way to evaluate ML based malware detection system: Existing machine learning (ML) based Android malware research obtains the ground truth by consulting AV products, and uses the same label set for training and testing. However, there is a mismatch between how ML systems have been evaluated, and the true purpose of using an ML system in practice. The goal of applying ML is not to reproduce or verify the same potentially imperfect knowledge, but rather to produce something that is better — closer to the ultimate ground truth about the apps’ maliciousness. To this end, we study the fundamental issues faced by traditional
ML based Android malware detection systems, and examine the implications of using ML based techniques for Android malware detection in practice.
1.4 Contributions
This dissertation presents an accurate and efficient binary similarity analysis solution, an effective clustering system for Android malware apps, and the implications for conducting ML based experiments to properly evaluate their performances. We summarize the major contributions in this section.
1.4.1 Accurate and Efficient Binary Similarity Analysis Tool
In this dissertation, we propose a novel structural analysis based fuzzy hashing scheme for precise and efficient binary similarity analysis. We propose a blended n-gram graphical feature
based CFG comparison algorithm called CFGSimNG. It extracts the n-gram graphical features
from CFGs, and measures the similarity of CFGs by comparing the graphical features encoded in numeric vectors. Based onCFGSimNG, we design and implement a fuzzy hash tool BingSimfor accurate and efficient binary similarity analysis. BingSim represents binaries as fixed-size fuzzy hashes from the graphical features extracted from the corresponding CFGs. In order to com-prehensively evaluate various CFG comparison algorithms, we design a clustering analysis based framework to and show that CFGSimNG is more stable, faster, and generates more accurate re-sults compared to five state-of-the-art CFG comparison algorithms. Our comprehensive evaluation demonstrates that BingSim effectively performs malware clustering and malware detection tasks with 2865 carefully labeled malware samples in an efficient manner.
1.4.2 Specialized Android Malware Clustering System
We also design and implement an effective Android malware clustering system through iter-ative mining of malicious payload and checking whether malware samples share the same version of malicious payload. By reconstructing the original malicious payloads, our approach offers an effective Android malware app clustering solution along with fundamental insights into malware grouping. In order to distinguish between the legitimate Java libraries and bogus libraries which contain malicious payloads, we design a novel method to precisely remove legitimate library code
from Android apps while preserving the malicious payloads even if they are injected under popular library names. We conduct extensive experiments to evaluate the consistency and robustness of our clustering solution. Our experimental results demonstrate that our clustering approach achieves precision of 0.90 and recall of 0.75 for Android Genome malware dataset, and average precision of 0.984 and recall of 0.959 regarding manually verified ground-truth.
1.4.3 Practical Implications of ML Based Android Malware Detection
Considering the mismatch between how ML based malware detection systems were evaluated in previous research and how ML based malware detection systems should be used in practice, We suggest to evaluate machine learning outputs by checking zero-day detection results. Compared with the classical evaluation strategy that focuses on known malware detection, we believe the new evaluation strategy is more meaningful and more closely represents how an ML-based system can be beneficial in practice. We also propose to apply mislabel identification for Android malware detection and demonstrate that mislabel identification techniques can be used to prepare cleaner training datasets, or directly used for detecting zero-day malware through identification of mislabels in a noisy benign dataset. In order to verify the zero-day malware detection results, we can either verify the detection results through an updated ground truth obtained at a later time or rely on manual analysis. Through extensive experiments, we demonstrate that: (a) it is feasible to evaluate ML based Android malware detection systems with regard to their zero-day malware detection capabilities; (b) both malware prediction and mislabel identification approaches can be used to achieve verifiable zero-day malware detection, even when trained with an old and noisy ground truth dataset.
1.5 Organization of the Dissertation
The rest of the dissertation is organized as follows. In Chapter 2, we describe a blended n-gram graphical feature based CFG comparison algorithm, which is used to create an accurate and efficient binary similarity analysis tool calledBingSim. Chapter 3 summarizes the techniques challenges for using traditional similarity based clustering systems for Android malware analysis, and presents our solution for effective Android malware clustering. In Chapter 4, we examine the
issues of ML based Android malware detection systems and evaluate the effectiveness of ML based zero-day malware detection capabilities. Finally, Section 5 concludes this dissertation.
CHAPTER 2: ACCURATE AND EFFICIENT BINARY SIMILARITY ANALYSIS
Binary similarity analysis has played an essential role in malware analysis, e.g., identifying the variants of known malware samples, evaluating the relationship between different malware families, studying the evolution of malware families, and triaging newly collected malicious samples to prioritize the new threats. It is also the most fundamental key component for conducting malware clustering analysis, which is often considered as a viable solution for large-scale malware triage. Therefore, effective and efficient binary similarity analysis is much desired for operational security analysis environments.
It is challenging to precisely and effectively compare binary codes, and the majority of existing binary similarity analysis tools are not specifically designed to evaluate binary programs. For example, security analysts propose to identify malware variants through fuzzy hashing techniques which are designed for matching file homologies. As a representative fuzzy hashing technique, ssdeep [10] has been adopted by VirusTotal [2] as one of the file properties for all of the submitted malware samples. Although ssdeep and the majority of existing fuzzy hashing tools provide efficient ways to calculate binary file properties, their capabilities to detect malware variants are limited because they consider the binary files as simple sequences of 0 and 1’s, and the low-level sequences may be substantially changed by even minor updates in the source code.
An alternative design choice to overcome the above limitation is to take the structural and semantic information of binary codes into consideration when conducting similarity analysis. Com-pared with low-level sequences, semantic level comparison between binary codes, e.g., by using control flow graph (CFG) level analysis, has been shown to be more robust against compilation variances [17, 53, 54].
Despite numerous efforts towards effective CFG similarity comparison, existing CFG com-parison algorithms lack efficiency when performing binary similarity analysis. Graph matching is known to be computationally expensive. Even though several approximate graph isomorphism algorithms [17, 55–57] have been developed over the past several decades, it is still time-consuming to compare a large number of CFGs at the same time. For instance, comparing binary A with m
functions and binary B with n functions would result in m∗n pairwise CFG comparisons.
Fur-thermore, we notice that the majority of existing CFG similarity comparison algorithms work with raw CFG structures, and rely on inefficient CFG representations for comparison. We hypothesize that the original CFG representation is not required to measure the CFG similarity if a CFG can be effectively encoded with certain representative graph features. This could result in a universal and compact graph format and make the overall comparison more efficient.
In this section, we propose a blended n-gram graphical feature based CFG comparison
al-gorithm, called CFGSimNG, and use it as the technical basis for conducting binary similarity analysis. The new CFG comparison algorithm is designed based on the insight that the n-gram
concept is applicable to represent CFGs to assess graph similarity. The n-gram concept has been
extensively applied for measuring document similarity where contiguous sequences of n items are extracted from an input stream. We apply it to CFGs in a similar manner, except working with multiple input paths. Extracting n-gram graphical features from CFG structures enables us to
effectively encode arbitrary CFGs in the same format. Since all CFGs in the entire binary code are encoded into the same feature space, the binary similarity is calculated in an efficient manner after extracting all then-gram graphical features. When comparing with the state-of-the-art CFG
com-parison algorithms, CFGSimNG achieves the highest accuracy at the combined F-score of 0.914 for hierarchical clustering, and takes the least amount of time to complete all pairwise comparison even without caching the graph signature generation process.
To conduct binary similarity analysis, we first disassemble the target binaries to construct the CFGs of the binaries, and then extract all of the n-gram graphical features from the CFGs which
are stored as binary graph signatures in a numeric vector representation. The binary similarity is then calculated by measuring the graph signature similarity. To facilitate the comparison between
binaries and efficiently store binary graph signatures, we developed BingSim to generate and compare fixed-size fuzzy hash outputs from graph signatures. In this way, we achieved high accuracy through the graphical level binary representation, and high efficiency through the compact fuzzy hash comparison. When comparing with the state-of-the-art binary similarity tools, BingSim achieves the highest accuracy at the F-score of 0.929 for singe-linkage clustering, and demonstrates higher accuracy in malware detection tasks.
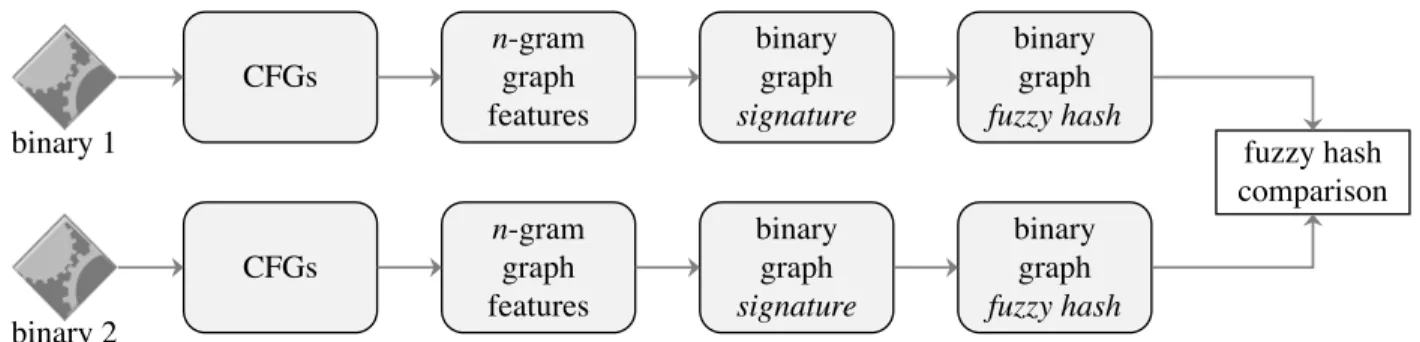
2.1 Approach Overview
We illustrate theBingSimworkflow in Figure 2.1. For all target binaries, we first disassemble the them and construct the corresponding CFGs. We then extract the blended n-gram graphical
features from the input CFGs and encode them as numeric vectors called graph signatures. To make it easy to use and more efficient to compare, we subsequently compress the graph signatures into fixed-size bit-vectors called fuzzy hash outputs. Finally we compare the corresponding fuzzy hash outputs to determine the similarity of input binaries. We describe the technical details of the main steps in this Section.
binary 1 n-gram graph features binary graph signature binary graph fuzzy hash fuzzy hash comparison CFGs binary 2 n-gram graph features binary graph signature binary graph fuzzy hash CFGs
Figure 2.1: TheBingSim workflow
2.1.1 Basic Block Type Abstraction
In order to extract representative graphical features, we need to abstract the basic blocks within binary CFGs in a meaningful way. The main objective for the abstraction is to categorize all CFG nodes into different types, and the abstracted results are then used to simulate the item “content” as used in traditionaln-gram application scenarios.
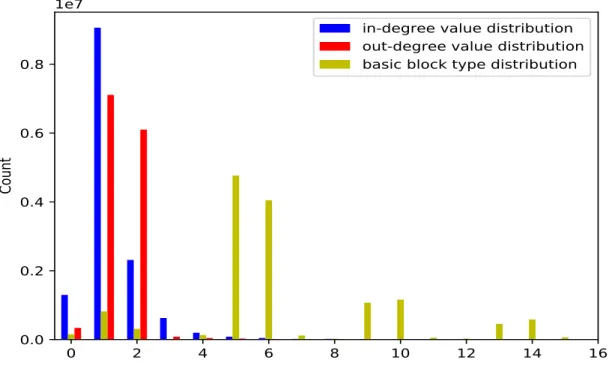
We explore a simple basic block type abstraction approach which captures the topology of the CFG, and show in a subsequent section that such a simple type abstraction approach produces reliable results. In particular, we define the basic block types based on their number of parents (i.e., node in-degree) and number of children (i.e., node out-degree). To capture the real world situation, we experimentally analyzed a total of 93,470 binaries that were obtained from newly installed Android and Windows operation systems, and malware sharing websites like VirusShare [58]. The overall distribution of the in-degree and out-degree values are shown in Figure 2.2.
0
2
4
6
8
10
12
14
16
0.0
0.2
0.4
0.6
0.8
Count
1e7
in-degree value distribution
out-degree value distribution
basic block type distribution
Figure 2.2: Distribution of in-degree value, out-degree value and combined basic block types
Since the majority of in-degree and out-degree values are between 0 and 3 as shown in Figure 2.2, we mainly consider in-degree values ranging from 0 to 3, and out-degree values ranging from 0 to 3. This basic block abstraction strategy results in a total of 16 unique basic block types, the combined basic block types are shown in Table 2.1, each entry in the table shows a specific basic block type, the number contained in the type string indicates the corresponding type index. Basic blocks whose in-degree are larger than or equal to 3 are considered as the same type, and
basic blocks whose out-degree are larger than or equal to 3 are considered as the same type. This won’t result in significant feature collision cases since only 1.27% of real world basic blocks have out-degree larger than 3 and only 3.67% of real world basic blocks have in-degree larger than 3.
Table 2.1: Combined basic block types Out-degree 0 1 2 ≥3 In-degree 0 B0 B1 B2 B3 1 B4 B5 B6 B7 2 B8 B9 B10 B11 ≥3 B12 B13 B14 B15
2.1.2 Blended n-gram Graphical Features
Inspired by the traditionaln-gram concept, we consider a node (i.e., basic block) in a CFG
as a single item, and define an n-gram graphical featureto be the consecutive n basic blocks that
can be extracted from an input CFG. In order to accommodate the classical graphical concepts, such as nodes and edges, and consider the node connectivity and node context information at the same time, we include allk-gram (k∈[1, n]) features as the complete graphical feature set for the
input CFG. Thisk-gram model (by considering all sequences from length 1 up ton) was previously
referred to as blendedn-gram features [59, 60].
B2
B9
B8
B6
B5
N N-gram Feature set 1 B2, B6, B9, B5, B8 2 B2B6, B2B9, B6B9, B6B8, B9B5, B5B8 3 B2B6B9, B2B9B5, B6B9B5, B9B5B8, B2B6B8 4 B2B6B9B5, B2B9B5B8 5 B2B6B9B5B8
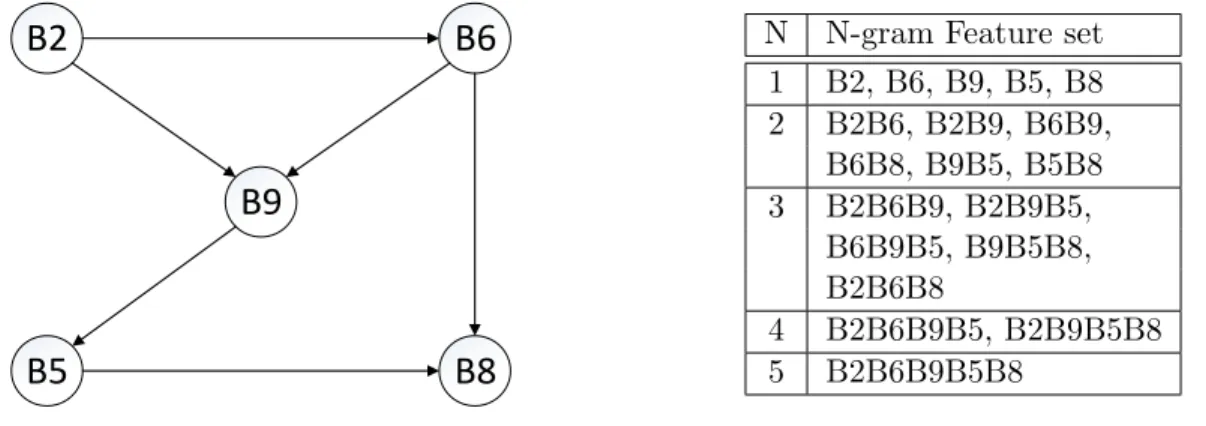
Figure 2.3: A simple CFG and its blended N-gram features
We use the simple CFG as shown in Figure 2.3 to explain the blended n-gram graphical
in the previous section. For example, B9 has 2 parent nodes and 1 child node. For each node in the constructed CFG, we apply the following process to extract the graphical features. For node
B2, the 1-gram feature is B2itself; the 2-gram features areB2B6 andB2B9; the 3-gram features are
B2B6B9,B2B6B8and B2B9B5. For a givenn, this procedure will extract all possible blendedn-gram
graphical features starting from basic block B2. This step is called visiting node B2. The process for visiting one node could reach up to n-1 level children nodes. We follow this procedure for all nodes in the CFG and obtain the resulting blended n-gram graphical feature sets for the whole
graph. The complete 5-gram graphical features for the CFG are presented on the right side table of Figure 2.3. Note that cycles in the CFG will not be an issue since each node in the CFG is only visited once and the visiting order of the CFG nodes makes no difference.
Increasingn-gram size can result in a larger feature space, which could provide more
differen-tiation capabilities. On the other hand, a larger feature space also means a longer time to extract alln-gram graphical features and the extracted graph features need more resources for storage and
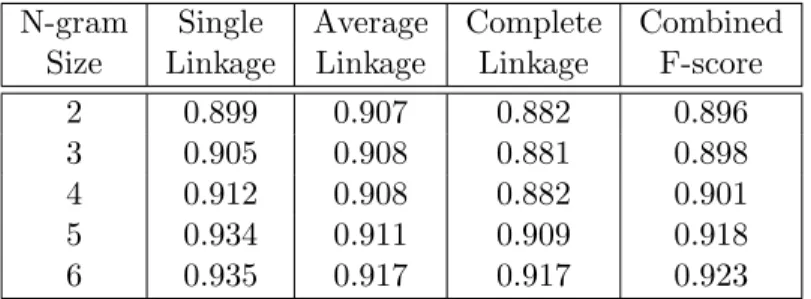
comparison. We conduct experiments to evaluate the impact of differentn-gram sizes, and
empiri-cally choose blended 5-gram as the defaultn-gram size considering the accuracy and efficiency (see
Section 2.3.1).
With the combined basic block types defined previously, a na¨ıve implementation for the blended 5-gram feature set would result in a feature space of 1,118,4801. However, there are certain n-gram graphical features that are invalid by definition. For instance, thek-gram (k≥2) features
that contain in-degree of 0 basic block types (i.e.,B0,B1,B2,B3) but do not start with them are invalid; the k-gram (k ≥2) features that contain out-degree of 0 basic block types (i.e., B0, B4,
B8, B12) but do not end with them are invalid. After removing the invalid features, the blended 5-gram feature set has a smaller 118,096 legitimate entries.
2.1.3 Graph Signature Format and Comparison
We represent the n-gram graphical features in a numeric vector and consider it as a binary
graph signature. Each entry in the vector indicates a specific feature, and the entry value is the corresponding feature count for the graph. In this way, both the feature content and feature size
1
are recorded. All the binary graph signatures have the same size, and then-gram graphical feature
space is determined by then-gram size. In our implementation, we specify each feature entry as a
32-bit unsigned integer type, which we believe is large enough for practical graph sizes since it can store a maximum feature count of 232.
We use the following cosine similarity equation to measure the basic similarity between binary graph signatures.
simcos(Siga, Sigb) =
Siga·Sigb
|Siga| · |Sigb|
(2.1)
The initial intuition for ignoring the graph signature length during the similarity comparison is that we want to consider the CFGs that are known to be proportional in size to be the same. For example, if a CFG is duplicated multiple times, the resulting CFGs are still semantically the same as the original CFG. In addition, we also found this comparison mechanism provides an ideal foundation for meaningful signature size compression, which is used to generate the more compact fuzzy hash output as shown in the next subsection.
In practice, the feature counts for different binaries vary significantly, and completely relying on cosine similarity measure may generate misleading results. For example, comparing vectors of [1,2,3,4] and [2,4,6,8] would yield similarity score of 1.0, but the input vectors are completely different. This is due to cosine similarity only measuring the angle between the input vectors. We use N F to indicate the total number of graphical features contained in the CFG, and define the
following size rectification factor for two CFGs:
Rectlength(Grapha, Graphb) =
min(N Fa, N Fb)
max(N Fa, N Fb)
(2.2)
In the end, we compute the final graph signature similarity by multiplying the rectification factor Rectlength(Grapha, Graphb) by the cosine similarity Simcosine(Siga, Sigb). According to the
algorithm definition, the final similarity of two binary signatures would still be 1.0 if their graph signatures are exactly the same, and the size rectification factor is only used to penalize the input graph vectors that are sufficiently different.
2.1.4 Fuzzy Hash Generation and Comparison
The above binary graph signature representation provides a viable similarity comparison mechanism, but the signature size will increase exponentially when using larger n-gram sizes. For
example, the default binary graph signature is about 461MB for blended 5-gram graphical features, which cannot reasonably be printed out and is challenging to store and compare for large-scale analysis. To make the technique easy to use and facilitate the graph signature storage and compar-ison process, we further compress the raw binary graph signature into aK-bit vector representation
using fuzzy hashing principles.
Specifically, we pre-define a unique seed number and prepare K independent vectors with
elements that are selected at random from a Gaussian distribution, and configure each random vector to be the same dimension as the raw binary graph signatures. We useRVi to represent the
ith random vector and Sigb to represent the binary graph signature, and define the followingsgn
function for comparing each random vector against the binary graph signature:
sgn(RVi, Sigb) = 1 ifRVi·Sigb≥0 0 ifRVi·Sigb<0 (2.3)
In this way, each random vector is used to create one projection for the original binary graph signature based on the dot product between the random vector and the binary graph signature, and the output of K projections is a K-bit vector. The overall random projection procedure
is formally known as hyperplane locality sensitive hashing (LSH) [61, 62]. Since all the graph signatures are projected into{0, 1}space through the same hashing process, graph signatures with close “locality” will be projected to similar K-bit vectors. And we call the newly generatedK-bit
hash value a binary fuzzy hash2. Given two fuzzy hash outputsF H
aandF Hb, we apply Hamming similarity H(F Ha, F Hb) to measure the similarity between the projected hash outputs, and use⊕
to represent bit-wise xor operation and |S| to to represent the number of 1-bit in vector S. The
Hamming similarity measurement H(F Ha, F Hb) is defined as follows. 2
Note that the term “fuzzy” used here is mainly to describe the bit vector generation process, and it is unrelated to the fuzzy sets that was proposed by Lofti A Zadeh.
H(F Ha, F Hb) = 1−
|F Ha⊕F Hb|
K (2.4)
LSH is commonly used as a powerful technique for conducting efficient approximate nearest neighbor search with high-dimension objects. According to previous research presented in the LSH domain [61, 63]: (1) cosine similarity (as used for graph signature comparison) is one type of simi-larity measurement that admits LSH families; (2) for any simisimi-larity functionSim(x, y) that admits
LSH projection, we can always obtain an LSH familyF that maps original objects to {0, 1} space
and has the property that the projected object similarity (e.g., Hamming similarity) is proven to correspond to the original similarity function at 1+Sim2(x,y). Therefore, we use Simhash(F Ha, F Hb)
to estimate the original cosine similarity measurement between graph signatures through the fol-lowing equation:
Simhash(F Ha, F Hb) = 2×H(F Ha, F Hb)−1 (2.5)
Increasing the number of random projection vectors can make the similarity estimation more accurate. We evaluate the impact of differentK values on the estimation accuracy in Section 2.3.2.
The defaultK is experimentally chosen as 256, which results in a 256-bit vector. The total number
of graphical featuresN F for each binary is represented as a 32-bit integer, thus the final fuzzy hash
output is 288 bits by default. Given the N F value, we can calculate the graph size rectification
factorRectlength(Grapha, Graphb) as defined in Equation 2.2. In the end, we compute the final fuzzy
hash similarity by multiplying the rectification factorRectlength(Grapha, Graphb) to the estimated
hash similaritySimhash(F Ha, F Hb).
2.2 Evaluation of CFG Similarity Analysis Algorithms
To evaluate the effectiveness and accuracy of the n-gram based CFG comparison algorithm
CFGSimNG, we compare it against several representative CFG comparison algorithms. Our evalu-ation only focuses on the algorithms’ capability to differentiate CFG structureswithoutconsidering basic block content. The auxiliary information provided by basic block content could further
im-prove CFG comparison. The abstraction process discussed in Section 2.1.1 can be extended to incorporate basic block content information and we leave this for future work.
2.2.1 Existing CFG Similarity Comparison Algorithms
A control flow graph (CFG) is an important structural representation of a binary program, and a CFG similarity analysis algorithm is the core technical component of many existing security analyses. Generic graph isomorphism analysis is a hard problem [64–67], and various techniques have been proposed for approximate CFG similarity analysis by leveraging unique properties pre-sented in a CFG (e.g., bounded degrees).
1. Min-cost bipartite graph matching: Hu [17] developed an edit distance based graph isomor-phism algorithm by building a cost matrix that represents the costs of mapping the different nodes in two graphs, and using the Hungarian algorithm [68] to find an optimal mapping between the nodes such that the total cost (i.e., edit distance) is minimized. Vujoˇsevi´c [57] iteratively built a similarity matrix between the nodes of two CFGs based on the similarity of their neighbors, and adopted the Hungarian algorithm to find the matching between the nodes in two graphs such that the resulting similarity score is the highest.
2. Maximum common subgraph matching: McGregor [55] designed a backtrack search algorithm to find the maximal common subgraph of two graphs. This idea has been used to design efficient CFG similarity comparison algorithms, and adopted for binary semantic difference analysis [69] and binary code search [54] scenarios. Given the maximal common subgraph output, a graph similarity score was calculated as the maximal number of common subgraph nodes divided by the number of available nodes between two graphs.
3. k-subgraph matching: Kruegelet al. [56] designed an algorithm based onk-subgraph mining. They generated a spanning tree for each node in the graph such that the out-degree of every node was less than or equal to 2, then recursively generated k-subgraphs from the spanning
trees by considering all possible allocations of k−1 nodes under the root node. Each k
-subgraph was then canonicalized and converted into a fingerprint by concatenating the rows of its adjacency matrix.
4. Simulation-based graph similarity: Sokolsky [70] modeled the control flow graphs using La-beled Transition Systems. Given two CFGs, they recursively matched the most similar out-going nodes starting from the entry nodes, and summed up the similarity of the matched nodes and edges. The overall similarity of two CFGs was then defined by a recursive formula. 5. Graph embedding: Recently, researchers have proposed to use graph embedding for CFG similarity analysis. For example, Genius [71] proposed to learn high-level feature representa-tions from an attributed CFG (ACFG) and encoded the graphs into numerical vectors using a codebook-based graph matching approach. They used 6 block-level attributes (e.g., number of instructions) and 2 inter-block level attributes (e.g., number of offspring). Using the same features as Genius, Gemini [72] proposed a neural network-based approach to compute the graph embedding for an ACFG, and achieved better accuracy and efficiency. CFG similarity is then measured by comparing the embedded graph representation.
Our blendedn-gram graphical feature based CFG comparison algorithmCFGSimNGbelongs
to the graph embedding category. However, CFGSimNG is different from Genius and Gemini in that it is basic block content-agnostic, and the graph embedding is always deterministic and requires no separate training process.
2.2.2 CFG Comparison Algorithm Evaluation Strategy
It is almost impossible to prepare a ground truth dataset using real world CFGs that present known similarity levels. To the best of our knowledge, the only prior work that uses any dataset to evaluate CFG similarity algorithms is that of Chan, et al. [73]. They created a ground truth CFG dataset by applying different levels of edit operations to a seed CFG, and checked whether the algorithms can output similar level of similarity differences between the generated testing CFGs and the seed CFG.
However, we observe that Chan et al.’s methodology is problematic from the following per-spectives: (1) the ground truth dataset and evaluating strategy are inherently biased towards edit-distance based CFG comparison algorithms; (2) different edit operations (e.g., adding node, adding edge, deleting node, deleting edge) may have different costs: editing of a node will not
impact any existing edges, but editing of an edge will always affect two nodes, thus the testing CFGs generated from the same levels of edit operations may present different similarity levels.
Therefore, we propose a new CFG comparison algorithm evaluation strategy by embedding the CFG comparison algorithm in ahierarchical agglomerative clustering system as the customized distance function3, then use the customized distance function to conduct clustering analysis for the same ground-truth dataset, and use the overall clustering result as a performance indicator of the corresponding CFG similarity function. Hierarchical agglomerative clustering is a bottom up version of hierarchical clustering, in which all input items are initially considered as singleton clusters, then for a specified distance threshold t, the algorithm iteratively finds the clusters with minimum distance and merges the clusters as long as the corresponding cluster distance d is less thant. The distance between two clusters is often referred to as “linkage” and the following three linkage criteria are commonly used: single linkage considers the cluster distance as the minimum distance between all the entries of two clusters; average linkage considers the cluster distance as the average distance between all the entries of two clusters; complete linkage considers the cluster distance as the maximum distance between all the entries of two clusters.
The rationale for evaluating different CFG comparison algorithms through hierarchical clus-tering analysis are that: (1) the fundamental component of hierarchical clusclus-tering system is the similarity measurement between all input items, which can be pre-calculated as a distance matrix using each CFG comparison function. (2) when analyzing the same ground truth dataset, the only parameter that will impact the final clustering result is the distance matrix which is controlled by each CFG comparison algorithm. (3) the clustering analysis procedure evaluates the capability of identifying similar items and recognizing different items at the same time.
To measure the clustering results, we adopt the measurement of precision and recall. Consid-ering a collection ofnCFGs that are reliably separated intomgroups, we can represent this ground truth reference set asT =T1, T2, ..., Tm. For a specific distance threshold, a hierarchical
agglomer-ative clustering algorithm separates the CFGs into c clusters, then the results can be represented asC =C1, C2, ..., Cc. The precision Pand recall Rare defined as:
3
distance of CFGs is calculated by the provided algorithm, distance of CFG clusters is calculated based on individual CFG pairs according to the linkage strategy
P = 1nPc
i=1max(|Ci∩T1|,|Ci∩T2|, ...,|Ci∩Tm|)
R= n1 Pm
j=1max(|Tj∩C1|,|Tj∩C2|, ...,|Tj∩Cc|)
Precision and recall measure two competing performance criteria of a clustering algorithm: the ability to separate items from different clusters, and the ability to group together items belonging to the same cluster. The extreme partition where every element forms a singleton cluster always yields a precision of 1 but will have a low recall. On the other hand, if a clustering algorithm puts all the items in a single cluster, the recall will be 1 but precision will be low. We consider the intersection point (or nearest point) between precision and recall to be the optimal clustering output. For simplicity, all the clustering results are subsequently measured with a single F-score, which is the harmonic mean of the optimal precision and recall and is calculated using the following equation.
F = 2·precisionprecision+·recallrecall
To facilitate evaluating arbitrary CFG comparison algorithms, we plan to release the evalu-ation framework and the corresponding dataset. A new CFG comparison algorithm can be easily evaluated in this framework by providing a plugin that takes two CFGs as input and outputs a similarity score.
2.2.3 Experiment Data Preparation
To create a ground-truth CFG dataset, we compiled the latest version of Android Open Source Project code and obtained 588 ELF ARM64 binaries. We analyzed the compiled binaries, and collected all the function level CFGs that have 20 nodes, then randomly selected 5 seed CFGs from all available 20-node CFGs. We selected CFGs with 20 nodes since it typically provides enough varieties between different CFGs, and the individual CFG comparison won’t take too much time to finish for all the evaluated CFG comparison algorithms.
For each seed CFG, we apply one levelof edit operation (e.g., adding node, deleting node4, adding edge, deleting edge) to create a group of artificial CFGs. Since the CFGs from each group are derived from the same seed CFG, CFGs within each group would be more similar to each other
4
than CFGs from different groups, either considering the “minimum edit distance” or “maximum common subgraph” perspectives. In the end, we obtained a collection of 1934 artificial CFGs in 5 different groups.
2.2.4 Evaluation Results
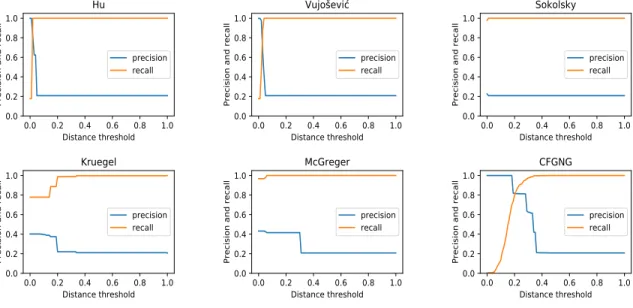
For algorithms proposed by Hu [17], Kruegel [56], Sokolsky [70], and Vujoˇsevi´c [57], we use the implementations provided by Chan [73]. We implemented McGreger’s algorithm [55] and our CFGSimNG. All the algorithm implementations evaluated in this section only consider the topology of the CFG and ignore the content of basic blocks, i.e., the content similarity between all basic block pairs are considered to be 1. Therefore, these implementations may not faithfully represent the full capability of the original designs, and the evaluation results presented in this section only reflect the algorithms’ capability of measuring similarity of CFGs’ structures, without considering the basic block content. The existing graph embedding based CFG comparison algorithms [71, 72] described in Section 2.2.1 are not evaluated since they rely upon a separate training process and require specific features that are derived from concrete basic block content. If the default algorithm output is a distance score d, we compute the similarity score as 1−d. The final outputs for all
algorithms are normalized ranging from 0 to 1.
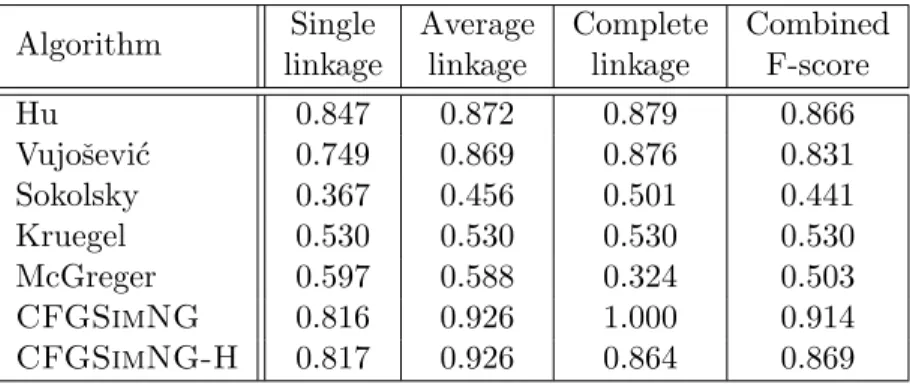
Table 2.2: Optimal clustering results for different algorithms Algorithm Single Average Complete Combined linkage linkage linkage F-score
Hu 0.847 0.872 0.879 0.866 Vujoˇsevi´c 0.749 0.869 0.876 0.831 Sokolsky 0.367 0.456 0.501 0.441 Kruegel 0.530 0.530 0.530 0.530 McGreger 0.597 0.588 0.324 0.503 CFGSimNG 0.816 0.926 1.000 0.914 CFGSimNG-H 0.817 0.926 0.864 0.869
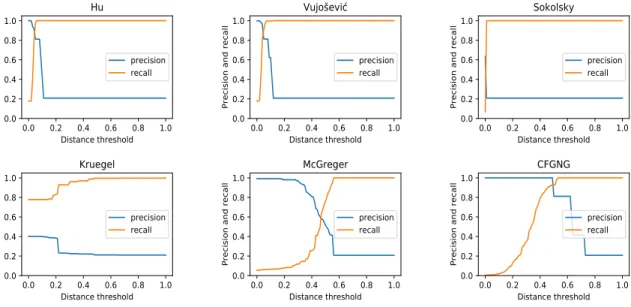
To avoid the bias towards a particular linkage strategy, we report the clustering results with three linkage approaches for all CFG comparison algorithms. We summarize the optimal clustering results for different algorithms in Table 2.2, and present the detailed single-linkage CFG clustering results in Figure 2.4, the average-linkage CFG clustering results in Figure 2.5, the complete-linkage