Biophysical and biochemical markers at 35-37 weeks’ gestation in the prediction of adverse perinatal outcome
Nuria Valiño,1 Giuliana Giunta,1 Dahiana M Gallo,1 Ranjit Akolekar,1,2 Kypros H. Nicolaides1
Running head: Third trimester biomarkers of adverse perinatal outcome
Key words: Third trimester screening, Perinatal outcome, Uterine artery Doppler, Umbilical artery Doppler, Middle cerebral artery Doppler, Mean arterial pressure, Placental growth factor, sFlt-1, Pyramid of antenatal care.
1. Harris Birthright Research Centre of Fetal Medicine, King’s College Hospital, London, UK. 2. Department of Fetal Medicine, Medway Maritime Hospital, Kent.
Acknowledgement: This study was supported by a grant from the Fetal Medicine Foundation (Charity No: 1037116) and by the European Union 7th Framework Programme - FP7-HEALTH-2013-INNOVATION-2 (ASPRE Project # 601852).
Correspondence
Ranjit Akolekar, MRCOG Department of Fetal Medicine, Medway Maritime Hospital,
Windmill Road,Gillingham,Kent,ME7 5NY Mail: ranjit.akolekar@nhs.net
Abstract
Objective: To investigate the potential value of biophysical and biochemical markers at 35-37 weeks’ gestation in the prediction of adverse perinatal outcome.
Methods: Screening study in 3,953 singleton pregnancies at 35-37 weeks. Estimated fetal weight (EFW), uterine artery pulsatility index (PI), umbilical artery PI, fetal middle cerebral artery (MCA) PI, mean arterial pressure (MAP), serum placental growth factor (PLGF) and soluble fms-like tyrosine kinase-1 (sFlt-1) were measured. The detection rate (DR) and false positive rate (FPR) of screening by each biomarker were estimated for preeclampsia, delivery of small for gestational age (SGA) neonate, cesarean section for fetal distress before or during labor, umbilical arterial cord blood pH <7.0 or umbilical venous blood pH <7.1, Apgar score <7 at 5 minutes and admission to the neonatal unit (NNU).
Results: Multivariable regression analysis demonstrated that significant prediction of PE was provided by PLGF, sFlt-1 and MAP with DR of 73% at 10% FPR. Prediction of SGA was provided by EFW, PLGF and uterine artery PI with DR of 63% at 10% FPR. Prediction of cesarean section for fetal distress before labor was provided by EFW and umbilical artery PI with DR of 100% at 10% FPR. Prediction of fetal distress in labor was provided by EFW and sFlt-1 with DR of 15% at 10% FPR. There were no significant differences from the normal outcome group in any of the biomarkers for low cord blood pH, low Apgar score or NNU admission.
Conclusion: At 35-37 weeks’ gestation, biomarkers of impaired placentation and fetal hypoxemia provide good prediction of PE, SGA and fetal distress before labor, but poor or no prediction of adverse events in labor or after birth.
Introduction
Impaired placentation and / or placental dysfunction, reflected in increased pulsatility index (PI) in the uterine arteries and reduced serum placental growth factor (PLGF) and increased soluble fms-like tyrosine kinase-1 (sFlt-1), are associated with subsequent development of preeclampsia (PE) and birth of small for gestational age (SGA) neonates [1-3]. In the 1980’s analysis of fetal blood obtained by cordocentesis demonstrated that some SGA fetuses are hypoxemic and acidemic and have a metabolic profile compatible with intrauterine starvation [4-6]. In SGA fetuses, hypoxemia was associated with increased impedance to flow in the uterine and umbilical arteries and reduced impedance in the fetal middle cerebral artery (MCA) [7-9]. It was recognized that the majority of fetuses that are growth restricted due to uteroplacental insufficiency may not actually be SGA [10] and it was speculated that if the biomarkers of fetal hypoxia are as useful in identifying affected fetuses that are not small as they are for SGA fetuses, the biomarkers may replace measurement of fetal size for the antenatal prediction of fetal asphyxia [7].
A large screening study at 30-34 weeks’ gestation reported that biomarkers of impaired placentation / placental dysfunction and fetal hypoxemia are useful in the prediction of PE and birth of SGA neonates [11]. However, the biomarkers provide poor or no prediction of adverse events in labor or after birth, including cesarean section for fetal distress, low cord blood pH, low Apgar score or neonatal unit (NNU) admission for cases other than those with PE and / or SGA [11]. Possible explanations for poor performance of screening at 30-34 weeks in prediction of adverse events in labor or after birth are firstly, the premise that non SGA starved fetuses are as hypoxic as SGA starved fetuses is not true [12], secondly, the outcome measures are primarily the consequence of problems which start in labor and therefore cannot be predicted using markers of chronic feto-placental hypoxia and thirdly, assessment at 30-34 weeks is too remote from events in labor and that assessment at 35-37 weeks may improve the screening performance for labor related adverse outcomes.
The objective of this screening study is to investigate the potential value of uterine artery PI, umbilical artery PI, MCA PI, mean arterial pressure (MAP) and serum PLGF and sFlt-1, at 35-37 weeks’ gestation, in the prediction of adverse perinatal outcome, including development of PE, birth of SGA neonate, cesarean section for fetal distress before or during labor, umbilical arterial cord blood pH <7.0 or umbilical venous blood pH <7.1, Apgar score <7 at 5 minutes and NNU admission.
Methods
The data for this study were derived from prospective screening for adverse obstetric outcomes in women attending for their routine hospital visit in the third trimester of pregnancy at King’s College Hospital, London and Medway Maritime Hospital, Kent, between February 2014 and December 2014. This visit, which was held at 35+0-37+6 weeks’ gestation, included recording of maternal characteristics and medical history, estimation of fetal size from ultrasound measurement of fetal head circumference, abdominal circumference and femur length [13], transabdominal Doppler assessment of the uterine artery, umbilical artery and fetal MCA PI [14-16], measurement of MAP [17] and serum concentration of PLGF and sFlt-1 (Cobas e411 system, Roche Diagnostics, Penzberg, Germany). Gestational age was determined by the measurement of fetal crown-rump length at 11-13 weeks or the fetal head circumference at 19-24 weeks [13,18].
Written informed consent was obtained from the women agreeing to participate in a study on adverse pregnancy outcome, which was approved by the Ethics Committee of each participating hospital. The pregnancies included in the study were those with data on all eight biomarkers resulting in live birth or stillbirth of phenotypically normal babies at >24
weeks’ gestation. Patient characteristics
Patient characteristics recorded included maternal age, racial origin (Caucasian, Afro-Caribbean, South Asian, East Asian and mixed), method of conception (spontaneous, use of ovulation drugs or in vitro fertilization), cigarette smoking during pregnancy, medical history of chronic hypertension, diabetes mellitus, systemic lupus erythematosus (SLE) or anti-phospholipid syndrome (APS) and parity (parous or nulliparous if no previous pregnancies at > 24 weeks). Maternal weight and height were measured.
Outcome measures
Data on pregnancy outcome were collected from the hospital maternity records or the general medical practitioners of the women. The outcome measures of the study were PE, SGA, cesarean section for fetal distress before or during labor, umbilical arterial cord blood pH <7.0 or venous blood pH <7.1, Apgar score <7 at 5 minutes and admission to NNU. The newborn was considered to be SGA if the birth weight was less than the 10th percentile after correction for gestational age at delivery [19]. The definition of PE was that of the International Society for the Study of Hypertension in Pregnancy [20].
Statistical analysis
Comparison between the outcome groups was by χ2-test or Fisher’s exact test for categorical variables and Mann Whitney-U test for continuous variables. Categorical data are presented as n (%) and continuous data as median and interquartile range (IQR). The measured values of uterine artery PI, umbilical artery PI, MCA PI, MAP, PLGF and sFlt-1 were expressed as multiple of the median (MoM) after adjustment for variables from maternal characteristics and medical history that affect these measurements [21-25]. Univariable and multivariable logistic regression analysis was used to determine if log10 MoM of each biomarker had a significant contribution in predicting each adverse outcome. The detection rate (DR) and false positive rate (FPR) of screening were estimated for each adverse outcome. The performance of screening was determined by receiver operating characteristic (ROC) curves analysis.
The statistical software package SPSS 22.0 (IBM SPSS Statistics for Windows, Version 22.0. Armonk, NY: IBM Corp, 2013) was used for the data analyses.
Results
Study population
The characteristics of the study population and the various subgroups according to outcome are given in Table 1.
Biomarkers in pregnancies with PE or birth of SGA neonates
The median MoM values of biomarkers and percentage of values above or below a percentile for pregnancies resulting in PE or birth of SGA neonates are compared to the unaffected pregnancies by any one of these adverse outcomes are shown in Table 2.
In the pregnancies that developed PE, compared to the unaffected group, there was higher uterine artery PI, MAP and serum sFlt-1 and lower serum PLGF (Table 2). Multivariable
logistic regression analysis demonstrated that significant contributions to PE were provided by MAP, sFlt-1 and PLGF, (AUROC curve 0.913, 95% CI 0.874-0.952). The DR of combined screening by all significant contributors was 73.3%, at FPR of 10% (Figure 1).
In the pregnancies with SGA neonates, compared to the unaffected group, there was higher uterine artery PI, MAP, umbilical artery PI and MAP and lower EFW and serum PLGF (Table 2). Multivariable logistic regression analysis demonstrated that significant contributions for SGA were provided by EFW, PLGF and uterine artery PI (AUROC curve 0.883, 95% CI 0.867-0.899). The DR of combined screening by all significant contributors was 62.8%, at FPR of 10%, (Figure 1).
Biomarkers in pregnancies with stillbirth
In the study population there was one stillbirth. The interval between assessment and delivery was 6.0 weeks. There were no risk factors noted in the maternal demographic characteristics as the pregnancy was in a nulliparous woman following a spontaneous conception, who was a non-smoker with a maternal body mass index within normal range and no maternal medical illness of note with no obstetric complications in the current pregnancy. The uterine artery PI, MAP and serum sFlt-1 were below the 95th percentile and serum PLGF was more than the 5th precentile. The estimated birth weight z-score was -2.4. Biomarkers in pregnancies delivered by cesarean section for fetal distress
In the 3,952 pregnancies with live births, there were 3,016 with vaginal delivery following spontaneous or induced labor, 436 with elective cesarean section for a variety of indications and 500 with cesarean section following spontaneous or induced labor; in the latter group the indication for cesarean section was fetal distress in 275 cases. In the elective cesarean section group (n=436) there were a variety of indications, including breech or transverse lie (n=83), placenta previa (n=22), previous cesarean section, traumatic birth or maternal request (n=291), maternal medical disorder (n=33) and SGA fetuses with fetal compromise diagnosed by abnormal fetal heart rate patterns or fetal Doppler indices (n=7).
The median MoM values of biomarkers and percentage of values above or below a percentile for pregnancies resulting in delivery by cesarean section for fetal distress before labor (n=7) and during labor (n=275) or and those delivering vaginally are shown in Table 3. In the group with cesarean section for fetal distress before labor, compared to those delivering vaginally, there was significant alteration in all biomarkers (Table 3). In the study population for assessment of fetal distress in labor, the median interval from assessment to delivery was 4.0 weeks (IQR 3.0-4.7). In the group with cesarean section for fetal distress in labor, compared to those delivering vaginally, there was higher EFW and serum sFlt-1, but no significant differences in median value of the other biomarkers. Multivariable logistic regression analysis demonstrated that significant contribution to cesarean section for fetal distress was provided by EFW and sFlt-1 (AUROC curve 0.566, 95% CI 0.531-0.601); the DR was 15.3%, at 10% FPR (Figure 1).
Biomarkers in pregnancies with adverse outcome after delivery
The median MoM values of biochemical and biophysical markers and percentage of values above or below a percentile in pregnancies with and without low cord blood pH, low Apgar score at 5 minutes and NNU admission are shown in Table 4. In the group with low cord blood pH compared to those with normal pH, in those with low 5 minute Apgar score compared to those with normal score, and in those with NNU admission compared to those without admission, there were no significant differences in the median MoM values of any of the biomarkers.
Discussion
Main findings of the study
The findings of this study demonstrate that in pregnancies that develop PE and those that result in delivery of SGA neonates there is biophysical and biochemical evidence of impaired placentation or placental dysfunction reflected in increased uterine artery PI, MAP and serum sFlt-1 and reduced serum PLGF. Screening by a combination of biomarkers at 36 weeks’ gestation predicts the majority of pregnancies that develop PE and those that deliver SGA neonates.
Impaired placentation / placental dysfunction and fetal hypoxemia are also observed in a small group of pregnancies with SGA fetuses delivering by elective cesarean section for evidence of fetal distress. However, combined screening at 36 weeks is not useful in the prediction of fetal distress in labor necessitating delivery by cesarean section, low cord blood pH, low Apgar score, or NNU admission.
Strengths and limitations of the study
The strengths of this third-trimester screening study are first, examination of pregnant women attending for routine care, second, use of a specific methodology and appropriately trained doctors to measure MAP and carry out the Doppler studies, third, use of automated machines to prospectively obtain reproducible measurements of serum PLGF and sFlt-1, fourth, estimate MoM values for biophysical and biochemical markers after adjustment for factors that affect the measurements, and fifth, examination of a wide range of well accepted indicators of adverse perinatal outcome.
The main limitation of the study is that the results of the 35-37 weeks’ scan were made available to the obstetricians of the patients who would have taken specific actions on further monitoring and delivery for the cases of suspected SGA with abnormal Doppler findings. It could therefore be argued that the performance of screening for adverse perinatal outcomes by biomarkers of impaired placentation and fetal hypoxemia would have been negatively biased. It is possible that some of the cases of SGA and fetal distress that were delivered by elective cesarean section would have resulted in stillbirth or fetal distress in labor and low cord blood pH had they not been detected by the routine assessment at 36 weeks. However, the number of these cases was very small and it is therefore unlikely that they would have had a major impact on the overall effect of adverse events in labor and after birth.
Comparison with findings from previous studies
The results of this study are compatible with those of the only previous screening study that examined biomarkers of impaired placentation / placental dysfunction and fetal hypoxemia at 30-34 weeks’ gestation and reported that these markers are useful in the prediction of PE and birth of SGA neonates, but not of adverse events in labor or after birth [13].
Implications for clinical practice
An integrated clinic at 36 weeks’ gestation, which includes fetal biometry and measurement of biomarkers, identifies a high proportion of pregnancies that subsequently develop PE and those delivering SGA neonates. It was previously proposed that prediction of most cases of term PE and SGA is best achieved by a third-trimester assessment at around 36 weeks’ gestation. It was also suggested that such timing of assessment would inevitably miss the cases of preterm PE and SGA and it was therefore proposed that these cases should be
identified at an integrated clinic at 22 weeks and receive close monitoring for early diagnosis of PE and / or SGA and appropriate timing of delivery [3,26].
In pregnancies without SGA or PE, combined screening at 36 weeks is not useful in the prediction of adverse events during labor or after birth. It is possible that this finding is the consequence of the long delay of about four weeks between assessment and delivery or the effects of events in labor and delivery on the outcome measures that overshadow the contribution of chronic hypoxia. Alternatively, this finding provides support for the hypothesis proposed more than 20 years ago that impaired placentation or placental dysfunction is usually not severe enough to cause fetal hypoxia until reduced nutrition has stunted the size of the fetus sufficiently to become SGA; consequently, tests of fetal hypoxia would rarely be useful when the fetus is growing normally [12]. Research into the causes of morbidity in appropriately grown fetuses should perhaps look for pathologies other than chronic fetal hypoxia.
References
1. Garcia-Tizon Larroca S, Tayyar A, Poon LC, Wright D, Nicolaides KH. Competing risks model in screening for preeclampsia by biophysical and biochemical markers at 30-33 weeks' gestation. Fetal Diagn Ther 2014; 36: 9-17.
2. Bakalis S, Peeva G, Gonzalez R, Poon LC, Nicolaides KH. Prediction of small-for-gestational-age neonates: screening by biophysical and biochemical markers at 30-34 weeks. Ultrasound Obstet Gynecol 2015. doi: 10.1002/uog.14863.
3. Poon LC, Lesmes C, Gallo DM, Akolekar R, Nicolaides KH. Prediction of small for gestational age neonates: Screening by biophysical and biochemical markers at 19-24 weeks. Ultrasound Obstet Gynecol 2015. doi: 10.1002/uog.14904.
4. Nicolaides KH, Soothill PW, Rodeck CH, Campbell S. Ultrasound guided sampling of umbilical cord and placental blood to assess fetal wellbeing. Lancet 1986; 1: 1065-7. 5. Soothill PW, Nicolaides KH, Campbell S. Prenatal asphyxia, hyperlacticaemia,
hypoglycaemia and erythroblastosis in growth retarded fetuses. BMJ 1987; 294: 1051-3.
6. Economides DL, Nicolaides KH, Campbell S. Metabolic and endocrine findings in appropriate and small for gestational age fetuses. J Perinat Med 1991; 19: 97-105. 7. Nicolaides KH, Bilardo KM, Soothill PW, Campbell S. Absence of end diastolic
frequencies in the umbilical artery a sign of fetal hypoxia and acidosis. BMJ 1988; 297: 1026-7.
8. Soothill PW, Nicolaides K, Bilardo KM, Hackett GA, Campbell S. Uteroplacental blood velocity resistance index and umbilical venous pO2, pCO2, pH, lactate, and erythroblast count in growth retarded fetuses. Fetal Therapy 1986; 1: 176-179.
9. Vyas S, Nicolaides KH, Bower S, Campbell S. Middle cerebral artery flow velocity waveforms in fetal hypoxaemia. Br J Obstet Gynaecol 1990; 97: 797-803.
10. Chard T. Placental function tests. In N. J. Wald, ed: Antenatal and Neonatal Screening, Oxford University Press, Oxford 1984.
11. Valiño N, Giunta G, Gallo DM, Akolekar R, Nicolaides KH. Biophysical and biochemical markers at 30–34 weeks’ gestation in the prediction of adverse perinatal outcome.
Ultrasound Obstet Gynecol 2015. doi: 10.1002/uog.14928.
12. Soothill PW, Ajayi RA, Campbell S, Nicolaides KH. Prediction of morbidity in small and normally grown fetuses by fetal heart rate variability, biophysical profile score and umbilical artery Doppler studies. Br J Obstet Gynaecol 1993; 100: 742-745.
13. Snijders RJ, Nicolaides KH. Fetal biometry at 14-40 weeks' gestation. Ultrasound Obstet Gynecol 1994; 4: 34-48.
14. Albaiges G, Missfelder-Lobos H, Lees C, Parra M, Nicolaides KH. One-stage screening for pregnancy complications by color doppler assessment of the uterine arteries at 23 weeks' gestation. Obstet Gynecol 2000; 96: 559-564.
15. Acharya G, Wilsgaard T, Berntsen GK, Maltau JM, Kiserud T. Reference ranges for serial measurements of umbilical artery Doppler indices in the second half of
pregnancy. Am J Obstet Gynecol 2005; 192: 937-944.
16. Vyas S, Campbell S, Bower S, Nicolaides KH. Maternal abdominal pressure alters fetal cerebral blood flow. Br J Obstet Gynaecol 1990; 97: 740-742.
17. Poon LC, Zymeri NA, Zamprakou A, Syngelaki A, Nicolaides KH. Protocol for measurement of mean arterial pressure at 11-13 weeks' gestation. Fetal Diagn Ther 2012; 31: 42-48.
18. Robinson HP, Fleming JE: A critical evaluation of sonar crown rump length measurements. Br J Obstet Gynaecol 1975; 82: 702-710.
19. Poon LCY, Volpe N, Muto B, Syngelaki A, Nicolaides KH: Birthweight with gestation and maternal characteristics in live births and stillbirths. Fetal Diagn Ther 2012; 32: 156-165.
20. Brown MA, Lindheimer MD, de Swiet M, Van Assche A, Moutquin JM: The classification and diagnosis of the hypertensive disorders of pregnancy: Statement from the international society for the study of hypertension in pregnancy (ISSHP).
Hypertens Pregnancy 2001; 20: IX-XIV.
21. Tayyar A, Guerra L, Wright A, Wright D, Nicolaides KH. Uterine artery pulsatility index in the three trimesters of pregnancy: Effects of maternal characteristics and medical history. Ultrasound Obstet Gynecol 2015; 45: 689-697.
22. Akolekar R, Sarno L, Wright A, Wright D, Nicolaides KH. Fetal middle cerebral artery and umbilical artery pulsatility index: effects of maternal characteristics and medical history. Ultrasound Obstet Gynecol 2015; 45: 402-408.
23. Wright A, Wright D, Ispas A, Poon LC, Nicolaides KH. Mean arterial pressure in the three trimesters of pregnancy: effects of maternal characteristics and medical history.
Ultrasound Obstet Gynecol 2015; 45: 698-706.
24. Tsiakkas A, Duvdevani N, Wright A, Wright D, Nicolaides KH. Serum placental growth factor in the three trimesters of pregnancy: effects of maternal characteristics and medical history. Ultrasound Obstet Gynecol 2015; 45: 591-598.
25. Tsiakkas A, Duvdevani N, Wright A, Wright D, Nicolaides KH. Serum sFlt-1 in the three trimesters of pregnancy: effects of maternal characteristics and medical history.
Figure legends
Figure 1. Receiver operating characteristic curves for prediction of preeclampsia (PE), small for gestational age (SGA) neonates and fetal distress resulting in delivery by cesarean section before and during labor.
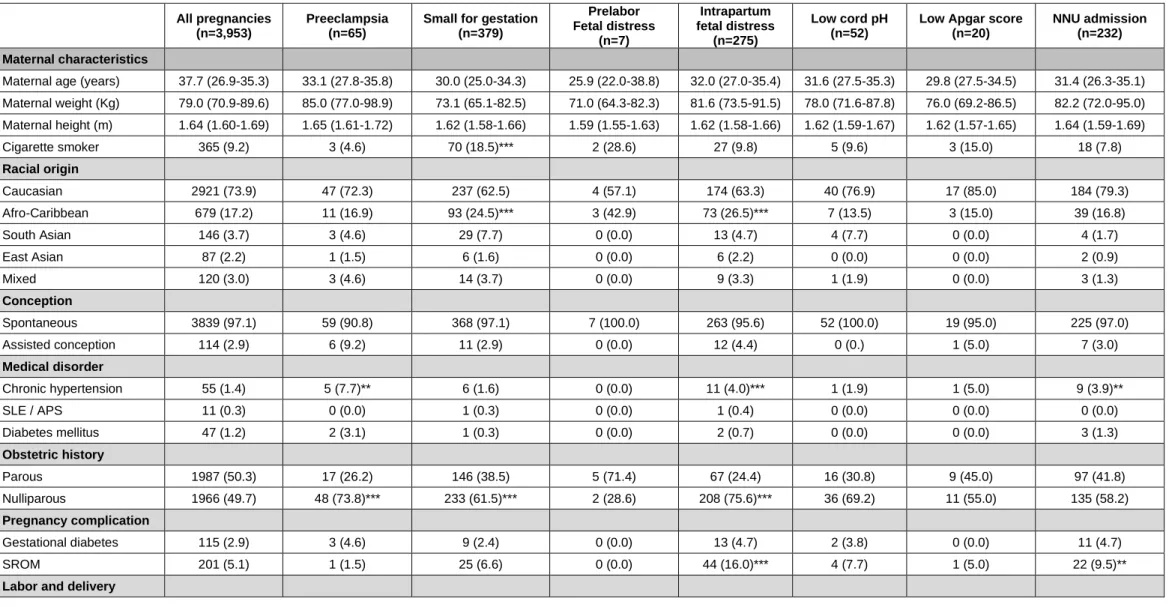
Table 1. Maternal and pregnancy characteristics of the study population and subgroups of preeclampsia, small for gestational age neonates, fetal distress before or during labor leading to cesarean section, low umbilical arterial or venous cord blood pH, low 5-minute Apgar score and admission to the neonatal unit. In each group the data are compared to the cohort without the outcome measure.
All pregnancies (n=3,953)
Preeclampsia (n=65)
Small for gestation (n=379) Prelabor Fetal distress (n=7) Intrapartum fetal distress (n=275) Low cord pH (n=52)
Low Apgar score (n=20)
NNU admission (n=232) Maternal characteristics
Maternal age (years) 37.7 (26.9-35.3) 33.1 (27.8-35.8) 30.0 (25.0-34.3) 25.9 (22.0-38.8) 32.0 (27.0-35.4) 31.6 (27.5-35.3) 29.8 (27.5-34.5) 31.4 (26.3-35.1) Maternal weight (Kg) 79.0 (70.9-89.6) 85.0 (77.0-98.9) 73.1 (65.1-82.5) 71.0 (64.3-82.3) 81.6 (73.5-91.5) 78.0 (71.6-87.8) 76.0 (69.2-86.5) 82.2 (72.0-95.0) Maternal height (m) 1.64 (1.60-1.69) 1.65 (1.61-1.72) 1.62 (1.58-1.66) 1.59 (1.55-1.63) 1.62 (1.58-1.66) 1.62 (1.59-1.67) 1.62 (1.57-1.65) 1.64 (1.59-1.69) Cigarette smoker 365 (9.2) 3 (4.6) 70 (18.5)*** 2 (28.6) 27 (9.8) 5 (9.6) 3 (15.0) 18 (7.8) Racial origin Caucasian 2921 (73.9) 47 (72.3) 237 (62.5) 4 (57.1) 174 (63.3) 40 (76.9) 17 (85.0) 184 (79.3) Afro-Caribbean 679 (17.2) 11 (16.9) 93 (24.5)*** 3 (42.9) 73 (26.5)*** 7 (13.5) 3 (15.0) 39 (16.8) South Asian 146 (3.7) 3 (4.6) 29 (7.7) 0 (0.0) 13 (4.7) 4 (7.7) 0 (0.0) 4 (1.7) East Asian 87 (2.2) 1 (1.5) 6 (1.6) 0 (0.0) 6 (2.2) 0 (0.0) 0 (0.0) 2 (0.9) Mixed 120 (3.0) 3 (4.6) 14 (3.7) 0 (0.0) 9 (3.3) 1 (1.9) 0 (0.0) 3 (1.3) Conception Spontaneous 3839 (97.1) 59 (90.8) 368 (97.1) 7 (100.0) 263 (95.6) 52 (100.0) 19 (95.0) 225 (97.0) Assisted conception 114 (2.9) 6 (9.2) 11 (2.9) 0 (0.0) 12 (4.4) 0 (0.) 1 (5.0) 7 (3.0) Medical disorder Chronic hypertension 55 (1.4) 5 (7.7)** 6 (1.6) 0 (0.0) 11 (4.0)*** 1 (1.9) 1 (5.0) 9 (3.9)** SLE / APS 11 (0.3) 0 (0.0) 1 (0.3) 0 (0.0) 1 (0.4) 0 (0.0) 0 (0.0) 0 (0.0) Diabetes mellitus 47 (1.2) 2 (3.1) 1 (0.3) 0 (0.0) 2 (0.7) 0 (0.0) 0 (0.0) 3 (1.3) Obstetric history Parous 1987 (50.3) 17 (26.2) 146 (38.5) 5 (71.4) 67 (24.4) 16 (30.8) 9 (45.0) 97 (41.8) Nulliparous 1966 (49.7) 48 (73.8)*** 233 (61.5)*** 2 (28.6) 208 (75.6)*** 36 (69.2) 11 (55.0) 135 (58.2) Pregnancy complication Gestational diabetes 115 (2.9) 3 (4.6) 9 (2.4) 0 (0.0) 13 (4.7) 2 (3.8) 0 (0.0) 11 (4.7) SROM 201 (5.1) 1 (1.5) 25 (6.6) 0 (0.0) 44 (16.0)*** 4 (7.7) 1 (5.0) 22 (9.5)**
SLE= systemic lupus erythematosus; APS = anti-phospholipid syndrome; SROM = Spontaneous rupture of membranes; VD = vaginal delivery; CS = cesarean section; GA = gestational age; EFW = estimated fetal weight; BW = birth weight
Significance value adjusted for multiple comparisons with post hoc Bonferonni correction * = p<0.01; ** = p<0.001
Spontaneous labor, VD 2461 (62.3) 3 (4.6) 232 (61.2) 0 (0.0) 0 (0.0) 22 (42.3) 10 (50.0) 116 (50.0) Spontaneous labor, CS 303 (7.7) 5 (7.7) 28 (7.4) 0 (0.0) 164 (59.6) 12 (23.1) 2 (10.0) 31 (13.4)** Induced labor, VD 556 (14.1) 30 (46.2)*** 70 (18.5) 0 (0.0) 0 (0.0) 7 (13.5) 0 (0.0) 38 (16.4) Induced labor, CS 197 (5.0) 14 (21.5)*** 20 (5.3) 0 (0.0) 111 (40.4)*** 6 (11.5) 5 (25.0) 21 (9.1)** Elective CS 436 (11.0) 13 (20.0) 29 (7.7) 7 (100.0) 0 (0.0) 5 (9.6) 3 (15.0) 26 (11.2) Assessment GA at assessment (wks) 36.1 (36.0-36.4) 36.1 (35.9-36.4) 36.1 (36.0-36.6) 36.3 (35.4-36.4) 36.1 (36.0-36.4) 36.3 (36.0-36.4) 36.1 (36.0-36.6) 36.1 (35.9-36.4) EFW (percentile) 49.7 (25.7-73.3) 47.8 (26.4-79.4) 12.2 (4.2-24.8) 0.6 (0.3-2.0) 55.5 (29.3-76.2) 50.2 (26.5-73.7) 59.1 (30.8-67.5) 55.5 (28.1-78.6) Outcome GA at delivery (wks) 40.0 (39.1-40.9) 39.1 (37.4-40.4) 39.9 (39.0-40.9) 37.0 (35.6-37.3) 40.6 (39.6-41.3) 40.4 (39.4-41.0) 40.1 (38.9-40.9) 39.7 (38.5-40.9) BW (percentile) 48.7 (24.4-74.8) 42.7 (19.8-70.8) 5.9 (3.2-8.1) 3.5 (1.8-7.5) 42.1 (17.7-73.3) 39.1 (17.9-63.0) 38.0 (18.5-69.4) 54.9 (21.0-83.0)
Table 2. Biochemical and biophysical markers in pregnancies resulting in preeclampsia, birth of small for gestational age neonates and those unaffected by these adverse outcomes.
SGA = small for gestational age neonate with birth weight below the 10th percentile. PLGF = placental growth factor; sFlt-1 = soluble fms-like tyrosine kinase-1; Ut PI = uterine artery pulsatility index; UA PI = umbilical artery pulsatility index; MCA PI = middle cerebral artery pulsatility index; MAP = mean arterial pressure; EFW = estimated fetal weight. Significance value adjusted for multiple comparisons with post hoc Bonferonni correction; *p<0.025, ** p<0.01; *** p<0.0001 Unaffected (n=3,509) Preeclampsia (n=65) SGA (n=379) Biochemical markers
PlGF (MoM), median (IQR) 1.02 (0.59-1.79) 0.34 (0.24-0.48)*** 0.66 (0.37-1.15)*** PlGF < 5th percentile, n (%) 132 (3.8) 18 (27.7)*** 48 (12.7)*** sFlt -1 (MoM), median (IQR) 0.97 (0.73-1.35) 2.08 (1.45-3.24)*** 0.94 (0.71-1.37) sFlt > 95th percentile, n (%) 141 (4.0) 29 (44.6)*** 28 (7.4)**
Biophysical markers
Ut PI (MoM), median (IQR) 0.97 (0.83-1.15) 1.15 (0.89-1.40)*** 1.06 (0.86-1.29)*** Ut PI > 95th percentile, n (%) 150 (4.3) 11 (16.9)*** 37 (9.8)*** UA PI (MoM), median (IQR) 1.00 (0.90-1.13) 0.99 (0.89-1.10) 1.07 (0.97-1.18)*** UA PI > 95th percentile, n (%) 147 (4.2) 3 (4.6) 48 (12.7)*** MCA PI (MoM), median (IQR) 1.01 (0.90-1.13) 0.96 (0.87-1.11) 0.99 (0.89-1.11) MCA PI < 5th percentile, n (%) 169 (4.8) 7 (10.8) 22 (5.8) MAP (MoM), median (IQR) 1.00 (0.95-1.05) 1.09 (1.03-1.17)*** 1.02 (0.96-1.08)*** MAP > 95th percentile, n (%) 159 (4.6) 19 (31.7)*** 20 (5.4) EFW centile, median (IQR) 53.5 (30.8-75.4) 47.8 (26.3-79.4) 12.2 (4.2-24.5)*** EFW < 5th percentile, n (%) 51 (1.5) 4 (6.2)** 104 (27.4)***
Table 3. Biochemical and biophysical markers in pregnancies delivering by cesarean section for fetal distress and those delivering vaginally.
PLGF = placental growth factor; sFlt-1 = soluble fms-like tyrosine kinase-1; Ut PI = uterine artery pulsatility index; UA PI = umbilical artery pulsatility index; MCA PI = middle cerebral artery pulsatility index; MAP = mean arterial pressure; EFW = estimated fetal weight. Significance value adjusted for multiple comparisons with post hoc
Bonferonni correction; *p<0.025, ** p<0.01; *** p<0.0001
Vaginal delivery (n=3,017)
Cesarean section for fetal distress In labour
(n=275)
Before labor (n=7) Biochemical markers
PlGF (MoM), median (IQR) 0.98 (0.55-1.68) 0.90 (0.49-1.76) 0.34 (0.10-1.36)** PlGF < 5th percentile, n (%) 141 (4.7) 25 (9.1)** 4 (57.1)*** sFlt -1 (MoM), median (IQR) 0.96 (0.73-1.34) 1.08 (0.77-1.44)** 1.91 (1.44-2.87)* sFlt > 95th percentile, n (%) 135 (4.5) 17 (6.2) 4 (57.1)***
Biophysical markers
Ut PI (MoM), median (IQR) 0.98 (0.84-1.14) 1.01 (0.85-1.20) 1.65 (1.13-1.85)** Ut PI > 95th percentile, n (%) 141 (4.7) 11 (4.0) 4 (57.1)*** UA PI (MoM), median (IQR) 1.01 (0.90-1.12) 1.02 (0.91-1.12) 1.30 (1.28-1.49)*** UA PI > 95th percentile, n (%) 148 (4.9) 12 (4.4) 6 (85.7)*** MCA PI (MoM), median (IQR) 1.01 (0.90-1.12) 1.00 (0.89-1.14) 0.78 (0.77-0.95)** MCA PI < 5th percentile, n (%) 140 (4.6) 12 (4.4) 4 (57.1)*** MAP (MoM), median (IQR) 1.00 (0.95-1.06) 1.01 (0.96-1.07) 1.08 (0.98-1.18) MAP > 95th percentile, n (%) 139 (4.7) 16 (6.0) 3 (42.9)** EFW centile, median (IQR) 47.9 (24.4-70.7) 55.5 (29.3-76.2)** 0.64 (0.27-2.02)*** EFW < 5th percentile, n (%) 127 (4.2) 8 (2.9) 7 (100.0)***
Table 4. Biochemical and biophysical markers in pregnancies with and without low cord blood pH, low Apgar score at 5 minutes and admission to the neonatal unit.
PLGF = placental growth factor; sFlt-1 = soluble fms-like tyrosine kinase-1; Ut PI = uterine artery pulsatility index; UA PI = umbilical artery pulsatility index; MCA PI = middle cerebral artery pulsatility index; MAP = mean arterial pressure; EFW = estimated fetal weight. Significance value adjusted for multiple comparisons with post hoc Bonferonni correction ** p<0.01; *** p<0.0001
Biomarker
Umbilical cord pH Apgar Score Admission to NNU Unaffected (n=1,336) Low cord pH (n=52) Unaffected (n=3,586)
Low Apgar score (n=20) Unaffected (n=3,721) NNU admission (n=232) Biochemical markers
PlGF (MoM), median (IQR) 0.95 (0.53-1.68) 0.70 (0.43-1.52) 0.96 (0.55-1.67) 1.15 (0.67-2.25) 0.98 (0.55-1.68) 0.94 (0.54-1.71)
PlGF < 5th percentile, n (%) 81 (6.1) 3 (5.8) 174 (4.9) 0 (0.0) 185 (5.0) 13 (5.6)
sFlt -1 (MoM), median (IQR) 1.01 (0.74-1.42) 1.28 (0.73-1.73) 0.98 (0.74-1.37) 0.99 (0.73-1.16) 0.97 (0.73-1.36) 1.03 (0.75-1.45)
sFlt > 95th percentile, n (%) 80 (6.0) 7 (13.5) 181 (5.0) 2 (10.0) 183 (4.9) 15 (6.5)
Biophysical markers
Ut PI (MoM), median (IQR) 0.99 (0.84-1.17) 1.00 (0.86-1.22) 0.98 (0.83-1.17) 0.98 (0.80-1.20) 0.98 (0.84-1.17) 0.96 (0.83-1.16)
Ut PI > 95th percentile, n (%) 78 (5.8) 3 (5.8) 178 (5.0) 0 (0.0) 184 (4.9) 14 (6.0)
UA PI (MoM), median (IQR) 1.00 (0.90-1.12) 1.06 (0.94-1.13) 1.01 (0.90-1.12) 1.04 (0.94-1.12) 1.01 (0.90-1.12) 1.02 (0.90-1.12)
UA PI > 95th percentile, n (%) 64 (4.8) 3 (5.8) 181 (5.0) 0 (0.0) 190 (5.1) 8 (3.4)
MCA PI (MoM), median (IQR) 1.00 (0.90-1.12) 0.96 (0.86-1.07) 1.01 (0.90-1.13) 0.98 (0.86-1.08) 1.01 (0.90-1.12) 1.02 (0.92-1.13)
MCA PI < 5th percentile, n (%) 60 (4.5) 4 (7.7) 176 (4.9) 2 (10.0) 190 (5.1) 8 (3.4)
MAP (MoM), median (IQR) 1.01 (0.96-1.07) 1.02 (0.99-1.07) 1.01 (0.95-1.06) 1.03 (0.99-1.06) 1.00 (0.95-1.06) 1.02 (0.96-1.08)
MAP > 95th percentile, n (%) 74 (5.6) 4 (7.7) 174 (5.0) 2 (10.0) 186 (5.1) 12 (5.4)
EFW centile, median (IQR) 54.2 (30.1-76.2) 50.2 (26.4-73.7) 49.7 (25.6-73.2) 59.1 (30.8-67.5) 49.5 (25.6-73.1) 55.5 (28.1-78.6)