AALTO UNIVERSITY
SCHOOL OF ELECTRICAL ENGINEERING
Department of electrical engineering and automation, Lighting unit
LIGHTING RETROFITTING:
IMPROVING ENERGY EFFICIENCY AND LIGHTING QUALITY
RELATORE:
Pietro Fiorentin. Dipartimento di Ingegneria industriale
SUPERVISOR:
Professor D.SC. (Tech.) Liisa Halonen, Head of the
Lighting Unit, Aalto University
INSTRUCTOR:
D.SC. (Tech.) Eino Tetri, Leader of the Light Sources and
Energy Group, Lighting Unit, Aalto University
LAUREANDO:
Marta Gavioli
ANNO ACCADEMICO:
2014/2015
Tesi per il diploma di Laurea Magistrale
Padova 16.04.2015
In order to minimize energy consumption for lighting and increasing lighting quality in existing offices old lighting systems can be retrofitted with more efficient luminaires. Additional savings can be achieved by installing a lighting control system. Installation time and costs can be reduced by installing LED luminaires equipped with inbuilt lighting controls. In the case study six rooms were analyzed: in two rooms the old lighting system has been retrofitted with LED luminaires with inbuilt active dimming controls; in two rooms LED luminaires without dimming were installed and two rooms were left as reference. Old and new lighting systems performances were measured in terms of energy efficiency, lighting quality and user satisfaction. The conducted analysis can be used as a monitoring guideline for the evaluation of lighting retrofitting results.
Keywords: efficient lights, lighting quality, user satisfaction, retrofit, Dialux, LENI
This thesis is a part of the larger multi-disciplinary research project: RYM Indoor Environment Program. The Program realizes the strategic research agenda through far-reaching, collaborative and multidisciplinary research work done jointly by companies, universities and research institutes ( http://rym.fi/program/indoor-environment/). I would like to thank Alppilux Oy and Helvar Oy for providing the luminaires and their control systems used in the case study.
When I arrived at Aalto University six month ago autumn was at its start and the darkness of Finnish winter arrived soon after. However what I will remember about this experience is the warmth and illuminating atmosphere of Aalto Lighting Unit. Now that spring is here it´s time to go out again, it´s time for goodbyes.
First I would like to thank all the Lighting laboratory staff for the good time and support I had.
Special thanks shall be addressed to Prof. Liisa Halonen and my supervisor Eino Tetri for this opportunity, for the advice, for the trust and the patience.
Warm thanks to D.Sc student Rupak Raj Baniya for helping me with measurements, questionnaires and many other things; to D.Sc Leena Tähkämö for her insight in LCC; to D.Sc Pramod Bhusal for the helping me, especially with wood work and the goniophotometer. Sincere thanks to D.Sc student Mikko Maksimainen for related and non-related conversations especially about Photoshop and Finnish culture and hat tip to M.Sc Lauri Kytömaa for the first day advice that I didn´t follow and now I regret.
Warmest thanks to my “Finnish family” Pancho Solano Eizaguirre, Dimitris Tzarouchis, Uri Sementé Tarragó, Carlos Solano Eizaguirre and Valentina Pettenella for the empathy and emotional support, for the presentation rehearsals, for the proof reading, for the food and all the rest.
Last but not least thanks to my parents, sisters, housemates and friends, near and far, for their support during this Erasmus, for the adventures, for the bad and good time we had.
Otaniemi, 16 March 2015 Marta Gavioli
Abstract ... iii
Acknowledgements ... v
List of Abbreviations and Symbols ... xi
1 . Introduction ... 1
1.1 Background... 1
1.2 Objectives ... 2
1.3 Outline of the thesis... 3
2 . Lighting energy consumption... 5
2.1 Electricity demand... 5
2.2 Electricity consumption in lighting ... 5
2.3 Lighting demand evolution ... 6
2.4 The building sector ... 7
2.5 Reducing energy consumption in lighting... 10
3 . Lighting quality in offices ...13
3.1 Lighting and work...13
3.2 Visual tasks, visual performances and visual discomfort ... 14
3.2.1 Uniformity of the work surface... 16
3.2.2 Glare ... 17
3.2.3 Correlated colour temperature... 18
3.2.4 Colour Rendering ...21
3.2.5 Veiling reflection ... 23
3.2.6 Shadows ... 23
3.3 Eye strain ... 24
3.4 European standard EN 12464-1 ... 25
3.5 Lighting Quality and Visual Comfort ... 26
3.6 New offices and new visual tasks ... 28
4 . Lighting retrofits ... 31
4.1 Key phases in a lighting retrofit programme ... 31
4.2 Available lighting retrofit strategies and savings potentials ... 33
4.2.1 Efficient light sources... 33
4.2.2 Lighting controls ... 37
4.2.3 Task lighting ... 40
4.3 Conclusions ... 42
5 . Case study ... 43
5.1 Aim of the study ... 43
5.2 Retrofitting project ... 43
5.3 Monitoring the retrofit: Methods and needed data ... 47
5.3.1 Energy efficiency and consumption ... 47
5.3.2 Light environment ... 52
5.3.3 Cost analysis ... 54
5.3.4 User satisfaction ... 56
5.4 Collecting data: Methods and instruments ... 56
5.4.1 Room measurements ... 56 5.4.2 Laboratory measurements ...57 5.4.3 Simulations...57 5.4.4 User surveys ... 58 6 . Results ... 61 6.1 Energy efficiency ... 61 6.1.1 Usage pattern ... 61 6.1.2 Luminaires performance ... 63
6.1.3 Annual energy consumption per room and energy savings ... 63
6.1.4 Metered weekly energy consumption ... 65
6.2.1 Illuminance ... 68
6.2.2 Glare and luminance levels ... 70
6.2.3 CCT and Colour Rendering ... 70
6.2.4 Presence of veiling reflections, shadows and flickers. ... 71
6.3 Cost analysis and economical savings ... 72
6.4 User satisfaction ... 74
6.4.1 Occupants ... 74
6.4.2 Surveys ... 74
6.5 Conclusions... 76
7 . Concluding remarks and future aspects ... 79
References ... 81
Appendix 1: General Questionnaire ... 85
Symbols
Φ Luminous flux [lm]
η Luminous efficacy [lm/W]
rr Real Discounting Rate [%]
rn Nominal Discounting Rate [%]
i Inflation Rate [%]
η Luminous efficacy [lm/W]
L Luminance in the direction of the eye [cd/m2]
Lδ Background luminance [cd/m2] C Luminance contrast [-]
Ω Cut-off angle of a luminaire relative to the eye of an observer [sr] P Guth factor [-]
Abbreviations
AS Annual Savings
CCT Correlated Colour Temperature
CEN European Committee of Standardization CIE International Commission on Illuminations CRI Colour Rendering Index
EU27 European Union considering the state members before 2013
FL Fluorescent Lamp
FSI Full-spectrum index LED Light-emitting Diode LCC Life Cycle Cost
OC Operating Cost
PC Investment Cost
RVP Relative Visual Performance SPD Spectral Power Distribution UGR Unified Glare Rating
The White Rabbit put on his spectacles. `Where shall I begin, please your Majesty?' he asked.
`Begin at the beginning,' the King said gravely, `and go on till you come to the end: then stop.'
(Lewis Carroll, Alice in Wonderland, 1865)
1.1 Background
Retrofit is the act of furnishing a systems with new or modified parts or equipment not available or considered necessary at the time of manufacture (1). From the building point of view, retrofitting refers to “work necessary to upgrade an aged or deteriorated building to meet new requirement” (2). Nowadays the aim of building retrofitting is mainly to meet efficiency standards and realize significant energy savings. Indeed the building sector is responsible of 40% of energy consumption and 36% of CO2 emissions in the EU. Since the energy savings and emissions reduction achievable by improving the energy efficiency of buildings are massive, the European Union issued many legislations that aim directly to reduce the energy consumption of the building sector. Moreover about 35% of the EU's building stock is more than 50 years old while the amount of new useful floor space is increasing only around 1% per year. Clearly most of the energy savings potential lies in retrofitting and purchasing new technologies for the existing building stock. As electric lighting is one of the major consumers of electricity in buildings, retrofitting the lighting systems is one of the first options to reach European efficiency goals. Moreover lighting systems are easy to access if compared to others, for example the heating system, and life of the lighting system is much shorter than life of the building, so the retrofitting potential is important: about 75 % of European lighting installations are estimated to be older than 25 years and thus to be updated. Finally there are already more efficient technologies on the market that are not yet so commonly implemented. Efforts to reduce energy consumption in the lighting sector
have been on one hand imposed through regulation, standards and directives and, on the other hand, realized by appropriate lighting design strategies.
However energy savings are not the only requirement for a new lighting system, any attempt to develop an energy efficient lighting strategy should have as first priority to guarantee that the quality of the luminous environment is as high as possible.(3) In the case of lighting in workplaces improving lighting quality is particularly convenient since it can improve productivity. Lighting can impact work performance mainly in three ways: affecting the visual system, affecting the circadian system and affecting mood and motivation (4). The ways in which lighting influence visual performance and the ways to avoid visual discomfort have been subjects of lighting researches for years and they are now well understood even if not always applied. On the contrary impacts of lighting on the health, wealth and safety of people still need to be studied more, as well as the ways lighting operates on mood, on motivation and behaviour. (5)
Lighting retrofits can provide a flexible, maintainable long-term system in any type of building if properly planned. A general planning procedure can be followed to realize a successful lighting retrofitting in terms of better light quality, improving working conditions, achieving energy savings and benefitting occupants as a whole. If retrofitting approaches have a general validity, the technologies that provide the foundation for these strategies improve every year and change over time. Nowadays there is a wide range of lighting retrofitting technologies on market that offer improvements in lamp, ballast, luminaire technology (T5 or LEDs) and lighting control. There are many means to control lighting systems, for instance manual dimming, daylight harvesting and switch-off based on occupancy sensors. The implementation of new and more efficient light sources, task-ambient lighting and the use of lighting controls lead to significant energy savings, as widely described and quantified in literature (6). If accurately designed, the energy savings due to the control system can be even higher than the savings achieved by using efficient light sources. However in retrofitting an old lighting system the installations time and costs increase if additional wiring is needed for the control. To achieve maximum saving all the factors that influence the investment cost should be taken into account and those depends on the particular case Therefore lighting retrofit projects should be accurately designed in order to achieve the maximum savings.
1.2 Objectives
The main objectives of this case study were to monitor the retrofitting project and to quantify the energy savings achieved thanks to the installation of the new lighting source technology equipped with inbuilt control systems. Six rooms have been studied: in two of them new LED luminaires with active dimming were installed. In similar two rooms new LED luminaires without dimming were installed. Two other rooms were left as reference rooms. Two different analyses have been carried out. The first analysis deals with the comparison between pre and post retrofit conditions
in each room. The second analysis compares the two different post retrofit conditions: new luminaires with or without inbuilt active dimming controls. The effects of the lighting retrofit are analysed in terms of energy consumption, lighting quality, user satisfaction and economical savings. The analysis are based on photometric and electrical measurements, software simulations and users surveys.
1.3 Outline of the thesis
This thesis can be divided into two parts: the first three chapter deals with the background of lighting retrofitting and the second part describe the case study.
Chapter 2 presents data about energy consumption in lighting, lighting demand evolution, offices lighting retrofitting potentials in Europe and European regulation on energy efficiency in lighting.
Chapter 3 analyses the influences of lighting on work performance and define aspects of lighting quality in offices.
Chapter 4 introduces lighting retrofitting practice and common lighting retrofitting technologies nowadays on the market
After the theory part, the case study is introduced: Chapter 5 describes the retrofitting project as well as the methods used to collect data and methods used to perform the analysis.
In Chapter 6 analyses results are presented.
Finally, the thesis concludes verifying how well the aim of the work has been reached and suggests further monitoring possibilities.
Customers don’t want kilowatt-hours; they want services such as hot showers, cold beer, lit rooms, and spinning shafts, which can come more cheaply from using less electricity more efficiently. (LOVINS, the Negawatt Revolution, 1990)
2.1 Electricity demand
Artificial lighting nowadays is mostly powered by electricity. Because of the versatile nature of its production as well as its consumption, electricity is becoming more and more the favourite form of energy, hence the electricity demand is increasing at a faster rate than the global energy demand. In the last decades the global consumption growth rate of electricity has been 3% while the overall primary energy demand growth rate has been 1.9% (3). In 2008 total world energy supply was 143 851 TWh, while end use was 98 022 TWh. Electricity accounted for the 17.3% of the end use energy demand (17250 TWh) (7). Moreover the electricity sector is the largest source of greenhouse gas emissions, accounting for 11.4 gigatonnes of equivalent CO2, about 31% of global emissions (36.7 Gt). There is a considerable technical potential for energy efficiency improvements along the entire energy value chain: from extraction of primary energy resources to their transformation into electricity, transportation and distribution of energy, and ultimately to the final use by equipment and devices.
2.2 Electricity consumption in lighting
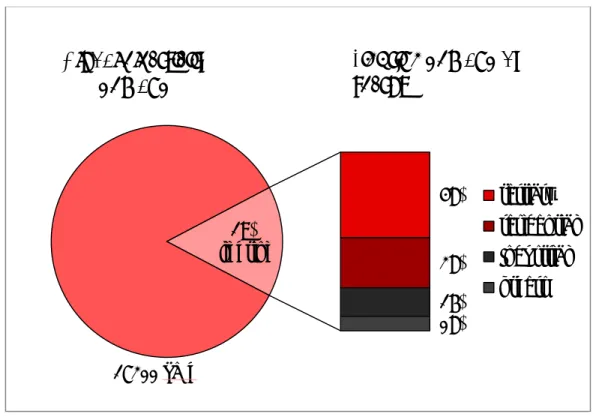
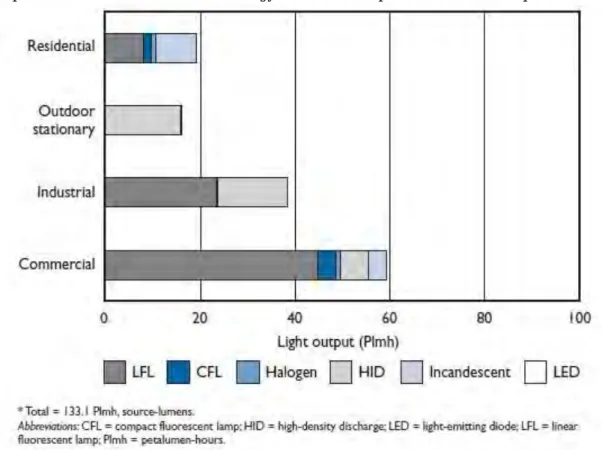
One of the biggest electricity end use is lighting, globally it is estimated to consume about 2 650 TWh of energy annually, which is almost 19% of global electricity consumption (8). In the industrialized countries, national electricity consumption for lighting ranges from 5% to 15% of the total electricity usage. On the other hand, in developing countries the value can be even higher than 80%. Most of the lighting electricity is used in the tertiary sector, as shown in Figure 1 . Being a great electricity consumer means also being responsible of a great amount of greenhouse gas emissions, the lighting sector is responsible for almost 1 900 mega tonnes per year.
Figure 1 – Lighting electricity consumption by sector: indoor illumination of tertiary-sector buildings uses the largest proportion of electricity (derived from (8)
data and analysis).
2.3 Lighting demand evolution
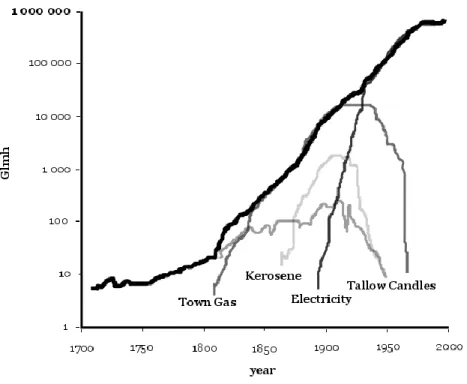
Until the latter part of the nineteenth century artificial light was an expensive
utility: its average price was 13000 € per Mlmh and light mainly came from tallow
candles.(9) Artificial light has started to be used in great quantity only when the modern lamps appeared. Currently artificial light usages surpass the most exaggerated dreams of two hundred years ago, more than 33 billion lamps operate worldwide (8) and lighting engineering and technologies have been developed till the point that light can be directed, diffused and altered in colour as desired. Figure shows how in the span of 200 years total lighting consumption increased from less than 20 giga lumen-hours in 1800 to 10,000 Glmh in 1900 to nearly 800,000 Glmh in 2000 (9).
17200 TWh
48%
28%
16%
08%
19%
lighting
Global electricity
demand
tertiary
residential
Industrial
others
Lighting demand by
sector
Figure 2 - Global Consumption of Lighting by Source (9)
Per capita consumption has increased by a factor of 8400, from a 5 kilolumen-hours at the beginning of the 19th century to 42 megalumen-kilolumen-hours today (8). Over the last decade, global demand for artificial light grew at an average rate of 2.4% per annum. With an average cost of almost 2.50€ per Mlmh, electric lighting is clearly
no more a luxury. From these analyses it is clear that the major influence on the consumption of artificial light is its affordability – the cheaper it becomes and the wealthier we are, the more we use it. But lighting demand is very elastic: per capita consumption in the last two centuries grew much more than variations in per capita income and lighting price (9). With current economic and energy-efficiency trends, it is projected that global demand for artificial lighting will be 80% higher by 2030.(8)
2.4 The building sector
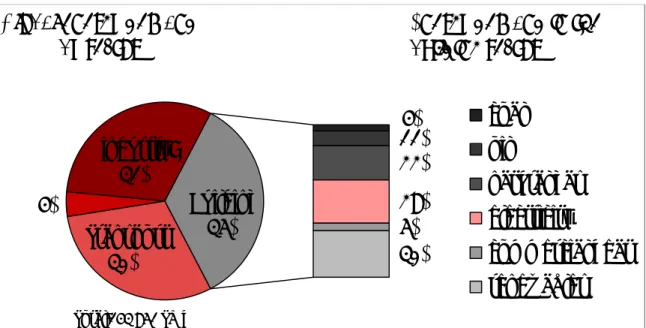
The construction of buildings and their operation account for 2973 Mtoe, that is more than one third of primary global energy demand and is the biggest energy consumer among the three energy-using sectors: transportation, industry and buildings (Figure 3). With current policies, due to the increasing of population, economic growth, higher living standards and greater use of electric appliances, energy consumption in building is supposed to grow 1% every year, reaching 3870 Mtoe by 2040 (10).
Figure 3 - Final energy consumption by sector and buildings energy mix, IEA 2010
In the territories of EU27, Switzerland and Norway, it is estimated that there are 25*109 m2 of useful floor space.(11) Office buildings comprise the second biggest
portion of the non-residential stock category with a floor space corresponding to one quarter of the total non-residential floor space. In non-residential building sector most of the energy is consumed for the operation of existing structures since the construction of new building is rare: the useful floor is increasing at a rate that is only around 1% per year. At the same time most buildings have long life spans, meaning that more than half of the current global building stock will still be standing in 2050. In the OECD countries, this will be closer to three-quarters. Buildings are much more frequently refurbished than replaced. Due to the low retirement rate of buildings combined with relatively modest growth, most of the energy and CO2 savings potential lies in retrofitting and purchasing new technologies for the existing building stock.
Transport
30%
4%
industry;
31%
4%
11%
22%
28%
5%
30%
Building
35%
Global energy demand
by sector
coal
oil
natural gas
electricity
commercial heat
renewables
Energy demand in the
building sector
Figure 4 – EU27, Swiss and Norwegian buildings stock
Lighting is responsible of 18% (1750 TWh) of the total electricity consumption in the whole building sector (10) while in office buildings lighting is globally the leading energy consumer accounting from 30% to 40% of the total energy consumption (11). Moreover lighting demand growth in the building sector is far from being saturated and with current policies electricity consumption for lighting in 2040 is supposed to be 3025 TWh. On the other hand lighting is believed to be one application where electricity demand growth might be considerably reduced. This is because lighting installations have relatively short lives compared to building, are easy to access and there are already existing energy efficient technologies that are not widely used (4). For example in the commercial sector the replacement of old linear fluorescent lamps by more efficient type of light sources with active control can cut energy consumption by 25%. (10)
Figure 5 – Growth of electricity demand for lighting in building: savings
2.5 Reducing energy consumption in lighting
Attempts have been made to reduce lighting electricity consumption through regulations and design strategies.
Regulations
For many years the aim of the lighting regulations was to assure the users’ health
and safety, in other words regulations used to state the minimum light level needed to accomplish a certain task in the safest way possible, minimizing accidents and avoiding damage to the visual system of the user. Nevertheless in the last decades also limiting the growth of energy demand has become a key element in the lighting policies. To achieve this point two approaches are mainly used: limit the power lighting density and ban the energy-inefficient technologies (4).
An example of banning inefficient equipment can be found in EcoDesign European directive and its implementations (12). With this directive the EU defined a series of measures for the economical and sustainable use of resources. After prohibiting less efficient conventional ballasts for fluorescent lamp in 2000(13), reducing hazardous materials content (14) and regulating the disposal of discarded electronic devices in 2003 (15), the EU issued the EcoDesign framework directive (16), to define requirements for acceptable environmental design (eco-design) of energy-using products. In November 2009, this directive was replaced with an updated framework directive (12), relating to the eco-design of many energy-related products and containing measures also for tertiary sector lighting products. This directive reflects European climate targets set at the beginning of 2007 that extend to 2020. The core objective of these ambitious goals is to reduce CO2 emissions in the EU by 20% by 2020.
In the non-residential lighting sector, reductions of just over 20 million metric tons of CO2 are being targeted and another 24 million metric tons in residential lighting. The impact on light sources is the focus of this measure, realized by setting quality criteria (functionality requirements) for directional lamps, light emitting diodes lamps and related equipment (e.g. halogen lamp control gear, LED lamp control gear, control devices and luminaires). When the first stage entered into force on 1st September 2009 the changes were difficult to see for non-experts, because the main effect was the transition from less efficient towards more efficient types within the same technology. The only technology change has been in stage two (1st September 2014) when all the incandescent types have been phased-out. As of stage three in 2016, energy efficiency index EEI of LED directional lamps and modules will need to be less than 0,20; meaning that LED lamp have to meet energy efficiency class A.
From stage one 2013 onwards functional requirements valid for both LED directional and non-directional lamps have been set. These requirements typically relate to lamp survival rate and lumens maintenance, switching cycles, starting and warm up times, premature failure rates, colour rendering and consistency, power factor. Requirements prescribe also when a LED lamp can be labelled as suitable to
be retrofit to existing lamp types. Regarding control gears the regulation does not state any efficiency requirements but there are compatibility requirements with A class or better lamps.
An example for regulation that addresses directly the purpose behind of the policy (the reduction of electricity consumption) is the EN 15193 (17). This European standard aims to establish conventions and procedures to estimate the lighting energy needed in buildings. It presents two methods: the calculated method and the metered method. After giving a methodology to compute the energy required by the lighting system, this standard defines a numeric indicator of energy performance of buildings. LENI (lighting energy numeric indicator) quantifies the amount of energy that is used by a lighting system per square meter per year. The standard gives also benchmark LENI values limiting the energy used by the lighting system. En 15193 procedure to compute energy consumption has been used in the analysis of the case study so a complete description and example of application of this standard can be found in Chapter 5.3.1
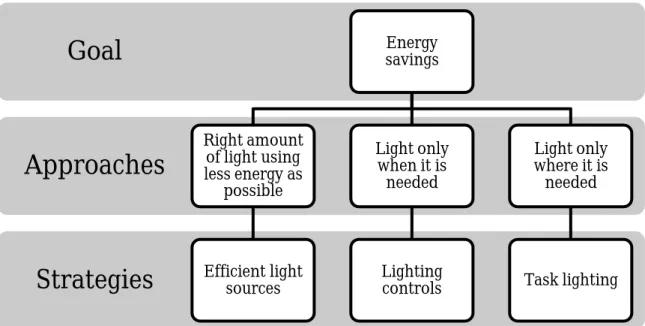
Design
To actually limit the energy consumption it is necessary to choose the right design approach and the right technology. Currently there are three main trends in the design approach (4). The first one is not to maintain the recommended light level everywhere but only on the task area, illuminating less the surrounding zone. In this way the energy consumption of the installation would be lower than when a uniform lighting is used. The second is to take advantage of daylight that, in addition to reduce energy consumption, is believed to be good for avoiding circadian disruption. The provided amount of daylight is controlled to avoid visual discomfort and overheating, the artificial light is provided with sensor so that it can dim or switch off when daylight is enough. The third trend is the usage of control systems to avoid the use of lighting where nobody is present. The different design approaches are described in details in Chapter 4.2.
[Lighting quality is…]Like pornography, we know it when we see it but what it is differs from one individual and culture to another.
(R.Boyce: Human Factors in Lighting. 2014)
3.1 Lighting and work
As our world become increasingly service-oriented, more and more people work in offices or workstation environments. In most work environments, productivity and efficiency are high-priority goals but there is also a trend in increasing employee satisfaction in most workplaces.(18) Inevitably, lighting design solutions are expected to support all these requirements, especially because lighting in one of the main factors that can influence human performance. In particular lighting can influence job performance in three ways (4):
Affecting the visual system: Obviously without a proper lighting there isn’t
any performance since the user is not able to see. Lighting makes the job task
visible. Visibility is defined by the user’s ability to detect objects or signs of given dimensions, at given distances and with given contrasts with the background (3). Visibility is influenced by: visual size, colour, luminance and position of the observed object; luminance contrasts; colour difference; objects movements; position and quality of the image on the retina; retinal illuminance (4).
Affecting the circadian system: the circadian timing system in humans rules the sleep-wake cycle and many different hormonal production rhythms. The organ that controls these cycles is the suprachiasmatic nucleus that is directly connected to the retina, so the amount of light and its spectrum reaching the retina influence the SCN functions. These physical mechanisms are proven to impact awakens and alertness. (4)
Affecting mood and motivation: how much work is done and of what quality depends on many factors but mostly on the employee mood and motivation. Even motivation is influence by many factors (reward, risk, need, etc.) including the work environment. Lighting is part of the visual environment and it is through the perception of the visual environment that the visual system creates a model of the external world. The interpretation of the external world is
not confined to the simple perception of what is seen but it deals also with the reading, conscious or not, of other messages. This interpretation always gives an emotional response: motivation, satisfaction, pleasantness and so on. From this point of view, lighting can influence the mood both if it is cause of discomfort or not, but the user emotional reaction is mostly subjective and difficult to predict since depends on many factors, for instance culture, situation, social contest.(4)
3.2 Visual tasks, visual performances and visual discomfort
The main impacts of the lighting on the human performance are the one affecting the visual system and they are also the one that have been studied the most. Lighting research for interiors has been focused especially on the topics of visibility and visual comfort. Research result has been the development of a validated model that allows the prediction of the effect of lighting and task conditions on visual performance, and an understanding of the conditions that cause visual discomfort (5). These models are based on the concepts of visual task, visual performance and visual comfort.
Office work requires fulfilling a number of different tasks, for example reading and reviewing paper work, writing, working with video terminals, filing, copying, etc. Task performance is the performance of the whole task. On the other hand visual task is the visual component of the whole task; it is what is requested to the visual system to fulfil that certain activity. In other words visual task is the perception and how quick the visual system perceives the objects with which the user has to work and the immediate surroundings (19).
Visual performance is the performance of the visual task. It is defined by the speed and the accuracy with whom the visual task is fulfilled. Visual performance is then the attitude of the user in reacting when the details of the visual task enter the visual field. Visual performance depends primarily on the visual acuity of the user (accommodation, regulation of the incident light, convergence of the visual axes, ocular motility, colour sense, presence of visual defects, adaptation); on the features of the visual task (visual size, illuminance, texture) and of the visual environment (luminance contrast) (4).
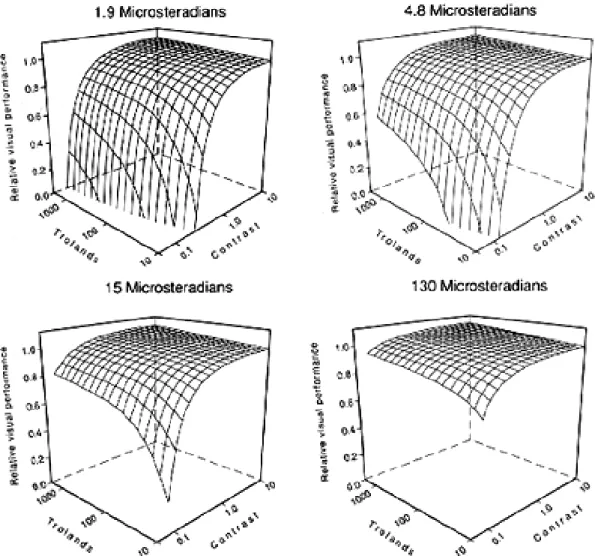
Many methods have been developed to predict the effect of lighting on visual performance. A simple but rigorous approach is the Relative Visual Performance (RVP) Model developed by Rea et al. and the end of the eighties (4). This model shows how the time in completing a visual performance varies in respect to the visual size of the task, adaptation luminance and luminance contrast, defined as:
(3.1)
Where:
C= luminance contrast
Lδ= luminance of the background (cd/m2) Ld= luminance of the detail (cd/m2)
The difference between RVP model and many other proposed is that in this case the characteristic of the task are described by quantities that are directly measurable. The visual task used as reference was one that could be directly used as a measure of the speed of the performance. Simply it was the reaction time to the onset of a square stimulus. Measurements were taken for a wide range of luminance contrasts, adaptation luminance and visual size (solid angle subtended by the stimulus on the eye). To have a relative measurement of the reaction speed, reaction times are normalized in respect to the shortest time occurred. Then the inverse of the reaction time was plotted against luminance contrasts, adaptation luminance for different dimensions of the visual size as shown in Figure 6. The adaptation luminance can be expressed as conventional retinal illuminance (1 troland =10000 candelas per square meter). The shape of this model has been described as the plateau and escarpment of visual performance.
Figure 6 – Relative Visual Performance (RVP) plotted as a function of luminance
contrast and adaptation luminance for different target sizes measured in solid angle (4)
From this graph it is evident that luminance contrast is the major determinant in the fulfilment of the task. For a wide range of luminance contrast there is very little difference in reaction speeds but when contrast fall under 0.4 the performance decrease really fast and in one non-linear manner. In addition, for the same contrast value the reaction speed is higher with higher luminance levels and performance tends to saturate at lower luminance contrast. So, in general, visual performance is improved with increasing luminance level. Yet, there is a plateau above which further increases in luminance do not lead to improvements in visual performance. Thus increasing luminance levels above the optimum for visual performance may not be justified and can on the contrary lead to excessive use of energy. RPV model represent the most complete and accurate method to predict the effect of task and lighting variables on the visual performance. Since all the variables to take into account can be directly measured this method is simple to use and its predictions have been independently validated (5).
Lighting in offices is mostly intended to permit the extraction of information from the visual environment.(4) If lighting doesn’t allow this process visual discomfort
occurs. This happens if it is difficult to reach a high level of visual performance, if the visual environment presents too little or too much information, if lighting creates distraction from the task, drawing attention to other objects. The concept of comfort is not directly measurable since if a situation is comfortable or not is a subjective
matter closely linked to users’ past experiences, expectations and sensibility.
Nevertheless conditions that generally cause discomfort feel can be identify. In particular, aspects that can cause visual discomfort are insufficient light to perform the task (visual performance depends also on luminance contrasts and adaptation luminance, if these are not sufficient users will have difficulties to perform the visual task), uniformity, glare, veil reflections, shadows, flickers. Whether or not these aspects create visual discomfort depends very much on the contest as the same visual conditions may be considered uncomfortable in one situation but attractive in another, for examples flickers in an office or in a disco. The conditions that cause discomfort are well known so these phenomena can be produced or eliminated as desired by the designer.
3.2.1Uniformity of the work surface
Uniformity is generally described as the ratio between highest- and lowest-illuminance values in the given room or space. Uniformity is described in terms of illuminance even if visual perception depends on the luminance of surfaces because general practice is to use surface with similar reflectance within the task area. Acceptable reflectance values are also provided in many lighting standards. For example, the European standard EN-12464-1 (20) proposes the following reflectance factors for the main room surfaces:
Ceiling: 60-90%
Floor: 10-50%
Work surface: 20-60%
A complete uniform visual field is undesirable since it is perceived as not interesting and not stimulating, but also too much not-uniformity is undesirable since it creates distraction (3). Studies about people reactions to various lighting patterns shown that the preferred lighting form is having a uniform illuminance over an area of about 1m^2 where the task has to be accomplished and less illuminance in the surrounding area if the task deals with 2-D work. If the objects to work with present 3D surfaces (industry works, prototypes) then less uniformity is needed in order to perceive shape and texture of the object. (4) In workspaces with video screens the luminance of the display should be also taken into account when planning the lighting in order to provide such level of illumination that does not create abrupt changes in luminance between screen and the rest of the room.
3.2.2Glare
Glare is the sensation produced by luminance within the visual field that is sufficiently greater than the luminance to which the eyes are adapted to cause annoyance, discomfort or loss in visual performance and visibility. (21) If the high luminance comes from the direct presence of a light source within the visual field the glare is said direct. Direct glare, minimization or avoidance is possible by mounting luminaires well above the line of vision or field of vision or by limit both brightness and light flux in the common field of view. On the other hand, reflected glare is due to bright reflections from polished or glossy surfaces. It can be avoided by appropriate choice of interiors. Distinctions between different types of glare can be also made taking into account the reaction that glare induces in people. From this point of view up to 8 types of glare have been identified (4) but the most common in indoor workspaces are two: disability glare (physiological glare) and discomfort glare (psychological glare). Disability glare is the effect of stray light in the eye that causes reduction in visibility and visual performance. When disability glare is present, occupants usually notice an immediate reduction in their ability to see or to perform a visual task. They might react by shifting their position or using shading devices, such as closing blinds or curtains. Discomfort glare is glare that produces discomfort. It does not necessarily interfere with visual performance or visibility. However, they might experience certain physiological symptoms such as headaches. Disability glare and the physical mechanism that produces it are well understood, it has an effect of visual capabilities that can be easily measured with psychophysical procedures. Disability glare is then easy to detect and to avoid. On the other hand there is not yet a complete physical explanation of discomfort glare, it is said to occur when people complain about visual discomfort due to the presence of bright sources.(4) there are many methods to measure the probability of psychological glare, in Europe it is used the so-called UGR (Unified Glare Rating) method defined by International Commission on Illuminations (CIE). UGR calculations involve the
luminance and size of the glare source, the luminance of the background and the position of the glare source relative to the line of sight. UGR is defined as:
(3.2)
Where:
L=luminance of lighting parts of every luminaire in the direction of the eye (in candelas per square meter).
Ω=cut-off angle of a luminaire relative to the eye of an observer (in sr)
P=Guth factor of spatial position of every single luminaire relative to the field of view
Lδ=background illuminance (in candelas per square meter).
The higher is the luminance of the glare source and the larger its size, the greater will be the level of discomfort glare. Conversely, the higher the luminance of the background and the further the glare source is from the line of sight, the lower will be the level of discomfort glare.
UGR is the result of many years of study by the CIE and represents the state of the art in glare prediction methods. However, there is doubt about how well it deals with LED luminaires, which contain multiple small points of high luminous intensity; with daylight, since glare from daylight appears to be tolerated more than predicted if there is a pleasant view from the window and for integrated systems that combine day lighting and electric lighting (22).
The EN 12464 specifies the UGR limits for activities and visual. To prevent glare and respect the standard limits best practice suggest to use large luminaires with low luminance, luminaires with butterfly-shaped curve of luminous density (maximum luminosity in the angled parts of the curve) and surface finishes that diffuse and scatter light instead of glossy ones that create strong reflections. Moreover light sources should be covered or partially obstructed so that it is not directly visible in a 65-degree angle and windows should be covered by protective shutters. Attention has to be paid to match luminaires to workstation and avoid reflections. Glare from windows usually arises when direct sunlight enters the room creating both direct and reflected glare. Alternatively sunlight reflections off exterior surfaces, for example the glazed facade of neighbouring building or by the direct view of the sky, may result in high window luminance causing glare. Work areas using screen with high-gloss finish might need an individual approach: separate window shutters or even a specific setting of a lighting system. (23).
3.2.3Correlated colour temperature
In CIE International Lighting Vocabulary the correlated colour temperature (CCT) is
defined as: “the temperature of the Planckian radiator whose perceived colour most
closely resembles that of a given stimulus at the same brightness and under specified
viewing conditions”. In fact the spectral power distribution (SPD) of an ideal
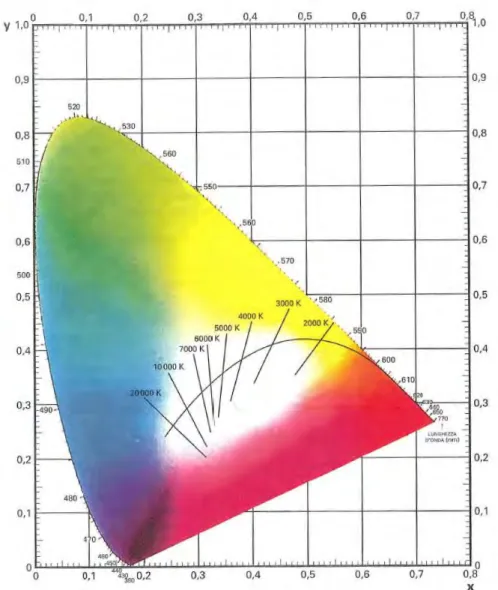
the bluer is the emitted light. Planckian radiator SPD can be completely determined from its colour temperature in Kelvin (K). Chromaticity of the radiation of Planckian radiators goes from orange/red to white and finally to blue. The locus of points in a chromaticity diagram that represents chromaticity of the radiation of Planckian radiators at different temperatures is called blackbody locus (Figure 7). Correlated colour temperature is a measure of light source colour appearance defined by the proximity of the light source's chromaticity coordinates to the blackbody locus, as a single number rather than the two required to specify a chromaticity. The recommended method of calculating the correlated colour temperature of a stimulus is to determine on a chromaticity diagram the temperature corresponding to the point on the Planckian locus that is intersected by the agreed isotemperature line containing the point representing the stimulus.
Figure 7 – CIE 1931 (x, y) chromaticity diagram. The Planckian locus and
Since it is a single number, CCT is simpler to communicate and it is widely used in the lighting industry to report the colour appearance of "white" light emitted from electric light sources. CCT values of most commercially available light sources usually range from 2700 K to 6500 K. Lamps with low CCT values (2700 K to 3000 K) provide light that appears "warm," while lamps having high CCT values (4000 K to 6500 K) provide light that appears "cool." Practical light sources of different SPD but identical chromaticity will also have identical CCTs but not always the opposite is true. The weakness of CCT is that two light sources with the same CCT can have very different chromaticity and will look very different to the eye. The light emitted by source whose colour coordinates are upon the blackbody locus have a greenish-white appearance, while the light emitted by sources placed under the blackbody locus have a purple-white appearance.
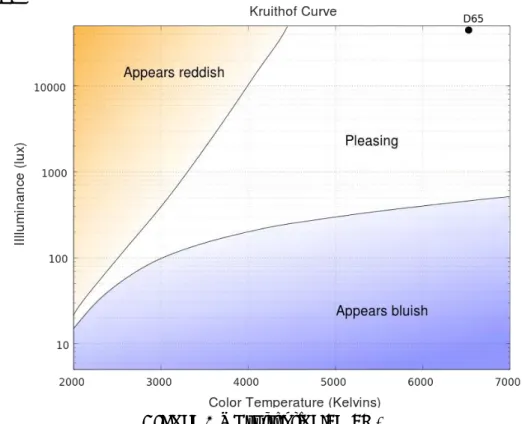
In 1941, Kruithof conducted a study on the colour of lamps for general illumination, the aims of Kruithof’s experiment was to set whether the illumination appeared ‘pleasing’. Results are displayed in a two dimension diagram where
correlated colour temperature (CCT) is reported along the abscissa and illuminance E is reported along the ordinate axis (Figure 8). Two curves are drawn on the diagram. They show the limits between which an illumination is considered
‘pleasing’.
Figure 8 – Kruithof’s diagram.
The article gives little information on how the diagram was derived. Kruithof himself declared that it was a pilot study based entirely on the observations made by himself and his assistant. Kruithof introduced a variable number of lamps in a room, so that the observer could not guess which type of illumination was on. All lights could be graded in intensity while controlling the correlated colour temperature
(CCT). Beneath 2850 K, he would use incandescent lamps with variable current to produce light sources. For higher CCT, the experiment was conducted with daylight originating from a window or daylight luminescence lamps. For some part of the diagram Kruithof relied on common sense (24). There is little information available about the size and the geometry of the room, on the tasks proposed to the observers, as well as on the number of participants. Moreover at that time fluorescent lamps just appeared and halogens haven’t existed yet and Colour Rendering Index has not yet been defined. Nowadays “Kruithof effect” is still on although it is not
unanimously accepted and several attempts reassess its scientific accuracy through more rigorous methods have been carried on. Nowadays fluorescent lighting has matured, new lighting technologies have been developed, and individual experience has considerably changed in terms of quality of available sources and management of illumination. While these newer sources can still achieve correlated colour temperatures and illuminance levels that are within the comfortable region of the Kruithof curve, variability in their colour rendering indices may cause these sources to ultimately be displeasing. Moreover there are questions on the interpretation of
‘pleasing’. There could be several reasons for which an observer can judge the
illumination pleasing. Task performance could be facilitated, colour appearance could contribute to beautification, global subjective impression could improve, and cognitive appreciation could interact with direct sensation. Kruithof's findings may also vary as a function of culture or geographic location. Desirable sources are based on an individual's previous experiences of perceiving colour, and as different regions of the world may have their own lighting standards, each culture would likely have its own acceptable light sources.(4) In conclusion Kruithof curve should be taken into account as a general rule of thumb, considering that several studies have yielded both to similar conclusion and to opposite ones.(25)
3.2.4Colour Rendering
Colour rendering is a general term for describing the ability of a light source to provide colour information to a human observer when objects are illuminated by that source. The colour rendering properties of a light source cannot be accurately assessed by visual inspection of the light source; rather, a calculation procedure must be used. (22) Many methods for quantifying the colour rendering properties of electric light sources have been proposed. All of these methods have limitations in characterizing the various aspects of colour perception associated with colour rendering. Every method utilizes the SPD of the light source. Most, but not all, incorporate one or more reference light sources to which a particular light source is compared. Most procedures also incorporate a reference set of coloured objects to be illuminated. Most known colour rendering metrics are three: colour rendering index (CRI), full-spectrum index (FSI), and colour gamut area (GA). (26)
Colour Rendering Index (CRI) is currently the only colour rendering metric recognized internationally, and it is universally used by the lighting industry. In
general terms, CRI is a measure of a light source's ability to show object colours "realistically" or "naturally" compared to a familiar reference source. CRI is calculated from the differences in the chromaticity of eight CIE standard colour samples when illuminated by a light source and by a reference illuminant of the same correlated colour temperature (CCT); the smaller the average difference in chromaticity, the higher the CRI. A CRI of 100 represents the maximum value. Lower CRI values indicate that some colours may appear unnatural when illuminated by the lamp. For CCTs less than 5000 K, the reference illuminants used in the CRI calculation procedure are the SPDs of blackbody radiators; for CCTs above 5000 K, imaginary SPDs calculated from a mathematical model of daylight are used. These reference sources were selected to approximate incandescent lamps and daylight, respectively. The weakness of CRI is that light sources with different CCT are compared to different reference sources so, technically, CRI’s can only be
compared for sources that have the same correlated colour temperatures. Moreover CRI was developed to compare continuous spectrum sources who’s CRI was above
90 because below 90 it is possible to have two light sources with the same CRI, but which render color very differently.
Full-spectrum index (FSI) is a mathematical measure of how much a light source's spectrum deviates from an equal-energy spectrum. An equal-energy spectrum is an imaginary spectrum that provides the same radiant power at all wavelengths, thus representing a "full" spectrum. Therefore, for humans to see object colours, a light source must generate light from more than one region of the visible spectrum. Subtle differences in the perceived colours of objects arise from slight differences in the spectral reflectance of those objects. If a light source does not provide radiant power at those wavelengths where the spectral reflectances of those objects differ slightly, the objects will appear to have the same color. Therefore, a lamp that emits radiant power at all visible wavelengths would be expected to have good colour rendering properties. Among electric light sources, light from Xenon lamps most closely resembles a full spectrum. The same can be said for the 5500 K phase of daylight. Both of these sources have been experimentally shown to be excellent at revealing subtle differences in color that can not be seen under other types of lamp spectra. Light sources with deficiencies in some parts of the spectrum will have poorer FSI values and will be less effective at rendering subtle differences in object colours.
Gamut area (GA) is more commonly used in Japan than in North America. In principle, GA is defined as the area enclosed within three or more chromaticity coordinates in a given color space. GA is usually calculated from the area of the polygon defined by the chromaticities of eight CIE standard color samples in CIE 1995 color space when illuminated by a given light source. The CIE 1995 color space is used because equivalent distances in this color space are assumed to be "perceptually equal." In general, the larger the GA, the more saturated the object colors will appear.
Given the present state of knowledge about predicting the colour appearance of objects under different light sources, no single metric can capture the multidimensional aspects of colour rendering. In very general terms, a high colour rendering index (CRI) implies that colours will appear natural. A low full-spectrum index (FSI) implies that the light source will enable good discrimination between small colour variations. Finally, a large gamut area (GA) implies colours will be highly saturated.
3.2.5Veiling reflection
Veiling reflections are luminous reflections from specular or semi-matte surfaces that physically change the contrast of the visual task and therefore change the stimulus presented to the visual system. (21) They depend on specularity of the material being viewed and the geometry between the observer, the target, and any sources of high luminance. The positions where veiling reflections occur are those
where the observer’s eye is reached by reflected rays coming from a source of high luminance. If the object is a perfect diffuse reflector no veiling reflections can occur. Glossy papers, glass surfaces and computer screens are subject to cause veiling reflections. In rooms with several computer screens special care has to be taken in the positioning of the luminaires to avoid luminous reflections from the screens. In using portable computers the viewing directions may change in relation to the fixed luminaires and this poses further requirements for lighting design. Also, when rearranging the working places and geometry of the working conditions, the possible causes of veiling reflections should be avoided in the typical viewing directions. 3.2.6Shadows
Shadows occur when light from a particular direction is intercepted by an opaque object. (4) The effect of shadows can be overcome either by increasing the proportion of interreflected light by using high-reflectance surfaces or by providing local lighting in the shadowed area. If the object is small and close to the area of interest, the shadow can be cast over a meaningful area, which in turn can cause perceptual confusion, particularly if the shadow moves. An example of this is the shadow of the user hand while writing on paper as shown in Figure 9.
Figure 9 – Example of shadows caused by a pencil in upright position in different
lighting situations: two point sources, multiple large area sources, high interreflections.
The number and nature of shadows produced by lighting installations depend on the size and number of light sources and the extent to which light is interreflected. The strongest shadows are produced from a single point source in a black room. Weak shadows are produced when the light sources are large in area and the degree of interreflection is high.
3.2.7Flickers
The entire electric light sources that operate in AC produce a fluctuating output. If the fluctuations are visible the phenomenon is called flicker. General lighting installation that produces visible flicker will be almost universally disliked, unless it
is being used for entertainment. The detection of the flicker depends on users’
sensibility, so range of detection is wide and safety margins in flicker limits are necessary. The main variables that determine flicker perception are the frequency and percentage modulation of the oscillation in light output, the proportion of the visual field over which the flicker occurs, and the adaptation luminance.(21) To eliminate the perception of flicker, it is necessary to increase the frequency of oscillation above the critical flicker frequency or to reduce the percentage modulation of the oscillation, reduce the area of the visual field over which the oscillation occurs, or reduce the adaptation luminance. The most common approach
is to use “flicker-free” ballasts with high-frequency control gear for discharge lamps and to mix the light from lamps powered from different phases of the electricity supply, both of which increase the frequency and reduce the modulation of oscillation in light output.
3.3 Eye strain
Lighting for vision during the day is quite adequate in most of the office buildings, in part because people have very flexible visual systems and adjust their posture in response to the available lighting conditions. Any visual task that has characteristics that place it close to threshold visibility has a high level of visual difficulty. Many experiments show that young people with normal eyesight will systematically adjust the eye-to-task spacing to maintain good task visibility, either by moving closer to the visual task or shifting posture to avoid reflected glare. A flexible visual system combined with a flexible body provides most people with the ability to adapt to less than ideal lighting environments. On the other hand, some portion of the adult population will likely have visual problems. Normal aging involves a continuous loss of visual accommodative ability, known as presbyopia. Instead of getting closer to an object people with presbyopia actually move the object farther away from their eyes, or they place it under a bright light, usually provided by a window or skylight. As the task is moved (brought closer or farther), the accommodation mechanism of the eye adjusts to keep the retinal image in focus. The continuous adjustments can lead directly to fatigue of the eye muscles, and indirectly to fatigue of other muscles
caused by the observer adopting an unusual posture. Such muscle fatigue can produce symptoms of visual discomfort.(21) Long-term eye discomfort may lead to visual fatigue. Even if the concept of visual fatigue, so called asthenopia or eye strain, is quite old it has not a univocal definition since symptoms are many and non-specific (19). Its symptoms include irritated or itching eyes, headaches, diplopia (commonly referred to as double vision), spasms of facial muscles, conjunctivitis (otherwise known as pink eye), hot flushes, watering, increased nervousness and consecutively lower work performance(4). The overall tiredness is just a result of long-term eye strain, leading to loss of focus and attention. This can result in incorrect work practices and even injury. If employees feel several of such symptoms the work safety rules demand a medical assessment of their condition. Repeated eye strain is a cause to re-evaluate the lighting system in the workplace.
3.4 European standard EN 12464-1
To fulfil a visual task correctly and avoid visual discomfort the lighting system has to guarantee that the visual performance can be carried out well above the visibility threshold limits. To prevent overall tiredness and consequent injuries, the standards in EN 12 464-1:2011 “Lighting of work places – Indoor work places” (20) set up a framework depending on the demands of the job being carried out. Since lighting condition affect directly the visual performance, lighting systems have to be designed depending on the visual tasks to be fulfilled in that certain space. Visual tasks, and so the purpose of the space, have to be know in advance to be able to design the lighting system. The EN 12464-1 gives minimum requirements that workplace lighting and the direct environment needs to meet in order for the users to fulfil their visual tasks in an efficient, accurate and safe way. The standard presents a collection of tables stating the minimum requirements for the particular visual task. The requirements are expressed in terms of minimum required average illuminance per task, maximum URG, minimum uniformity and minimum required Ra.
In particular illuminance levels must not fall below the Ēm maintenance values in
the visual task area. If the precise location is not known, the limit should be applied to the whole room or a specific working area. UGRL is the upper limit for direct
glare. The UGR value calculated in the design process must lie below this. Uniformity UO is the ratio between the lowest (Emin) and the mean illuminance level
(Ē) in the area. Ra is the lower limit for the colour rendering index. The Ra of the
Table 1 - Minimum requirements for lighting in offices stated out by EN 12464-1 Ref.no.
Type of area, task or activity Ēm lx URGL - Uo - Ra - Specific requirements 5.26.1 Filing, copying, etc. 300 19 0.40 80
5.26.2 Writing, typing, reading, data processing 500 19 0.60 80 DSE-work 5.26.3 Technical drawing 750 16 0.70 80
5.26.4 Cad work station 500 19 0.60 80 DSE-work 5.26.5 Conference and meeting rooms 500 19 0.60 80 Lighting should be controllable 5.26.6 Reception desk 300 22 0.60 80 5.26.7 Archives 200 25 0.40 80
3.5 Lighting Quality and Visual Comfort
Since the thirties of the past century, science of illumination has been a multidisciplinary field of study, strictly liked to the science of vision.(27) In fact the purposes of the research were already melting together and new ideas were
spreading: “It is not sufficient to see, good vision is needed; the benefits of light are
welcome, while risks are to be avoided; hygiene of sight is worthwhile, but also the health of the organism as a whole is to be taken into account” (28). Psychological effects were already considered in terms of motivation, satisfaction, aesthetics and pleasantness. Meanwhile managers started to wonder if and how the results of the scientific researchers could increase productivity, welfare and satisfaction of the workers. While the field of research was broadening, engineers decided that the best solution was considered only what was rigorously measurable, as for example illuminance, luminance, and contrast. Visual tasks have been divided into categories and standards, codes and recommendations have been set so that proper lighting of the workplace could be assured. The standards considered mostly threshold values, even if it was clear that the lighting in workplaces had to be well above the threshold limit. Efforts started to be put in finding a definition of lighting quality measurable by the mean of only one number. Researchers proposed many different methods, but
soon became obvious that it couldn’t be possible. Even nowadays there is not a
complete and general definition of lighting quality and a lot of different definitions have been suggested in the past few years. The definition that seems most generally applicable is the one given by Boyce (4):
“Lighting quality is given by the extent to which the installation meets the objectives and constraints set by the client and the designer”.
Objectives can be first of all avoiding visual discomfort, but also enhancing performance of relevant tasks, creating a specific impression, generating desire patterns of behaviour. The constraints can be related to standards, financial budgets, resources available, time-lines to complete the project, design approaches that have
to be followed. This classification of light quality doesn’t refer to any photometric
measurements but, in Boyce opinion, there are three arguments in favour of this definition:
Lighting is usually design and installed as a mean to an end, not as end itself. The achievement of the goal has then to be taken into account in the measure of the success.
There are many physical and psychological aspects that can influence the perception of light quality so lighting quality cannot be define only from a visual performance point of view.
Desirable light depends very much on the contest (social and cultural contest, visual tasks to be accomplished, etc.) so it is impossible to define lighting quality in a univocal and universal way.
Lighting quality is much more than providing the right amount of light and avoiding visual discomfort. Ensuring adequate and appropriate light levels (quantity of light) is only an elementary step in creating comfortable and good-quality luminous and visual environments. With a really simple description, lighting in an office can be qualitatively defined as bad, indifferent or good. Since lighting should be first of all designed to provide people with the right conditions that help them to perform visual tasks efficiently, safely and comfortably, lighting can be
defined as bad if doesn’t allow user to complete their visual tasks and causes visual
discomfort, indifferent if allows users to quickly and easily see what they need to see
and doesn’t cause visual discomfort, good quality if, among all these aspects, it also “lifts the human spirit”.(4) Lighting quality can be initially judged according to the level of visual performance required for activities and these is a visual aspect, but then there are also many physical and physiological factors that can influence the perception of lighting quality. For example lighting quality deals with psychological aspects when it is assessed on the basis of the pleasantness of the visual environment and its adaptation to the type of room and activity. In addiction there are also long term effects of light on our health, which are related either to visual aspects (the strain on our eyes caused by poor lighting), or to non-visual aspects, like the effects of light on the human circadian system.
The lighting design process can be then divided into two steps. The first one aims to achieve standards requirements, assuring that the lighting quality is not bad and so that the standard users can properly fulfil their visual tasks. The second step takes into account the real human being that will work in that space, trying to predict how he/she will perceive, live and react to the lit area, trying to assure a lighting system
with good lighting quality. The first step procedures are already well known and defined, even if visual tasks in offices change over time and standards need to be often updated. Second step applications are way broader and subject of many present researches.
3.6 New offices and new visual tasks
The introduction of computers in the workplace has dramatically changed the lighting office design. In the 1980s and 1990s, issues pertaining to reflections and reflected glare on computer monitor displays prompted the development of dedicated lighting recommendations. But as the nature of office work has changed, to become more focused on computers and screen-based tasks coupled with newer
display technologies and today’s energy-efficiency criteria, what was once standard practice for office lighting has also evolved (29).
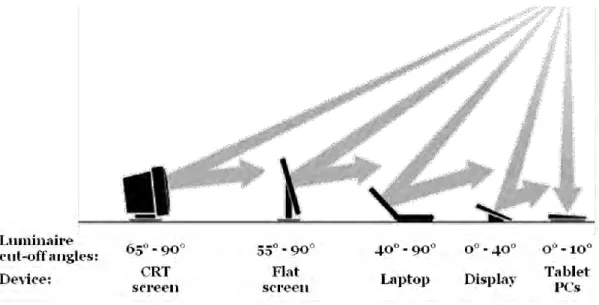
The first type of computer screens used was cathode ray tube (CRT), a technology inherently reflective. CRT monitors generate images by using an electron gun to shoot streams of electrons across a glass surface coated with millions of phosphor dots. These phosphors are white and very reflective. Therefore essentially all CRTs have some form of anti-reflective coat. Given how reflective CRT monitors are, office illumination designed in the 1980s and 1990s prioritized minimizing glare and ensuring visual performance. Vertical illuminance levels for screens were kept between 50 and 100 lx for optimal visibility. Lamps were shielded and luminance limits were established for direct lighting at high angles between 65 and 90 degrees (1000 cd/m² or 200 cd/m², depending on the screen quality). Low-glare lenses and louvers were commonly used. In workstations, the strong directional lighting required task lighting to eliminate shadows under shelves. Indirect lighting offered another option for eliminating glare. The light reflected off the ceiling was softer, less bright and therefore more accommodating of VDTs. Fixture spacing was optimized to ensure uniform illumination. The sharp cut-off, however, resulted in a cave effect and a gloomy office environment.
Few CRT monitors are still in use today, having been replaced by brighter and less-reflective technologies. Of these technologies, LCD (liquid crystal display) is the most widely used in desktop monitors, laptops, tablets, and cell phones. These displays also tend to be the brightest, achieving luminance of 300 to 450 cd/m², compared to 100 to 250 cd/m² for both CRTs and plasma screens. LCDs owe their high luminance to an independent backlight, the front polarizer absorbs and blocks ambient light, and the liquid crystal itself is a clear liquid, rather than a highly reflective white phosphor. Anti-reflectance treatments have proven effective in eliminating reflected imaging, and higher internal brightness and increased contrast have improved screen visibility, even in elevated ambient light situations. Such developments have pushed standards and lighting guidelines to evolve.
In the EN12464-1:2011 standard, compared to EN12464-1:2003, new luminance limits are defined for luminaires used with flat panel displays (display screen
equipment DSE), because display screen technology has advanced, the limits are looser in the 2011 edition. Two limits are specified for ordinary office tasks depending on the luminance of the background:
For display screens where background luminance is L <200 cd/m², luminaires luminance needs to be limited to a maximum value of 1,500 cd/m².
For screens where background luminance is L >200 cd/m², luminaires luminance up to 3,000 cd/m² are permissible.
For new flat screens, manufacturers generally indicate maximum adjustable background luminance L >200 cd/m² but in practice the screens are mostly operated at L<200 cd/m². What is more, the background luminance that is subsequently set is not known at the design stage. In such cases, the luminance of the luminaires used should not exceed 1500 cd/m². Lower limits are set for more
demanding visual tasks at a DSE work station (e.g. CAD): L ≤ 1000 cd/m² for
display screens where background luminance is L &l