Authentication Anomaly Detection: A Case Study On A
Virtual Private Network
Michael J. Chapple
Nitesh Chawla
Aaron Striegel
Department of Computer Science and Engineering
University of Notre Dame
Notre Dame, IN, 46556, USA
{
mchapple,nchawla,striegel
}@nd.edu
ABSTRACT
The authentication logs on a network can provide a trove of information for discovering potential anomalies in login attempts. Using such logs collected by a production Vir-tual Private Network device over a period of 15 months, we generate a diurnal model of network accesses. These models are used to detect anomalous authentications, which merit further investigation by a security analyst. We intend that this work will dramatically reduce the amount time spent by analysts identifying anomalous events and allow them to focus on in-depth analysis of these anomalies. Our work makes two contributions: a novel approach of mining au-thentication data, and the use of geographic distance as a metric to evaluate Virtual Private Network connections. We demonstrate the success of our model using real-world case analysis.
Categories and Subject Descriptors
I.5.4 [Computing Methodologies]: Pattern Recognition
General Terms
Security
Keywords
Security, Data Mining, Authentication, Anomaly Detection, Virtual Private Network
1.
INTRODUCTION
The security analysis of authentication logs is a critical, yet tedious task facing security administrators on a daily basis. These logs contain a wealth of information, includ-ing the time, originator, source location, and nature of each authentication attempt. Identification of unsuccessful lo-gin attempts (e.g. incorrect username or password) is quite
Permission to make digital or hard copies of all or part of this work for personal or classroom use is granted without fee provided that copies are not made or distributed for profit or commercial advantage and that copies bear this notice and the full citation on the first page. To copy otherwise, to republish, to post on servers or to redistribute to lists, requires prior specific permission and/or a fee.
MineNet’07, June 12, 2007, San Diego, California, USA.
Copyright 2007 ACM 978-1-59593-792-6/07/0006 ...$5.00.
straightforward. However, it is quite difficult to analyze these logs for anomalous successful login attempts (i.e. those that do not fit patterns of normal activity).
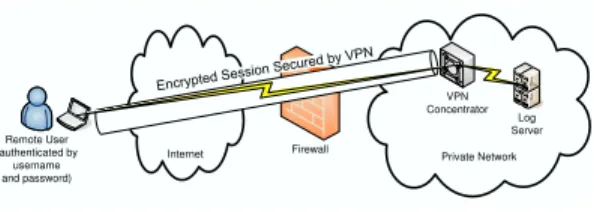
This paper describes a novel approach to identify anom-alies in authentication logs through the use of expectation maximization clustering. Specifically, we use connection records from a deployed university Virtual Private Network (VPN) to develop models of typical activity based upon user type, role, connection date and time, and geographic distance from the connection source to the VPN endpoint. VPNs are used for two primary purposes: to interconnect geographically separated networks, such as in a remote office application, and to allow remote user access to a network, such as for traveling users. We use data gathered from a real-world remote access VPN, such as the one shown in Figure 1. Our data includes almost 80,000 individual con-nection records generated by over 800 unique users over a 15-month period.
Authentication records provide security administrators with critical information on user activity and are especially in-sightful when attempting to detect malicious insider attacks [2]. Without the use of data mining techniques, it would be cost prohibitive to analyze these records. Even if an analyst could examine one record every three minutes (a generous estimate based upon our experiences), it would take more than one full-time analyst to review these records. Given the resource constraints facing most organizations, it is simply not possible to dedicate this level of resources to authenti-cation log analysis. It is also significant to note that VPN records are only one of many possible sources of authentica-tion data.
In this research, we demonstrate that it is possible to use expectation maximization clustering to dramatically reduce the proportion of log entries that require human analysis. Specifically, we show that it is possible to reduce the load by 99.56% to approximately one analyst event per day.
1.1
Contributions
Our work makes two significant contributions: a novel ap-proach of mining VPN authentication data and the use of geographic distance as a metric to evaluate VPN connec-tions. We evaluate our approach through the use of real-world data, avoiding many of the drawbacks inherent in us-ing artificially engineered data, such as that used in the 1998 DARPA evaluation.
While there has been much related work in the field of anomaly detection, we believe this to be the first research
Internet Private Network Remote User (authenticated by username and password) Firewall VPN Concentrator Log Server
Figure 1: Virtual Private Network
based upon the analysis of VPN authentication attempts. Previous work focused on areas such as network traffic anom-alies [3] [4] [6] [7] [11] [12] and the correlation of events from other systems [13].
2.
METHODOLOGY
We believe that authentication data for a VPN is natu-rally organized into clusters based upon user and connection attributes. In this paper, we demonstrate the successful use of clustering to identify anomalous connections to a VPN on a university network. We believe that these findings will hold true for other user populations. Our goal is to dra-matically reduce the number of anomaly cases that must be routed to an intrusion analyst for review.
Our approach to identifying anomalous authentication at-tempts uses the training set to develop a cluster model of activity. We then apply this model to the evaluation dataset and obtain a probability distribution for each instance de-scribing the likelihood of the instance being assigned to each cluster in the original model. We use these probabilities to detect outliers in the evaluation dataset, based upon the concept that those elements with lower probabilities of be-ing assigned to their primary cluster are less likely to be true cluster members and more likely to be outliers worthy of further investigation. The following sections explore this methodology in further detail.
2.1
Cluster Development
We developed our cluster models on the evaluation dataset with expectation maximization (EM) clustering [16] using the EM clustering algorithm included in the Weka [15] data mining package with a minimum allowable standard devia-tion of .000001.
We determined the number of clusters which provided an optimal fit to the dataset by using ten-fold cross-validation with 100 iterations, also using Weka’s cross-validation al-gorithm. This algorithm uses the following cross-validation methodology [15]:
1. Set the number of clusters to one.
2. Split the training set into ten random folds.
3. Perform EM clustering ten times using the ten folds. 4. Average the log likelihood performance measure from
each model.
5. If the measure increased over the previous iteration, increment the number of clusters and repeat. If it has not increased, return the previous iteration’s value as the optimal number of clusters.
2.2
Cluster Evaluation
We then applied the optimized cluster model to the train-ing dataset to determine the predicted cluster assignments for each instance. These predictions were evaluated using Algorithm 1 to provide the mean and standard deviation for each cluster. This was performed through the use of a custom Java program using the Weka application program-ming interface [15].
Algorithm 1Cluster Evaluation 1: Input: Set of training instancesX
2: Input: EM ModelM
3: Output: Set of cluster mean probabilitiesP
4: Output: Set of cluster standard deviationsS
5: for allinstancexi do
6: ApplyM toxi to obtain probability distributiond
7: Select maximum probabilitydi,j
8: Ci←j
9: Qi←di,j
10: end for
11: fori= 1 tonumclustersdo
12: Pi←Q¯for allQin clusteri
13: Si←stddev(Q) for allQin clusteri
14: end for
2.3
Outlier Detection
The cluster model developed using the training dataset was then applied to each instance in the evaluation dataset. This provided a probability distribution for each evaluation instance. Using a similar approach to that described in Sec-tion 3.2, we determined the highest probability assignment for each cluster and computed a z-score for this assignment based upon the cluster-specific mean probability and stan-dard deviation. Algorithm 2 provides further detail on this process.
Algorithm 2Outlier Detection 1: Input: Set of evaluation instancesX
2: Input: EM ModelM
3: Input: Set of cluster mean probabilitiesP
4: Input: Set of cluster standard deviationsS
5: Output: Set of z-scoresZ
6: for allinstancexi do
7: ApplyM toxi to obtain probability distributiond
8: Select maximum probabilitydi,j
9: Zi←di,j -Pj
10: Zi←Zi/Sj
11: end for
A security analyst may then use the z-scores provided by this approach to select those authentication attempts which appear to least fit the cluster model for further investigation. The use of a z-score assumes that the cluster assignment probabilities follow a Gaussian distribution. Therefore, the analyst may select a z-score threshold appropriate for the number of authentication attempts generated in a specific environment and the time available to investigate potential anomalies.
It is significant to note that only those outliers with neg-ative z-scores require investigation, as they represent in-stances which do not fit the cluster model. Those with ex-ceptionally high z-scores are technically outliers, but only in the sense that we are extremely confident that they fit the
Apr 4 08:06:47 vpn.foo.edu 662197 04/04/2006 08:06:47.740 SEV=4 IKE/52 RPT=5085 10.1.1.1 Group [general] User [jdoe1] User (jdoe1) authenticated.
Apr 4 08:07:54 vpn.foo.edu 662236 04/04/2006 08:07:54.250 SEV=4 IKE/52 RPT=5086 10.2.2.2 Group [developer] User [jdoe2] User (jdoe2) authenticated .
Apr 4 08:08:42 vpn.foo.edu 662275 04/04/2006 08:08:42.660 SEV=4 IKE/52 RPT=5087 10.3.3.3 Group [developer] User [jdoe3] User (jdoe3) authenticated.
Apr 4 08:09:14 vpn.foo.edu 662321 04/04/2006 08:09:14.780 SEV=4 IKE/52 RPT=5088 10.4.4.4 Group [health] User [drdoe] User (drdoe) authenticated.
Apr 4 08:10:33 vpn.foo.edu 662358 04/04/2006 08:10:33.410 SEV=4 IKE/52 RPT=5089 10.5.5.5 Group [helpdesk] User [itdoe] User (itdoe) authenticated.
Figure 2: Anonymized Log Extract
model. This is due to the fact that the z-score is calculated based upon a probabilistic measure of cluster membership. Therefore, an extremely high positive z-score indicates un-usually strong confidence in the cluster membership predic-tion.
3.
DATASET
The data used in this research consists of authentication records collected by a university VPN device over a period of 15 months. The device gathered these records in the normal course of business as the device operated in a production environment. Therefore, we consider this a valid dataset representative of real-world activity. Figure 2 shows several anonymized records generated by the device.
When developing the dataset, we identified each successful authentication attempt against the device and collected the following set of attributes for each event:
• User ID
• Source Internet Protocol (IP) address
• Timestamp
• Group
We did not collect data on unsuccessful authentication at-tempts or other system-related events that were also stored in the logs. Both of these categories of data were outside the scope of our evaluation, as our interest is limited to the evaluation of successful authentications. The analysis of un-successful login attempts is a separate research problem with a developed body of work [1] [14].
The training dataset consisted of 71,251 individual au-thentication attempts from a total of 782 unique users. The evaluation dataset consisted of 7,942 individual authenti-cation attempts from a total of 498 unique users. To ap-proximate a real-world anomaly detection environment, we separated the training and evaluation datasets based upon time. The training dataset consisted of the first 14 months of data while the evaluation dataset consisted of the last 34 days of authentication data.
Of these four data elements, the attempt’s group is the only one directly utilized as a feature by the clustering al-gorithm and merits further discussion. The VPN used to
generate these logs is a group-based VPN. That is, it al-lows users to specify a particular group they wish to au-thenticate against. Group membership grants users a dis-tinct set of privileges. For example, one group might have very broad membership and be used to grant general ac-cess to the campus network from off-campus locations. An-other group might be restricted to application developers and grant privileges to access sensitive databases. The tionship between users and groups is a many-to-many rela-tionship: each user may be a member of zero, one or more than one group.
We also used the primary data source to derive a number of related features. First, we used the user ID as a primary key into the enterprise directory service to obtain the user’s primary affiliation with the institution (e.g. Faculty, Staff, Other). We also used the timestamp, in conjunction with the institution’s academic calendar, to derive the day of the week, hour of the day and whether classes were in session on that particular day. Additionally, we determined from the user’s IP address whether they were connecting from off-campus, from the campus administrative network or from the campus residential network.
Finally, we used a database mapping IP address blocks to geographical locations [8] to compute the approximate geographic distance from the center of campus to the remote system [5]. In our training dataset, the minimum distance was 0 (representing an on-campus user) while the maximum distance was 10,874 miles. The mean distance was 71.26 miles with a standard deviation of 441.55 miles.
4.
EVALUATION
The evaluation of an anomaly detection system is a com-plex task which requires the use of subjective techniques. There are two possible approaches: the use of a known dataset and the use of live traffic.
The known dataset approach, such as that used in the DARPA Intrusion Detection Evaluation, has several limita-tions. First, technical complexities and confidentiality re-quirements make it quite difficult to generate these datasets in a fair and unbiased manner. These issues were discussed in a critique of the 1998 DARPA evaluation of intrusion de-tection systems [9]. In our case, we have only an unlabeled dataset. While all authentication attempts in the log files were successful, we have no way of determining whether they were truly initiated by the purported user
Live analysis also is suboptimal, as there is not a validated technique for identifying false negative alarms. False posi-tive alarms may be identified through root cause analysis of all alarms generated by the system, however, such an analy-sis is extremely time-consuming. Additionally, it is quite difficult to evaluate a system’s inability to alert on attacks in an unknown dataset, as the data is not labeled. A full treatment of the advantages and disadvantages of various testing approaches is provided in [10].
In the remainder of this section we evaluate the results of this research by analyzing the success of the clustering algorithm in modeling the data through the use of the train-ing and evaluation data sets. We first examine the clusters developed by the model to determine whether they provide intuitive groupings of authentication attempts. We then use the z-score evaluation approach to identify the number and severity of outliers in both datasets. Finally, we examine outlier cases from the evaluation dataset to empirically
de-termine the success of this approach.
4.1
Data Clusters
We identified an optimal-fit cluster model containing five clusters by using the clustering technique described in Sec-tion 3.1 on the evaluaSec-tion dataset. Analysis of these clusters revealed enough unique patterns that we can put subjective descriptions to the clusters based upon domain knowledge, as follows:
• Cluster A (Close Weekday): All instances in this clus-ter occured on weekdays. Most instances were from off-campus locations in the local vicinity (mean dis-tance of 0.83 miles from campus with a standard devi-ation of 0.45 miles). Most instances were from groups normally used for the purpose of gaining remote access without any special privileges.
• Cluster B (Close Weekend): Instances in this cluster exhibited similar features as those in Cluster A with two exceptions. First, the majority of attempts oc-curred on weekends. Second, the range of distances was slightly wider (mean of 3.45 miles, standard devi-ation of 6.34 miles).
• Cluster C (Remote Weekday): This cluster stood out from the previous two in that the access attempts were from much greater distances (mean of 200.47 miles, standard deviation of 278.41 miles). These occured mostly on weekdays and accessed groups normally used for gaining remote access only.
• Cluster D (Remote Weekend): This cluster was similar to Cluster C with the same two exceptions that dis-tinguished Cluster B from Cluster A. Most attempts occurred on weekends and the range of distances was wider (mean of 1240.83 miles, standard deviation of 1800.48 miles).
• Cluster E (Utility): This cluster was markedly dif-ferent from the others. Most authentications in this cluster used groups normally used to gain special priv-ileges. Attempts to access this group were predom-inantley made by university administrators with al-most no faculty representation. The vast majority of attempts occurred from on-campus locations on week-days. Also, access attempts clustered around the busi-ness day with a mean hour value of 10.73 with standard deviation 3.14.
These clusters do demonstrate the intuitive separations we expected in the dataset. It is reasonable to suspect that the characteristics of those using the device to gain remote access would be different from the characteristics of those using the device to gain special privileges. Additionally, one would expect to see variations in characteristics based upon distance from campus and day of the week.
4.2
Cluster Distribution
After we obtained these models, we used Algorithm 1 to obtain summary statistics for each cluster and then deter-mined cluster assignments and z-scores for each evaluation instance using Algorithm 2. The distribution of instances to clusters for both the training and evaluation datasets is provided in Table 1.
Table 1: Cluster Distribution by Dataset
cluster training evaluation
A 61% 58%
B 7% 5%
C 10% 19%
D 4% 5%
E 18% 13%
Table 2 provides the summary statistics for each cluster based upon the training dataset. The ¯pvalues provide the average probability for those instances assigned to the clus-ter. Thes values provide the sample standard deviation in probability for those same instances.
Table 2: Probability Distribution Statistics by Clus-ter cluster p¯ s A 0.8335 0.1427 B 0.9220 0.1246 C 0.9245 0.1061 D 0.8087 0.1872 E 0.6978 0.1351
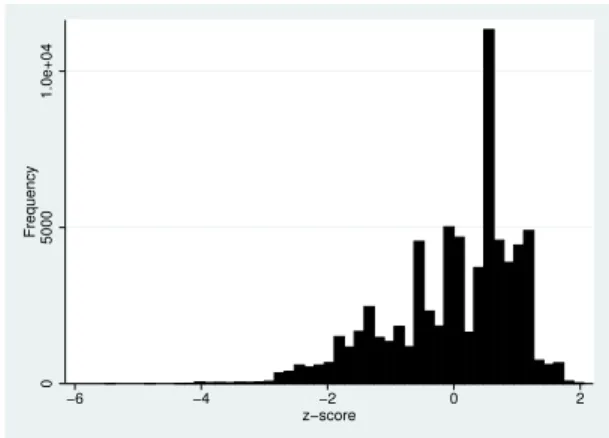
It is significant to note that the z-scores for both datasets appear to approximate a Gaussian distribution with slight bimodal tendencies. The z-scores for the training dataset are shown in Figure 3, while those for the evaluation dataset are illustrated in Figure 4. 0 5000 1.0e+04 Frequency −6 −4 −2 0 2 z−score
Figure 3: Training Data z-Score Distribution
4.3
Outlier Evaluation
The most important measure of any anomaly detection system is its ability to successfully detect outliers while min-imizing the number of false positive reports flagged for re-view by an analyst. We begin our evaluation of this system’s outlier detection capability by reviewing the frequency of re-ports generated and conclude by analyzing individual case studies to demonstrate the ability of this approach to detect true outliers.
4.3.1
Outlier Frequency
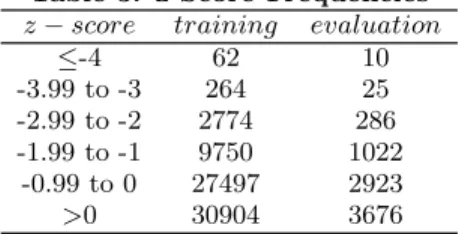
Table 3 shows the z-score frequencies for both the train-ing and evaluation datasets. As discussed earlier, we are
0 200 400 600 800 1000 Frequency −4 −2 0 2 z−score
Figure 4: Evaluation Data z-Score Distribution
only interested in evaluating those instances with exception-ally high magnitude negative z-scores. We chose a cut-off threshold of z ≤ −3, based upon the statistical principle that 99.7% of elements belonging to a normal distribution should fall within three standard deviations of the mean.
Based upon this threshold, our evaluation dataset con-tained only 35 outliers generated from 34 days of activity, representing a 99.56% reduction in the number of analyst events. This is clearly a reasonable number of instances for further investigation, as it represents a load of approx-imately one investigation per day. Furthermore, we could extend the threshold to include those values that are be-tween two and three standard deviations below the mean (z ≤ −2) and only identify 321 outliers requiring approxi-mately 9 investigations per day.
Table 3: z-Score Frequencies
z−score training evaluation
≤-4 62 10 -3.99 to -3 264 25 -2.99 to -2 2774 286 -1.99 to -1 9750 1022 -0.99 to 0 27497 2923 >0 30904 3676
4.3.2
System Effectiveness
Anomaly detection systems typically serve as a compo-nent of a larger intrusion detection infrastructure consisting of signature detection systems and other log analysis tools. Therefore, the effectiveness of an anomaly detection system lies not in its ability to detect all possible network intru-sions but, rather, in its ability to complement a signature-based intrusion detection system by detecting potential mis-use that was not flagged by traditional signature-based tech-niques. As mentioned in the previous section, our system detected 35 outliers in the evaluation dataset when using a cut-off threshold ofz≤ −3. We analyzed each of these out-liers to evaluate the effectiveness of the system. We classified each event into one of three categories:
• True positives are events identified by the system as anomalous which, upon further investigation, ap-peared to truly represent unwanted but successful au-thentication attempts.
• False positivesare events identified by the system as anomalous which, upon further investigation, ap-peared to represent legitimate activity.
• Suspicious eventsare those events identified by the system as anomalous which, upon further investiga-tion, could not be clearly identified as anomalous but exhibited behavior which would warrant further atten-tion from a security analyst.
The effectiveness of the system may be measured by its abil-ity to detect true positive outliers that were not detected by traditional techniques. Table 4 shows a breakdown of the 35 anomalous events identified during our evaluation by these classes. Note that it is not possible for the system to identify false negative events, as we are using an unlabeled dataset.
Table 4: Event Classification
Class F requency
True positive 7 False positive 16 Suspicious event 12
4.3.3
True Positive Analysis
The seven true positive events identified during this analy-sis represented two different types of activity, which we an-alyze as separate cases.
Case 1: Unusual Distant Connections: Four of the events were VPN connections made from a location 218 miles away from campus in the late night hours by the same staff mem-ber’s account. Further research revealed that this account belongs to a temporary employee with a job function that does not likely require remote network access. This case was referred to management for review and action.
Case 2: Unauthorized Use of Group Account: Three of the events were VPN connections made from off campus using a shared account and connecting to a highly privileged VPN group. The use of a shared account for this type of connec-tion violates the principle of accountability, as it is no longer possible to associate privileged actions with a unique user. This type of use violates the institution’s security policy and was referred to management for review and action.
Both of the cases identified above were true positive events that were not detected by the signature-based intrusion de-tection system in use on the network. The failure of the signature-based system is consistent with the system’s na-ture: the cases certainly represented anomalous activity when compared to the network baseline, but they did not exhibit the characteristic attack signatures utilized by traditional systems. Therefore, these cases demonstrate that the system meets the effectiveness goal of detecting attacks not identi-fied by a signature-based approach. This additional knowl-edge would potentially allow an analyst to identify misuse of privilege that would have otherwise gone undetected.
4.3.4
Suspicious Event Analysis
Each of the 12 events in the suspicious events category exhibited one or more of the following characteristics:
• Connection to a privileged VPN group from a remote location
• Connection during very late hours
These events, by their nature, all all worthy of further investigation, as they represent activity that deviates from the behavioral norm and exhibit prima facie evidence of sus-picious activity. These events were referred to management for further review.
4.3.5
False Positive Analysis
The remaining 12 events flagged as suspicious by our sys-tem appeared to be the result of normal, nonmalicious ac-tivity and are, therefore, classified as false positive errors.
The vast majority (81%) of these false positive events were directly attributable to errors in the geographical IP address data used in this analysis. The database identified these events as occurring from locations hundreds of miles from campus when DNS data indicated they were from the lo-cal area. It is likely that a more accurate geographilo-cal IP database would yield a lower false positive rate.
5.
CONCLUSIONS AND FUTURE WORK
Based upon our experimental results, we feel that the use of expectation maximization clustering holds great promise for authentication anomaly detection. Our results indicate that the technique identifies a manageable number of in-stances for further investigation and that those results are, indeed, likely to represent true outliers.
There are multiple avenues of potential future research stemming from this study. First, the tools and techniques used in this study are manual and time-intensive. Use of this technique in a production environment would require automation of the tools. Second, the technique described in this paper models activity based upon a single training period and then evaluates all future activity against that training period. Intuitively, activity in many enterprises may change over time, requiring adjustments to the model. Further research is necessary to determine the best method for evolving the cluster models as time elapses. Third, as noted in section 4.3.2, the geographic IP address database contained several errors. We feel that complementing this database with the administrator’s domain knowledge of lo-cal Internet service providers would reduce the frequency of false positive errors. Finally, these same techniques may be applied to other, similar datasets, such as network flow records and operating system audit trails.
6.
REFERENCES
[1] J. P. Anderson. Computer security threat monitoring and surveillance. Technical report, National Institute of Standards and Technology, 1980.
[2] R. C. Brackney and R. H. Anderson. Understanding the insider threat. InProceedings of a March 2004
Workshop, pages 1–137, Santa Monica, CA, USA,
2004. RAND National Security Research Division. [3] J. D. Brutlag. Aberrant behavior detection in time
series for network monitoring. InLISA ’00: Proceedings of the 14th USENIX Conference on System Administration, pages 139–146, Berkeley, CA, USA, 2000. USENIX Association.
[4] J. B. D. Cabrera, B. Ravichandran, and R. K. Mehra. Statistical traffic modeling for network intrusion detection. InProceedings of the 8th International
Symposium on Modeling, Analysis and Simulation of
Computer and Telecommunication Systems, pages
466–473, Washington, DC, USA, 2000. IEEE. [5] A. C. Deltac. Geo::distance perl module, 2005.
Retreived on October 8, 2006 from
http://search.cpan.org/ bluefeet/Geo-Distance-0.11/Distance.pm.
[6] M.-S. Kim, H.-J. Kang, S.-C. Hong, S.-H. Chung, and J. W. Hong. A flow-based method for abnormal network traffic detection. InProceedings of the IEEE/IFIP Network Operations and Management
Symposium, pages 599–612. IEEE, 2004.
[7] K. Leung and C. Leckie. Unsupervised anomaly detection in network intrusion detection using clusters. InProc. 28th Australasian CS Conf., volume 38 ofCRPITV, 2005.
[8] MaxMind. Geolite city, 2006. Retrieved on October 8, 2006 from http://www.maxmind.com/app/geolitecity. [9] J. McHugh. Testing intrusion detection systems: A
critique of the 1998 and 1999 DARPA intrusion detection system evaluations as performed by Lincoln Laboratory.ACM Trans. Inf. Syst. Secur.,
3(4):262–294, 2000.
[10] P. Mell, V. Hu, R. Lippmann, J. Haines, and
M. Zissman. An overview of issues in testing intrusion detection systems. 2003. NIST IR 7046.
[11] T.-L. Pai and P.-W. Wang. Netflow based intrusion detection system. InProceedings of the 2004 IEEE International Conference on Networking, Sensing and Control, pages 731–736. IEEE, 2004.
[12] L. Portnoy, E. Eskin, and S. Stolfo. Intrusion detection with unlabeled data using clustering. InACM
Workshop on Data Mining Applied to Security, 2001. [13] J. J. Treinen and R. Thurimella. A framework for the
application of association rule mining in large intrusion detection infrastructures. InRAID 2006: Proceedings of the 9th Annual Symposium on Recent Advances in Intrusion Detection, pages 1–18. Springer Berlin / Heidelberg, 2006.
[14] G. Tsudik and R. Summers. AudES: An expert system for security auditing. InProceedings of the AAAI Conference on Innovative Application in Artificial Intelligence, 1990.
[15] N. Z. University of Waikato. Waikato environment for data analysis v3.5.3, 2005. Retrieved on October 8, 2006 from http://www.cs.waikato.ac.nz/ml/weka/. [16] I. H. Witten and E. Frank.Data Mining: Practical
Machine Learning Tools and Techniques. Morgan
Kaufmann Series in Data Management Systems. Morgan Kaufmann, second edition, June 2005.