The Influence of Service Quality and Customer Relationship
Management on Customer Trust, Satisfaction and Loyalty in
Islamic Banking in Pekanbaru City
Deny Danar RahayuLecturer, Department of Management, Faculty of Economic and Business, University of Riau, Campus Binawidya KM.12,5 New Simpang Handsome, Pekanbaru, Riau, 28296
Abstract
This study aims to examine the influence of Service Quality, Customer Relationship Management and Trust on Customer Trust, Satisfaction, and Loyalty in Islamic Banking in Pekanbaru. The population in this study comprised Islamic banking customers in Pekanbaru City. The data used in this study were primary and secondary data. Data collection method in this study involved questionnaire in which a set of written questions were given to and responded by the respondents. Data analysis technique used was Structural Equation Modeling (SEM).The results of the study prove the following points: (1) Service quality has a significant influence on customer trust. (2) Service quality has a significant influence on customer satisfaction. (3) Service quality has a significant influence on customer loyalty. (4) CRM has a significant influence on customer trust. (5) CRM has a significant influence on Customer Satisfaction. (6) CRM has a significant influence on customer loyalty. (7) Customer trust has a significant influence on customer loyalty. (8) Customer Trust has a significant influence on customer satisfaction. (9) Customer satisfaction has a significant influence on customer loyalty.
Keywords: service quality, CRM, customer trust, customer satisfaction, customer loyalty 1.Introduction
The world of banking currently shows a very rapid development, not to mention Islamic banking. More people nowadays start looking at Islamic banking. This can be seen based on the increasing number of customers of Islamic Commercial Banks (known as BUS) and Sharia Business Units (known as UUS).
Based on the 2016 Sharia Banking statistics released by OJK (Financial Services Authority), the number of customer financing, receivables and salam based financing was 3,134,642 customers in December 2014, reached 3,401,887 customers in December 2015, and continued to increase up to 3,659,405 in September 2016. Moreover, the number of customers in third party funds was 11,444,013 customers in December 2014, reached 10,761,002 customers in December 2015, and continued to increase to 16,959,699 customers in September 2016.
This is also evident from the number of banks that implement the dual banking system where conventional banks form Islamic banking units. In fact, there are now a number of Islamic banks that have performed spin-off and are no longer in the form of UUS but BUS. This is due to the rules stated in the Act no. 21 of 2008 concerning Sharia Banking in article 68 paragraph 1 which states that "in the event that a Conventional Commercial Bank having a UUS of which its assets value has reached at least 50% (fifty percent) of the total asset value of its Parent Bank or after 15 (fifteen) years of coming into force of this Act, the Conventional Commercial Bank must conduct a UUS Splitting (spin off) tu turn it into an Islamic Commercial Bank".
Business activities of Islamic banks are not much different from those of conventional banks. The difference is that Islamic banks use the principles of Islamic Economics (sharia) in carrying out their banking activities. The implementation of the Islamic Economic system is believed to have advantages for both the bank and the national economy as well as for its customers.
Islamic banks and conventional banks are competing to provide diverse and attractive services as an effort to win the competition. This competition is not easy, considering that heterogeneous bank customers cause differences in customer motives and mindset. Maintaining customer loyalty by establishing a relationship with customers is one of the steps to win the tight competition. According to Maidi (2014: 2) to get loyal customers, one of the efforts made by a company is to implement CRM (Customer Relationship Management).
Thus, Islamic banks must improve their performance and service quality more professionally and offer more innovative and profitable products by paying attention to the value obtained by customers. In addition, Islamic banks need to always maintain the sharia purity of product attributes in accordance with Al-qur'an and Al-hadith. In the midst of the development of the Islamic banking industry, further research is still needed regarding service quality, relationship quality, customer satisfaction and customer loyalty. The object of this study is Islamic Banking in Pekanbaru City.
Based on the elaborated background, the problem of this study is formulated as follows: How is the influence of Service Quality, Customer Relationship Management, and Trust on Customer Trust, Satisfaction, and Loyalty in Islamic Banking in Pekanbaru?
the influence of Service Quality, Customer Relationship Management and Trust on Customer Trust, Satisfaction, and Loyalty in Islamic Banking in Pekanbaru.
2.Literature Review
2.1 Service Quality
According to Kotler (2002) the definition of service is any action or activity that can be offered by a party to another party, which is basically intangible and does not result in any ownership. Service is the behavior of producers to fulfil the needs and desires of consumers which eventually leads to the gain of customer satisfaction. This behavior can occur before and after the transaction.
In general, high-quality services will result in high satisfaction and more frequent repurchases. The word quality contains many definitions and meanings, and different people will interpret it differently. From several definitions of quality, we can find some similarities in the elements of quality as follows:
a. Quality includes efforts to meet or exceed customer expectations. b. Quality includes products, services, people, processes and environment c. Quality is an ever changing condition.
2.2 CRM (Customer Relationship Management)
2.2.1 The Concept of Customer Relationship
A successful company is a company that is able to establish a long-term relationship with its customers. Long-term relationship involves loyal customers who expect that their needs and desires are met (satisfied customers) by the products or services provided by the company (Tjahyadi, 2010). Relationship is a contact between two or more people, but does not rule out the possibility of contact between people with objects, symbols or companies (Tjahyadi, 2010). The focus of marketing based on customer relationship is to obtain and maintain (retention) consumers.
2.2.2 Customer Relationship Management
Many companies nowadays develop stronger relationship with their customers, commonly referred to as customer relationship management (CRM). Kotler and Keller (2007) define CRM as the process of managing detailed information about each customer carefully and managing all customer touching points to maximize customer loyalty. Touching point is any opportunity where a customer interacts with a brand, product and service from a company.
2.2.3 The Power of Customer Relationship in Building Loyalty
The essence of customer loyalty, according to Kartajaya (2007), is more emotional and not functional, namely how deep/strong customers feel the connection/interest in the relationship with the product/service of a company. In the second era (the first era is satisfaction), a company focuses more on efforts to maintain the number of existing customers by minimizing the number of lost customers. This is, according to many studies, due to the higher cost of acquiring new customers. Another reason is because of the tendency of the lost customers to turn into "terrorists" for the company because they spread bad news to other ten to fifteen customers (Kartajaya, 2007). 2.2.4 Customer Trust
Trust in this case is the belief that someone will find what they want from the exchange partner. Trust involves a person's willingness to behave in a certain way because of the belief that his/her partner will give him/her what he/she hopes for and a hope that is generally owned by someone that the words, promises or statements of others can be trusted, (Barnes in Kusmayadi 2007). According to Barnes in Kusmayadi (2007), several important elements of trust are as follows:
Trust is a development of experiences and actions in the past as well as characteristics that are expected from partners, such as being trustworthy and reliable
Trust involves a willingness to put oneself at risk Trust involves feeling safe and confident with the partner
According to Peppers and Rogers (1994), Trust is the belief of one party in the reliability, durability, and integrity of another party in the relationship and the belief that the action is the best interest and will produce positive results for those who are trusted. Trust is important for relationship success.
Trust is someone's willingness to rely on others in which he/she has confidence in them. When a person makes a decision, he or she will choose a decision based on the choice of people who he/she can trust more.
3.Research Method
This study was conducted in Islamic Banking in Pekanbaru City. Types and sources of data needed in this study are primary and secondary data. Primary data are those which refer to information obtained from the first hand by researchers related to interest variables for specific purposes of study (Sekaran, 2006), while secondary data are those that refer to information collected from existing sources (Sekaran, 2006). Population refers to the whole group of people, events, or things of interest that researchers want to investigate (Sekaran, 2006). In this study, the
population comprised Islamic Banking Customers in Pekanbaru City. Sample is a part of the population that is directly subject to research. There are two techniques that can be done in sampling, namely probability sampling and nonprobability sampling. Probability sampling is a sampling technique that provides equal opportunities for each population element to be chosen as a sample. Nonprobability sampling is a sampling technique that does not provide equal opportunities for each element or member chosen to be a sample (Sugiyono, 2005).
The data were collected by using a questionnaire as data collection technique by administering a set of written questions to the respondents and the respondents were required to respond to the questions. Questionnaire is suitable for use if the respondents are large enough and scattered.
3.1 Data Analysis Method
Analysis is an activity to utilize data so that a truth or untruth can be obtained from a hypothesis. In the analysis, imagination and creativity are needed, so the ability of the researcher to reason something is tested (Subagyo, 2008). The measurement scale used in this study to determine the response of respondents is Likert Scale which shows the respondents' response on the increase of product/service use. Respondents' responses in this study consisted of five alternatives that encourage multilevel variation of values from the object of research through responses which were given score 1 to 5, namely:
1. Response of Strongly Disagree : Scored 1 2. Response of Disagree : Scored 2 3. Response of Fairly Agree : Scored 3 4. Response of Agree : Scored 4 5. Response of Strongly Agree : Scored 5
3.2 Testing of Data Analysis
3.2.1 Validity Test
Validity is a measure that shows how valid an instrument is in collecting research data. An instrument which is considered valid has high validity. Conversely, an instrument which is less valid has low validity (Suharsimi and Arikunto, 2002).
Validity test was used to measure the validity of the questionnaire. Significance test was performed by comparing the r value and r table. If the r value of each item is greater than r table and it is positive, the questionnaire item is confirmed to be valid. The validity test was carried out using a one-sided test, a significance level of 5% with df = n-2. The validity test was done by means of Pearson's Product Moment formula (Suharsimi and Arikunto, 2002) as follows:
Note : : Instrument validity N : Number of sampels ∑ : Number of variable X ∑ Y : Number of variable Y Requirement :
If rvalue > rtable , Ho is accepted and Ha is rejected (significant). If rvalue < rtable , Ho is rejected and Ha is accepted (significant). 3.2.2 Reliability Test
Reliability test provides a result indicating that an instrument can be trusted and reliable enough to be used as a data collection tool due to its quality. Reliability shows the level of constraint (Sugiyono, 2004). A questionnaire is regarded reliable if individual's answer to a question is consistent or stable over time. A construct or variable is said to be reliable if it has Alpha Cronbach value> 0.60 (Ghozali, 2009). Reliability test in this study was performed using Alpha formula (Sugiyono, 2004) as follows:
Note :
r = Instrument reliability K = Number of question items ∑ = Number of item variance
= Total variance 3.3.3 Normality Test
Normality test is used to determine if the dependent, independent or both variables are normally distributed, close to normal or not. The normality test in this study used a normal plot which showed the points around the diagonal
line. However, graphic images can sometimes be misleading since the distribution might seem normal but statistically incorrect. Therefore it is recommended to utilize the statistical test in addition to the plot, and one of the statistical tests that can be used is Kolmogrov-Smirnov test (K-S) with a significant alpha level of 0.05.
3.3 Structural Equation Modeling (SEM)
Structural Equation Modeling abbreviated as SEM is a multivariate analysis method that can be used to describe linear relationships simultaneously between observation variables (indicators) and variables that cannot be measured directly (latent variables) (Prihandini & Sunaryo, 2011). SEM is a multivariate analysis technique developed to cover the limitations of previous analysis models that have been widely used in statistical research. The models include regression analysis, path analysis, and confirmatory factor analysis (Hox & Bechger, 1998). 3.3.1 Advantages of SEM
According to Narimawati & Sarwono (2007), SEM advantages compared to multiple regression, among others, include allowing for more flexible assumptions, use of confirmatory factor analysis to reduce measurement errors by having multiple indicators in per latent variable, the attraction of SEM's graphical modeling interface to make it easier for users to read the results of the analysis, the possibility of testing the overall model from the individual coefficients, the ability to test models using multiple dependent variables, the ability to create models toward mediating variables, the ability to create error term models, the ability to test external coefficients across subjects groups, and the ability to overcome difficult data, such as time series data with autocorrelation errors, abnormal data, and incomplete data.
3.3.2 Models in SEM
In the SEM calculation model, there are two types of models as follows: 1. Structural Model
Structural model is a set of relationships between latent variables and these relationships can be considered linear, although further development allows entering non-linear equations. In graphical form, lines with one arrow head represent regression relationships in the Greek character written as "gamma" for regression of exogenous variables to endogenous variables and in Greek characters written as "beta" for regression of one endogenous variable to another endogenous variable, while lines with two heads arrow illustrates the correlation or covariance relationship in Greek characters written as "phi" for the correlation between exogenous variables. This model produces predictive validity.
2. Measurement Model
The measurement model is part of a SEM model that is usually associated with latent variables and indicators. The relationship in this model is done through a confirmatory factor analysis (CFA) model where there is an unmeasurable covariance between each pair of possible variables. This measurement model is evaluated as other SEM models by using alignment test measurements. This analysis process can only be continued if the measurement model is valid. This model produces convergent validity.
4.Result
4.1 Analysis of Service Quality Variable (X1)
To find out the customer's responses about the Service Quality at Bank BNI Syariah of Pekanbaru Branch in the form of statement, the results of the questionnaire on Service Quality variable at Bank BNI Syariah of Pekanbaru Branch are summarized as follows.
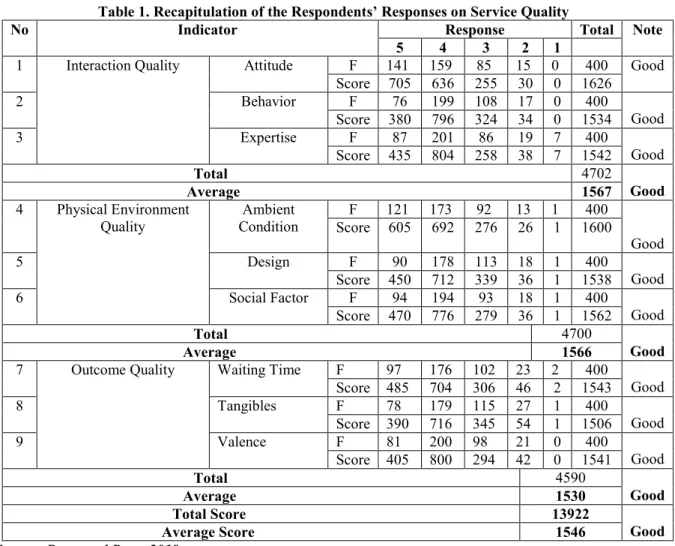
Table 1. Recapitulation of the Respondents’ Responses on Service Quality
No Indicator Response Total Note
5 4 3 2 1
1 Interaction Quality Attitude F 141 159 85 15 0 400 Good Score 705 636 255 30 0 1626 2 Behavior F 76 199 108 17 0 400 Good Score 380 796 324 34 0 1534 3 Expertise F 87 201 86 19 7 400 Good Score 435 804 258 38 7 1542 Total 4702 Good Average 1567 4 Physical Environment Quality Ambient Condition F 121 173 92 13 1 400 Good Score 605 692 276 26 1 1600 5 Design F 90 178 113 18 1 400 Good Score 450 712 339 36 1 1538 6 Social Factor F 94 194 93 18 1 400 Good Score 470 776 279 36 1 1562 Total 4700 Good Average 1566
7 Outcome Quality Waiting Time F 97 176 102 23 2 400
Good Score 485 704 306 46 2 1543 8 Tangibles F 78 179 115 27 1 400 Good Score 390 716 345 54 1 1506 9 Valence F 81 200 98 21 0 400 Good Score 405 800 294 42 0 1541 Total 4590 Good Average 1530 Total Score 13922 Good Average Score 1546
Source: Processed Data, 2018
The recapitulation in Table 1 showed 400 selected respondents' responses toward the questionnaire statements according to several indicators in Service Quality variable. The indicator of service quality which gained the highest score was attitude with the score of 1626. This proves that the attitude of Islamic Banking employees in Pekanbaru City is good and friendly. The indicator of service quality which gained the lowest score was tangibles with the score of 1506. This shows that the parking area should be able to be adjusted to the needs of customers. The average score of the overall service quality variable was 1546. This indicates respondents' good responses toward the statements contained in Service Quality indicator. This proves that Islamic Banking in Pekanbaru city has provided its best services to customers.
4.2 Analysis of Customer Relationship Management Variable (X2)
To find out the customers' responses about CRM in Islamic Banking in Pekanbaru City, the results of the study on CRM in Islamic Banking in Pekanbaru City are summarized as follows.
Table 2. Recapitulation of the Respondents’ Responses on CRM
No Indicator Response Total Note
5 4 3 2 1 1 Continuity Marketing F 81 225 73 20 1 400 Good Score 405 900 219 40 1 1565 2 One-to-one Marketing F 71 230 84 12 3 400 Good Score 355 920 252 24 3 1554 3 Partnering Program F 77 228 76 19 0 400 Good Score 385 912 228 38 0 1563 Total Score 4682 Good Average Score 1560
Source: Processed Data, 2018
The recapitulation in Table 2 also presented the responses of 400 selected respondents toward the questionnaire statements about three indicators of CRM. Continuity marketing was the indicator of CRM with the
highest score, namely 1565. This finding proves that the Bank has conducted its program by giving member card to its customers well.
Meanwhile, one-to-one marketing was the indicator of CRM with the lowest score, namely 1554. This shows that the individual approaches and services that banks do to their customers should be done better. Overall, the average score of CRM variable was 1560. This means that the respondents' responses to the statements contained in the CRM indicators are good. This proves that customers feel the benefits provided by Islamic Banking in Pekanbaru City.
4.3 Analysis of Customer Trust Variable (Y1)
To obtain the customers' responses about customer trust in Islamic Banking in Pekanbaru City, the results of the study on Customer Trust in Islamic Banking in Pekanbaru City are summarized as follows.
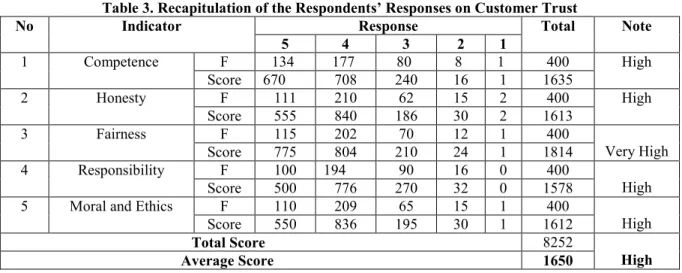
Table 3. Recapitulation of the Respondents’ Responses on Customer Trust
No Indicator Response Total Note
5 4 3 2 1 1 Competence F 134 177 80 8 1 400 High Score 670 708 240 16 1 1635 2 Honesty F 111 210 62 15 2 400 High Score 555 840 186 30 2 1613 3 Fairness F 115 202 70 12 1 400 Very High Score 775 804 210 24 1 1814 4 Responsibility F 100 194 90 16 0 400 High Score 500 776 270 32 0 1578
5 Moral and Ethics F 110 209 65 15 1 400
High
Score 550 836 195 30 1 1612
Total Score 8252
High
Average Score 1650
Source: Processed Data, 2018
Based on the recapitulation in Table 3, responses of 400 selected respondents toward the statements on several indicators of Customer Trust variable were summarized. The customer trust indicator which obtained the highest score was fairness with the score of 1814, while the indicator which obtained the lowest score was responsibility with the score of 1578. Moreover, the average score of Customer Trust variable was 1650. This means that the respondents' responses toward the statements contained in the Customer Trust indicators are High.
4.4 Analysis of Customer Satisfaction Variable (Y2)
To find out the customers' responses about customer satisfaction in Islamic Banking in Pekanbaru City, the results of the study on customer satisfaction in Islamic Banking in Pekanbaru City are recapitulated as follows.
Table 4. Recapitulation of the Respondents’ Responses on Customer Satisfaction
No Indicator Response Total Note
5 4 3 2 1
1 Service performance in line with customer expectations
F 106 148 112 32 2 400
Satisfied Score 530 592 336 192 2 1652
2 Customer relationship performance in line with customer expectations
F 78 178 116 26 2 400 Satisfied Score 390 712 348 52 2 1504 Total Score 3156 Satisfied Average Score 1578
Source: Processed Data, 2018
Based on the recapitulation in Table 4, responses of 400 selected respondents toward the statements on several indicators of Customer Satisfaction variable were summarized. The indicator of service performance in line customer expectations with the score of 1652 gained the highest score. This proves that bank service performance meets customer expectations for easy and fast transaction services.
Meanwhile, the second indicator, namely customer relationship performance in line with customer expectations gained the score of 1504. Although it was lower than the first indicator, it was still in the satisfied category. This finding shows that the service relationship provided by the bank is in line with customer expectations.
The average score of the overall Customer Satisfaction variable was 1578. This means that the respondents' responses to the statements contained in the Customer Satisfaction indicators are satisfied. This proves that customers feel satisfaction with the quality of services provided and with the value or benefits of the Bank.
4.5 Analysis of Customer Loyalty Variable (Y3)
Table 5 presents the summary of the respondents’ responses on customer loyalty in Islamic Banking in Pekanbaru City.
Table 5. Recapitulation of the Respondents’ Responses on Customer Loyalty
No Indicator Response Total Note
5 4 3 2 1 1 Repeat Buying F 58 185 123 32 2 400 High Score 290 740 369 64 2 1465 2 Retention F 61 194 113 28 4 400 High Score 305 776 339 56 4 1480 3 Recommendation F 74 199 97 27 3 400 Score 370 796 291 54 3 1514 Total Score 4459 High Average Score 1486
Source: Processed Data, 2018
Based on the recapitulation in Table 5, responses of 400 selected respondents toward the statements on several indicators of Customer Loyalty variable were summarized. The Customer Loyalty indicator which obtained the highest score was recommendation with the score of 1514. This proves that the customers are willing to recommend Islamic Banking in Pekanbaru City to others. Moreover, the Customer Loyalty indicator which obtained the lowest score was repeat buying with the score of 1465. This suggests that the customers are quite interested in using other bank product offers.
The average score of the overall Customer Loyalty variable was 1486. This means that the respondents' responses to the statements contained in the Customer Loyalty indicator are high. This proves that the customers are loyal to Islamic Banking in Pekanbaru City.
4.6 Data Analysis Testing
4.6.1 Validity Testing Using Cross Loadings and Convergent Validity
Cross loadings are useful for assessing whether the construct has adequate discriminant validity, namely by comparing the correlation of the indicators of a construct with other constructs. If the correlation of construct indicators has a higher value than the correlation of these indicators to other constructs, then the construct is said to have a high validity discriminant. From the table it can be concluded that the indicators of each construct give a high convergent validity value above 0.60. Likewise, the cross loading value shows good discriminant validity. According to Chin, 1998 (in Ghozali, 2006) the measurement scale of loading values from 0.5 to 0.6 is considered adequate.
Table 6. The Results of Validity Testing Using Cross Loadings and Convergent Validity Customer Relationship Management Customer Trust Customer Satisfaction Service Quality Customer Loyalty CRM1 0.847 0.370 0.218 0.332 0.420 CRM2 0.811 0.408 0.133 0.276 0.371 CRM3 0.792 0.353 0.240 0.190 0.329 KL1 0.252 0.298 0.185 0.711 0.381 KL2 0.263 0.290 0.093 0.690 0.334 KL3 0.205 0.222 0.149 0.609 0.297 KL4 0.204 0.297 0.082 0.750 0.383 KL5 0.194 0.253 0.098 0.723 0.347 KL6 0.162 0.281 0.232 0.640 0.271 KL7 0.274 0.223 0.143 0.695 0.422 KL8 0.231 0.267 0.178 0.684 0.455 KL9 0.237 0.275 0.261 0.683 0.367 KcN1 0.288 0.658 0.144 0.246 0.267 KcN2 0.332 0.788 0.197 0.310 0.437 KcN3 0.359 0.760 0.216 0.281 0.367 KcN4 0.345 0.774 0.132 0.315 0.412 KcN5 0.389 0.745 0.181 0.296 0.411 KsN1 0.216 0.202 0.902 0.225 0.268 KsN2 0.214 0.217 0.882 0.188 0.233 LN1 0.367 0.418 0.212 0.390 0.832
Customer Relationship Management Customer Trust Customer Satisfaction Service Quality Customer Loyalty LN2 0.405 0.426 0.232 0.469 0.856 LN3 0.401 0.470 0.273 0.496 0.873
Source: Processed Data, 2018
4.6.2 Validity Testing Using Square Root of Average (AVE)
Another method for assessing discriminant validity is the measurement with the Fornell-Larcker method which can be done by comparing the square root of AVE with latent vertical correlation. Discriminant validity is said to be good if the square root of AVE along the diagonal line is greater in correlation between one construct and another. Based on Table 7, it can be seen that the square root value of AVE along the diagonal line has greater correlation between one construct and another, so it can be concluded that the construct has a good level of validity.
Table 7. The Results of Validity Testing Using Square Root of Average (AVE) Customer Relationship Managemen Customer Trust Customer Satisfaction Service Quality Customer Loyalty Customer Relationship Management 0.817 Customer Trust 0.461 0.746 Customer Satisfaction 0.241 0.234 0.892 Service Quality 0.329 0.389 0.232 0.688 Customer Loyalty 0.459 0.514 0.281 0.532 0.854
Source: Processed Data, 2018 4.6.3 Reliability Testing
Reliability testing is done by looking at the value of cronbach's alpha and the composite reliability of the indicator block that measures the construct. Table 8 shows that the cronbach's alpha value and composite reliability for all constructs are above 0.7 which indicates that all constructs in the estimated model meet the criteria (reliable).
Table 8. The Results of Reliability Testing
Cronbach's Alpha Composite Reliability
Customer Relationship Management 0.750 0.857
Customer Trust 0.801 0.862
Customer Satisfaction 0.743 0.886
Service Quality 0.861 0.890
Customer Loyalty 0.815 0.890
Source: Processed Data, 2018 4.6.4 Structural Model
Table 9. Structural Model
R Square R Square Adjusted
Customer Trust 0.276 0.273
Customer Satisfaction 0.094 0.087
Customer Loyalty 0.436 0.431
Source: Processed Data, 2018
After the model has been estimated and has met the criteria of the outer model, the next structural model (inner model) was tested. From Table 9, the following results were obtained:
Customer trust. The coefficient of determination (adjusted R Square) was 0.273. This means that 27.3% of customer trust variable is influenced by service quality and CRM.
Customer satisfaction. The coefficient of determination (adjusted R Square) was 0.87. This means that 8.7% of customer satisfaction variable is influenced by service quality, CRM and customer trust.
Customer loyalty. The coefficient of determination (adjusted R Square) was 0.431. This means that 43.1% of customer loyalty is influenced by service quality, CRM, customer trust and customer satisfaction.
4.6.5 Hypothesis Testing Original Sample (O) Sample Mean (M) Standard Deviation (STDEV) T Statistics (|O/STDEV|) P Valu es
Service Quality -> Customer Trust 0.267 0.270 0.048 5.502 0.000
Service Quality -> Customer
Satisfaction 0.141 0.134 0.056 2.523 0.012
Service Quality -> Customer Loyalty 0.340 0.339 0.045 7.559 0.000
Customer Relationship Management ->
Customer Trust 0.374 0.373 0.044 8.465 0.000
Customer Relationship Management ->
Customer Satisfaction 0.142 0.145 0.061 2.330 0.020
Customer Relationship Management ->
Customer Loyalty 0.202 0.205 0.041 4.865 0.000
Customer Trust -> Customer Loyalty 0.267 0.268 0.048 5.608 0.000
Customer Trust -> Customer
Satisfaction 0.114 0.114 0.058 1.964 0.050
Customer Satisfaction -> Customer
Loyalty 0.091 0.092 0.039 2.322 0.021
a. Service Quality-> Customer Trust
The obtained path coefficient value was 0.267 with t statistic of 5.502 and P value of 0.000. These results indicated that the t-statistics (5.502) was greater than t table (1.960) or P value (0.000) was smaller than 0.05, so it is concluded that service quality has a significant influence on customer trust. The obtained positive coefficient value also indicates that if the service quality given is better, the customer trust will be higher and vice versa.
b. Service Quality -> Customer Satisfaction
The obtained path coefficient value was 0.141 with t statistic of 2.523 and P value of 0.012. These results indicated that the t-statistics (2.523) was greater than t table (1.960) or P value (0.012) was smaller than 0.05, so it is concluded that service quality has a significant influence on customer satisfaction. The coefficient value is also positive, which means that the better the service quality is, the higher the customer satisfaction will be and vice versa.
c. Service Quality -> Customer Loyalty
The obtained path coefficient value was 0.340 with t statistic of 7.559 and P value of 0.000. These results indicated that the t-statistics (7.559) was greater than t table (1.960) or P value (0.000) was smaller than 0.05, so it is concluded that service quality has a significant influence on customer loyalty. The coefficient value is also positive, which means that if the service quality is better, the customer loyalty will be higher and vice versa.
d. CRM -> Customer Trust
The obtained path coefficient value was 0.374 with t statistic of 8.465 and P value of 0.000. These results indicated that the t-statistics (8.465) was greater than t table (1.960) or P value (0.000) was smaller than 0.05, so it is concluded that CRM has a significant influence on customer trust. The obtained positive coefficient value also indicates that the better CRM is applied, the higher the customer trust will be obtained and vice versa. e. CRM -> Customer Satisfaction
The obtained path coefficient value was 0.142 with t statistic of 2.330 and P value of 0.020. These results indicated that the t-statistics (2.330) was greater than t table (1.960) or P value (0.020) was smaller than 0.05, so it is concluded that CRM has a significant influence on customer satisfaction. The obtained positive coefficient value also indicates that if CRM is applied better, the higher customer satisfaction will be gained and vice versa.
f. CRM -> Customer Loyalty
The obtained path coefficient value was 0.202 with t statistic of 4.865 and P value of 0.000. These results indicated that the t-statistics (4.865) was greater than t table (1.960) or P value (0.000) was smaller than 0.05, so it is concluded that CRM has a significant influence on customer loyalty. The positive coefficient value was also obtained, meaning that if CRM is better, the customer loyalty will be higher and vice versa.
g. Customer Trust -> Customer Loyalty
The obtained path coefficient value was 0.267 with t statistic of 5.608 and P value of 0.000. These results indicated that the t-statistics (5.608) was greater than t table (1.960) or P value (0.000) was smaller than 0.05, so it is concluded that customer trust has a significant influence on customer loyalty. The positive coefficient value was also obtained, meaning that the better the customer trust is, the higher the customer loyalty will be and vice versa.
h. Customer Trust -> Customer Satisfaction
The obtained path coefficient value was 0.114 with t statistic of 1.964 and P value of 0.050. These results indicated that the t-statistics (1.964) was greater than t table (1.960) or P value (0.050) equalled to 0,05, so it is concluded that customer trust has a significant influence on customer satisfaction. The obtained positive coefficient value also indicates that the better the customer trust is, the higher the customer satisfaction will be and vice versa.
i. Customer Satisfaction -> Customer Loyalty
The obtained path coefficient value was 0.091 with t statistic of 2.322 and P value of 0.021. These results indicated that the t-statistics (2.322) was greater than t table (1.960) or P value (0.021) was smaller than 0.05, so it is concluded that customer satisfaction has a significant influence on customer loyalty. The coefficient was also positive, and this means that if the customer satisfaction is better, the customer loyalty will be higher and vice versa.
5.Conclusions and Suggestions
5.1 Conclusions
From the results of the study, several conclusions are drawn:
Service Quality has a significant influence on Customer Trust. This means that if the services provided by Islamic Banking in Pekanbaru City are better, the customer trust will be even higher.
Service Quality has a significant influence on Customer Satisfaction. This means that the better services provided by Islamic Banking in Pekanbaru city will result in more satisfied customers.
Service Quality has a significant influence on Customer Loyalty. This shows that the better services perceived by customers will make them feel more loyal to Islamic Banking in Pekanbaru City.
CRM has a significant influence on Customer Trust. This implies that if customers perceive better Customer Relationship Management, they will create a sense of higher trust in Islamic Banking in Pekanbaru City. CRM has a significant influence on Customer Satisfaction. This means that if better Customer Relationship
Management is given, the customers will be more satisfied in Islamic Banking in Pekanbaru City.
CRM has a significant influence on Customer Loyalty. This means that if the Customer Relationship Management given is better, the customers will feel more loyal to Islamic Banking in Pekanbaru City. Customer Trust has a significant influence on Customer Loyalty. This suggests that if the customers have high
trust in Islamic Banking, they will be more loyal to Islamic Banking in Pekanbaru City.
Customer Trust has a significant influence on Customer Satisfaction. This suggests that if the customers have high trust in Islamic Banking, they will get more satisfaction in Islamic Banking in Pekanbaru City.
Customer Satisfaction has a significant influence on Customer Loyalty. This means that the more satisfied the customers are towards the services provided, the more loyal the customers will be to Islamic Banking in Pekanbaru City.
5.2 Suggestions
Based on the conclusions, some suggestions are addressed to Bank BNI Syariah of Pekanbaru Branch and to future researchers as follows:
In providing services to customers, the company is advised to pay attention to the factors of Service Quality dimension which consist of interaction quality, physical environment quality, and outcome quality, and continue to maintain good relationship with customers. This is particularly the case with the waiting time that should be more effective and the availability of more ATMs as well as parking areas that can be adjusted according to customer needs.
It is recommended that the company should maintain and even improve the CRM that has been applied. Such improvement can be in the form of maintenance and addition of more ATM machines and maintenance of good relationship between Bank BNI Syariah and its customers in Pekanbaru. In particular, the company can increase the service value by studying the characteristics of the customers or by rewarding the customers who have used Islamic Banking services for long period in Pekanbaru City so that they will become loyal to the Bank. The company should keep customers feel satisfied by establishing and maintaining good relationships and
communication with them such as showing respect, understanding their needs, using language that is understood by the customers' point of view, so that customers always feel satisfied with the services.
It is suggested that the company keeps the loyalty of customers. One of the efforts is when having a new product, the Bank can promote the product well to the customers, so they understand the product and are willing to try the product and other product offers.
For further research, researchers can apply the knowledge gained in this study and add some more variables in addition to those used this study in order to maximize the results of research related to Service Quality and Customer Relationship Management, Customer Trust, Customer Satisfaction and Customer Loyalty in Islamic
Banking in Pekanbaru City.
References
Arikunto., dan Suharsimi., 2002, Prosedur Penelitian Suatu Pendekatan Praktek, Rineka Cipta, Jakarta
Astono, 2017. Pengaruh Kualitas Layanan, Nilai Nasabah Dan Kepuasan Nasabah Terhadap Loyalitas Nasabah Tabungan Berlian Pd. Bpr Bank Daerah Pati, Jurnal Bingkai Manajemen STIE Dharmaputra Semarang.
Ghozali, I. (2009). Ekonometrika: Teori, Konsep, dan Aplikasi dengan SPSS 17. Semarang: Badan Penerbit Universitas Diponegoro untuk Strategi dan Penelitian Pemasaran”. Jakarta: Kencana.
Hidayat, Rachmad. 2006. “Pengaruh Kualitas Layanan, Kualitas Produk dan Nilai Nasabah Terhadap Kepuasan Nasabah dan Loyalitas Nasabah Tabungan Bank Mandiri di JawaTimur” . Disertasi. Program studi Ilmu Ekonomi Pasca Sarjana Universitas Airlangga Jawa Timur.
Kotler, Philip., 2002. Marketing Management: The Millenium Edition, Jilid I, Jakarta : Prenhallindo. Kotler, Philip. Keller, Kevin Lane., 2007, Manajemen Pemasaran, Edisi 12, Indeks, Jakarta
Sekaran. 2006. Metodologi Penelitian Untuk Bisnis, Edisi Keempat. Jakarta: Penerbit Salemba Empat Sugiyono, 2004. Metode penelitian Kwalitatif, dan R&D, Alfabet Jakarta.