Purdue University
Purdue e-Pubs
International High Performance Buildings
Conference
School of Mechanical Engineering
July 2018
An Efficient Method for Learning Personalized
Thermal Preference Profiles in Office Spaces
Seungjae Lee
School of Civil Engineering, Purdue University, United States of America; Center for High Performance Buildings, Ray W. Herrick Laboratories, Purdue University, United States of America, [email protected]
Panagiota Karava
School of Civil Engineering, Purdue University, United States of America; Center for High Performance Buildings, Ray W. Herrick Laboratories, Purdue University, United States of America, [email protected]
Athanasios Tzempelikos
School of Civil Engineering, Purdue University, United States of America; Center for High Performance Buildings, Ray W. Herrick Laboratories, Purdue University, United States of America, [email protected]
Ilias Bilionis
School of Mechanical Engineering, Purdue University, United States of America, [email protected]
Follow this and additional works at:
https://docs.lib.purdue.edu/ihpbc
This document has been made available through Purdue e-Pubs, a service of the Purdue University Libraries. Please contact [email protected] for additional information.
Complete proceedings may be acquired in print and on CD-ROM directly from the Ray W. Herrick Laboratories athttps://engineering.purdue.edu/ Herrick/Events/orderlit.html
Lee, Seungjae; Karava, Panagiota; Tzempelikos, Athanasios; and Bilionis, Ilias, "An Efficient Method for Learning Personalized Thermal Preference Profiles in Office Spaces" (2018).International High Performance Buildings Conference.Paper 326. https://docs.lib.purdue.edu/ihpbc/326
3677, Page 1
An Efficient Method for Learning Personalized Thermal Preference Profiles in Office
Spaces
Seungjae LEE
1,2, Panagiota KARAVA
1,2*,
Athanasios TZEMPELIKOS
1,2, Ilias BILIONIS
3 1School of Civil Engineering, Purdue University,
West Lafayette, IN, USA
2
Center for High Performance Buildings, Ray W. Herrick Laboratories, Purdue University,
West Lafayette, IN, USA
3
School of Mechanical Engineering, Purdue University,
West Lafayette, IN, USA
Contact Information
(
[email protected]
,
[email protected]
,
[email protected]
,
[email protected]
)
* Corresponding Author
ABSTRACT
The objective of this work is to develop and demonstrate an efficient Bayesian inference algorithm to learn individual occupants’ thermal preferences in office buildings. We present an experimental study to collect data representative of thermal comfort delivery conditions for which the algorithm would be implemented in actual buildings. Subsequently, we demonstrate the efficiency of our algorithm by showing the evolution of personalized thermal preference profiles as the training data size increases and by evaluating profiles inferred with limited data. The results show more reliable personal profiles with our approach when the training data are limited compared to typical learning approaches, training a model from scratch with maximum likelihood estimation.
1. INTRODUCTION
Thermal comfort delivery systems that incorporate building occupants in sensing and control frameworks, and tuning based on their preferences have the potential to increase occupant satisfaction and reduce energy use (Erickson & Cerpa 2012; Feldmeier & Paradiso 2010; Gao & Keshav 2013a, 2013b; Jazizadeh et al. 2014; Kim, Schiavon, et al. 2018; Murakami et al. 2007). In these systems, learning is associated with adapting (estimating) parameters in a model (or a control logic) using feedback from individual occupants and sensor data. This process requires data with sufficient quality and quantity. For example, personalized profiles developed in previous research required 50-90 data points (Daum et al. 2011; Kim, Zhou, et al. 2018; Li et al. 2017) from each individual occupant. However, it is difficult to collect enough data from individual occupants in real buildings (Daum et al. 2011; Rana et al. 2013; Sanguinetti et al. 2017). Therefore, efficiency of learning in terms of required quantity/quality of data should be considered. The goal of this study is to develop smart environmental control systems for office buildings that incorporate occupants’ thermal preferences. Towards this goal, we have developed an efficient Bayesian inference algorithm to learn individual occupants’ thermal preferences in office buildings (Lee et al. 2017, 2018). In this paper, we present an experimental study designed to collect data representative of thermal comfort delivery conditions in typical office buildings. With the data from real occupants, we demonstrate the efficiency of our revised algorithm for learning personalized thermal preferences.
3677, Page 2
2. LEARNING APPROACH
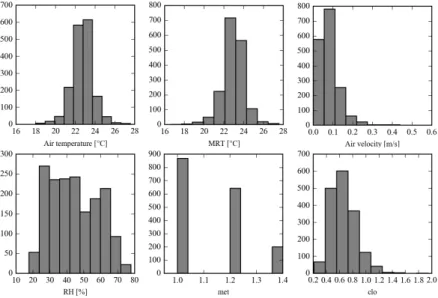
Our approach combines two subproblems to solve the learning problem: classification of people and inference of new occupants’ class, instead of developing different thermal preference models for individual occupants from scratch. This approach is based on the following steps: (i) using a large dataset to represent the thermal preferences and conditions in typical office buildings; (ii) developing a generalized model to explain the thermal preferences of occupants and to classify occupants in a typical office building population based on their “hidden” thermal preference characteristic; (iii) using the generalized model to infer the personalized thermal preference profiles using data collected from individual occupants in office spaces. To develop the generalized model, we use a subset of the ASHRAE RP-884 database (de Dear et al. 1997) that includes 1712 observations collected in different air conditioned office buildings in North America from 259 occupants (Figure 1).
Figure 1: Data distributions of input variables in the training dataset from ASHRAE RP-884 database
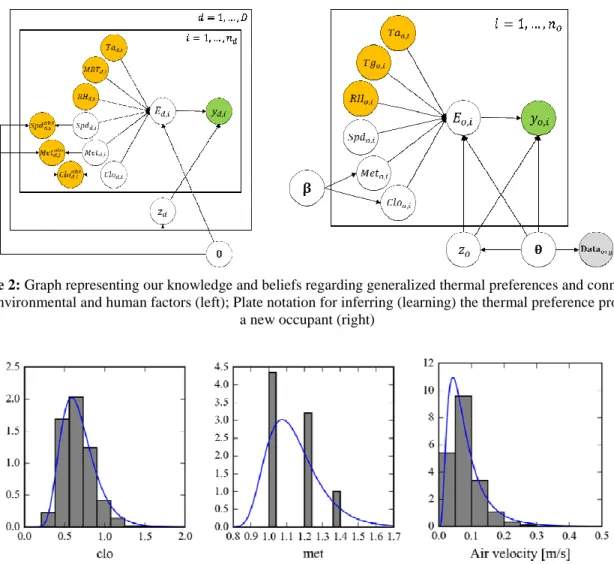
Figure 2 (left) illustrates the connections between thermal preference and related factors i.e., environmental, human, and hidden features. It is also a graphical representation of the joint probability for the generalized model, which is based on conditional probabilistic relationships between variables in the model. Colored and white nodes in Figure 2 correspond to observed and latent variables respectively. y is the occupant thermal preference (i.e., “want warmer”, “no change”, and “want cooler”) of each occupant, E is the overall thermal stress. We consider the six input variables (x) affecting thermal stress according to Fanger’s model (Fanger 1970): air temperature (Tair), mean radiant temperature (MRT), relative humidity (RH), air speed (Spd), metabolic rate (Met) and clothing insulation level (Clo). z is the thermal preference characteristic of each individual occupant and θ collects all the model parameters. To consider the measurement noise (Carroll et al. 2006; Muff 2016) for air speed, metabolic rate and clothing insulation level in the training dataset, we encode our hypothesis: “the true values for these three variables (Spd, Met, and Clo) are uncertain”, in the generalized model. In Figure 2 (left), the three colored nodes, Spdobs,
Metobs, and Cloobs, indicate recorded values for the air speed, metabolic rate and clothing insulation level in the training data, and the three white nodes, Spd, Met, and Clo, represent the corresponding true values of which we are uncertain. With regards to prior knowledge, the model also encodes that the true hidden variables follow the three lognormal distributions of the observed variables to some extent (Figure 3). With this model, we identify the number of possible clusters of people K with similar preference characteristics z and we predict the probability of thermal preferences for a given set of environmental conditions using different sub-models for the clusters. The method was presented in Lee et al. (2017, 2018).
3677, Page 3
Figure 2: Graph representing our knowledge and beliefs regarding generalized thermal preferences and connection
with environmental and human factors (left); Plate notation for inferring (learning) the thermal preference profile of a new occupant (right)
Figure 3: Data distributions of three variables (histograms) and probability density functions used to represent the
data distributions (blue curves) for clothing insulation, metabolic rate and air speed
Personalized profiles for new occupants are subsequently inferred using a mixture of sub-models. In learning thermal preference profiles of new occupants in real buildings, there are three variables difficult to measure: local air speed, metabolic rate, and clothing insulation level. Although such data may not be available for a new occupant, we can use the generalized model to learn new occupants by considering the local air speed, metabolic rate, and clothing insulation level as hidden variables and assigning a probability distribution for the unobserved variables (Figure 2 (right)). Since the probability distribution affects the inference of latent variables and predictions, it should be carefully chosen based on knowledge of the variables. We assume the following for the three variables: (i) one’s metabolic rate follows a truncated Gaussian distribution of which mean and variance are hidden; (ii) there is a linear relationship between air temperature and clothing level reflecting occupants’ behavioral adaptation; (iii) air velocity follows the distribution in Figure 3.
Training the generalized model and inferring personalized profiles refer to inferring the posterior probability of the latent variables (model parameters and hidden variables) in Figure 2. However, since the posterior distribution is intractable analytically, an approximation method is needed. Sampling methods, such as Markov Chain Monte Carlo (MCMC), are widely used since they are flexible; however, they are computationally expensive, especially for high-dimensional problems. To overcome these issues we use Automatic Differentiation Variational Inference (ADVI, Kucukelbir et al. 2017). The PyMC3 Python package (Salvatier et al. 2016) was used for ADVI with Adam (Kingma & Ba 2014) as the stochastic gradient descent algorithm. We have also implemented random initialization with 100 initial points in the model training to get closer to the global solution of the variational inference problem (Sadeghi et al. 2018).
3677, Page 4
3. EXPERIMENTAL STUDY
To demonstrate the validity of our learning method, we designed and conducted an experimental study using three identical perimeter south-facing private offices (3.3m × 3.7m × 3.2m high) in the first floor of Herrick Building at Purdue University on October and November 2017. The offices (Figure 4) have one exterior curtain wall façade with 54% window-to-wall ratio, and a high-performance glazing unit with a selective low-emissivity coating (visible transmittance: 70%, solar transmittance: 33%). The offices are equipped with VAV systems, motorized roller shades and dimmable electric lights. A commercial BMS is available in the building that allows us to monitor, control and automate all building systems. In this study, we fixed the dimming level of the electric lights at 100 % and the shade position at 25 % to eliminate the potential impact of changing the visual environment on the thermal preference of test-subjects.
Each office was occupied by one participant every day between 9:00 am and 4:00 pm. For this study, we recruited three participants who were students and staff (between 20 and 40 years old) not familiar with this research. Each occupant participated for eight days and experienced all the schedules in the Table 1. All the subjects reported their thermal preference at 09:55 AM, 10:55 AM, 11:55 PM, 1:55 PM, 2:55 PM, and 3:55 PM each day. To ensure thermal adaptation with each condition, they were not allowed to leave the rooms for 30 minutes before each survey. They could leave the room shortly except this time and they had a 1-hour lunch break at 12:00 - 1:00 PM. The study was approved by the Institutional Review Board (IRB Protocol #: 1503015873).
Figure 4: Exterior view of the four offices used for data collection and monitoring instrumentation Table 1: Air temperature setpoint schedules (unit: °C)
Schedule # 9:00 AM ~ 10:00 AM 10:00 AM ~ 11:00 AM 11:00 AM ~ 12:00 PM 01:00 PM ~ 02:00 PM 02:00 PM ~ 03:00 PM 03:00 PM ~ 04:00 PM 1 25 23.5 22 22 23.5 25 2 22 23.5 25 25 23.5 22 3 21 22 23 24 25 26 4 26 25 24 23 22 21 5 23 21.5 20 20 21.5 23 6 20 21.5 23 23 21.5 20 7 19 20 21 22 23 24 8 24 23 22 21 20 19
Air temperature, globe temperature and relative humidity were measured each minute. The air temperature was measured with two shielded T-type thermocouples on the left and right side of the sitting location and the average value was used. The globe temperature and the relative humidity were measured with a black globe temperature sensor (µSMART TB1) and a relative humidity sensor (BA/H205-B4X-Z-CG-WMW) respectively using 5-minute average values. Local air speed and clothing were also recorded but were not used in this study according to our model structure shown in Figure 2 (right).
3677, Page 5
4. RESULTS
4.1 Generalized Thermal Preference Model
Figure 5 shows the probability of an occupant belonging to each cluster, inferred by the generalized model. The uncertainty for the probabilities is visualized with box plots based on 1,000 samples from the variational distribution (approximate posterior distribution). Orange bars are the median value of the probabilities, and the upper and lower whiskers are the associated 95% credible intervals. Four clusters have meaningful probabilities and so the generalized model discovered four clusters (two with high probabilities and the other two with low probabilities) of people with similar thermal preference characteristics.
Figure 5: The probability of each cluster being active
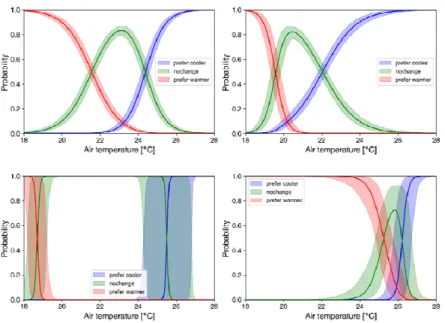
The resulting predictive probability distributions (calculated with sub-models for the four clusters) of occupant thermal preferences (i.e., “want warmer”, “no change”, “want cooler”) are plotted in Figure 6. In order to visualize results in 2-D figures as a function of Tair, the other variables were set as follows: MRT = Tair, Spd = 0.05 m/s, RH = 50 %, Met = 1.2, and Clo = 0.6. Solid lines represent the median values of the probabilities (i.e., median model), and shaded areas represent the associated 95% credible intervals (i.e., 2.5- and 97.5-quantiles of the predictive probability). Note that the variational distribution we used ignores the correlation between model parameters and it can underestimate the model uncertainty.
Figure 6: Predictive probability distributions calculated with sub-models for the four clusters (left column). The
displayed probability distributions were calculated with the following settings: MRT = air temperature, air velocity = 0.05 m/s, relative humidity = 50 %, met = 1.2, and clo = 0.6
3677, Page 6
4.2 Personalized Thermal Preference Profiles
Personalized profiles of the three test-subjects were inferred using the experimental data (Figure 7). We drew 1,000 samples from the approximate posterior for each test-subject and used them to illustrate results. To plot the profiles with respect to air temperature, we set globe temperature = air temperature and relative humidity = 50 %. The personalized models show different profiles by having different sets of cluster values and personal parameters. In Figure 7, solid lines are the average values of the probabilities; darkly shaded areas represent the uncertainty caused by the uncertain parameters; and lightly shaded areas represent the uncertainty caused by the uncertain input variables (i.e., metabolic rate, clothing insulation level, and air speed).
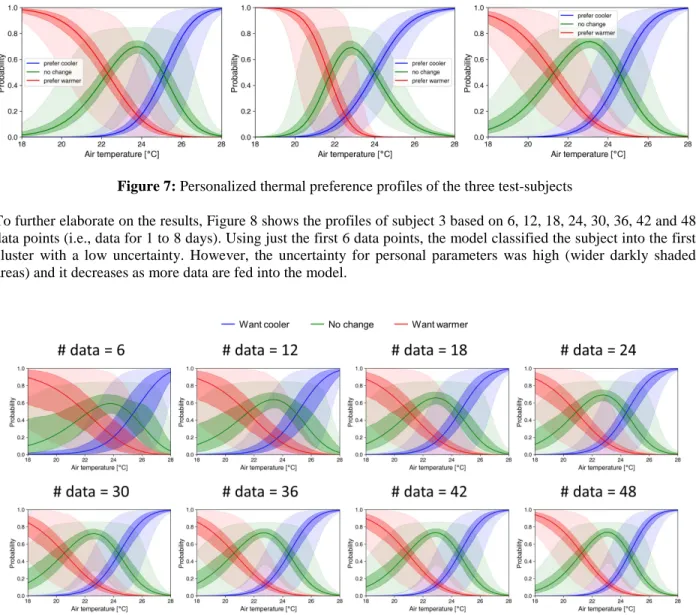
Figure 7: Personalized thermal preference profiles of the three test-subjects
To further elaborate on the results, Figure 8 shows the profiles of subject 3 based on 6, 12, 18, 24, 30, 36, 42 and 48 data points (i.e., data for 1 to 8 days). Using just the first 6 data points, the model classified the subject into the first cluster with a low uncertainty. However, the uncertainty for personal parameters was high (wider darkly shaded areas) and it decreases as more data are fed into the model.
Figure 8: Thermal preference profile of subject 3 as a function of used data points (6-48)
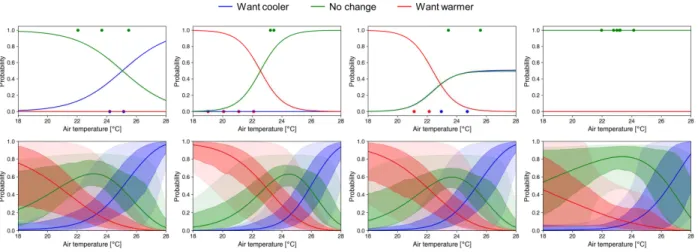
When available data are limited, it is important to understand the differences in prediction performance between our approach and typical approaches used in previous studies. Thus, we compare our model predictions with those obtained using a univariate multinomial logistic regression model, which has the air temperature as the input variable, and it is trained with the maximum likelihood estimation (MLE) method. We take as an example the preference profile of Figure 8 which is now plotted in Figure 9 using 6 data points from 4 different days, using the air temperature logistic regression model (top row) and with our model (bottom row). Actual data points collected
3677, Page 7
are shown with dots, while red, green and blue colors represent “prefer warmer”, “no change”, and “prefer cooler”, respectively. Green dots are displayed on the top of each plot (and the rest on the bottom) to clearly identify this data.The profiles of the logistic regression model are totally different from each other if only 6 data points are used each time. These results show that the air temperature logistic regression MLE model cannot train reliable models with limited number of data. Our model predictions with limited data (6 data points) show there are significant similarities with the profiles shown in Figure 8 with 48 data points, thanks to information from the generalized model and our prior for the personal parameters: (i) the air temperature that maximizes the probability of “no change” is around 23-24 °C; and (ii) the probability of “prefer cooler” increases as air temperature increases and vice versa.
Figure 9: Personalized profiles developed based on MLE method (top row) and current model (bottom row) using
four different sets of 6 data points
5. SUMMARY AND CONCLUSIONS
Towards realization of preference-based control systems, this study contributes to understanding the importance of data efficiency using a Bayesian approach. In this paper, we developed learning algorithms that are transferable to engineering practice and require as inputs data that can be collected in real buildings considering practicality issues and cost. We presented an experimental study to demonstrate the efficiency of our Bayesian inference algorithm for developing personalized thermal preference profiles. The results show our approach is able to estimate reliable preference profiles and cluster values using limited data points while the simpler air temperature logistic regression MLE model cannot train reliable models with the same data.
ACKNOWLEDGEMENT
This work was funded by the National Science Foundation under Grant No. 1539527 and supported by the Center of High Performance Buildings at Purdue University. Any opinions, findings, and conclusions or recommendations expressed in this material are those of the authors and do not necessarily reflect the views of the National Science Foundation.
REFERENCES
Carroll, R. J., Ruppert, D., Crainiceanu, C. M., & Stefanski, L. A. (2006). Measurement error in nonlinear models: a modern perspective: Chapman and Hall/CRC.
Daum, D., Haldi, F., & Morel, N. (2011). A personalized measure of thermal comfort for building controls. Building and Environment, 46(1), 3-11.
de Dear, R. J., Brager, G., & Cooper, D. (1997). Developing an Adaptive Model of Thermal Comfort and Preference, ASHRAE
3677, Page 8
Erickson, V. L., & Cerpa, A. E. (2012). Thermovote: participatory sensing for efficient building hvac conditioning. Proceedings of the Fourth ACMWorkshop on Embedded Sensing Systems for Energy-Efficiency in Buildings (BuildSys'12), New York, NY, USA, 9-16.Fanger, P. O. (1970). Thermal comfort-analysis and applications in environmental engineering: Danish Technical Press, Copenhagen.
Feldmeier, M., & Paradiso, J. A. (2010). Personalized HVAC control system. Internet of Things (IOT) 2010, 1-8. Gao, P. X., & Keshav, S. (2013a). Optimal Personal Comfort Management Using SPOT+. Proceedings of the 5th ACM Workshop on Embedded Systems For Energy-Efficient Buildings (BuildSys’13), New York, NY, USA, 1-8. Gao, P. X., & Keshav, S. (2013b). SPOT: a smart personalized office thermal control system. Proceedings of the Fourth International Conference on Future Energy Systems (e-Energy ’13), New York, NY, USA, 237-246. Jazizadeh, F., Ghahramani, A., Becerik-Gerber, B., Kichkaylo, T., & Orosz, M. (2014). User-led decentralized thermal comfort driven HVAC operations for improved efficiency in office buildings. Energy and Buildings, 70, 398-410.
Kim, J., Schiavon, S., & Brager, G. (2018). Personal comfort models – A new paradigm in thermal comfort for occupant-centric environmental control. Building and Environment, 132, 114-124.
Kim, J., Zhou, Y., Schiavon, S., Raftery, P., & Brager, G. (2018). Personal comfort models: Predicting individuals' thermal preference using occupant heating and cooling behavior and machine learning. Building and Environment, 129, 96-106.
Kingma, D., & Ba, J. (2014). Adam: A method for stochastic optimization. arXiv preprint arXiv:1412.6980. Kucukelbir, A., Tran, D., Ranganath, R., Gelman, A., & Blei, D. M. (2017). Automatic differentiation variational inference. Journal of Machine Learning Research, 18(1), 1-45.
Lee, S., Bilionis, I., Karava, P., & Tzempelikos, A. (2017). A Bayesian approach for probabilistic classification and inference of occupant thermal preferences in office buildings. Building and Environment, 118, 323-343.
Lee, S., Bilionis, I., Karava, P., & Tzempelikos, A. (2018). Inference of Thermal Preference Profiles for Personalized Thermal Environments. 2018 ASHRAE Winter Conference, Chicago, Illinois.
Li, D., Menassa, C. C., & Kamat, V. R. (2017). Personalized human comfort in indoor building environments under diverse conditioning modes. Building and Environment, 126, 304-317.
Muff, S. (2016). Errors and uncertainty in variables – When to worry and when to Bayes? "Errors in variables", Workshop of the working group Bayes Methodsof the International Biometric Society, German Region, Mainz. Murakami, Y., Terano, M., Mizutani, K., Harada, M., & Kuno, S. (2007). Field experiments on energy consumption and thermal comfort in the office environment controlled by occupants’ requirements from PC terminal. Building and Environment, 42(12), 4022-4027.
Rana, R., Kusy, B., Jurdak, R., Wall, J., & Hu, W. (2013). Feasibility analysis of using humidex as an indoor thermal comfort predictor. Energy and Buildings, 64, 17-25.
Sadeghi, S. A., Lee, S., Karava, P., Bilionis, I., & Tzempelikos, A. (2018). Bayesian classification and inference of occupant visual preferences in daylit perimeter private offices. Energy and Buildings, 166, 505-524.
Salvatier, J., Wiecki, T. V., & Fonnesbeck, C. (2016). Probabilistic programming in Python using PyMC3. PeerJ Computer Science, 2, e55.
Sanguinetti, A., Pritoni, M., Salmon, K., Meier, A., & Morejohn, J. (2017). Upscaling participatory thermal sensing: Lessons from an interdisciplinary case study at University of California for improving campus efficiency and comfort. Energy Research & Social Science, 32, 44-54.