econ
stor
www.econstor.eu Der Open-Access-Publikationsserver der ZBW – Leibniz-Informationszentrum Wirtschaft The Open Access Publication Server of the ZBW – Leibniz Information Centre for EconomicsNutzungsbedingungen:
Die ZBW räumt Ihnen als Nutzerin/Nutzer das unentgeltliche, räumlich unbeschränkte und zeitlich auf die Dauer des Schutzrechts beschränkte einfache Recht ein, das ausgewählte Werk im Rahmen der unter
→ http://www.econstor.eu/dspace/Nutzungsbedingungen nachzulesenden vollständigen Nutzungsbedingungen zu vervielfältigen, mit denen die Nutzerin/der Nutzer sich durch die erste Nutzung einverstanden erklärt.
Terms of use:
The ZBW grants you, the user, the non-exclusive right to use the selected work free of charge, territorially unrestricted and within the time limit of the term of the property rights according to the terms specified at
→ http://www.econstor.eu/dspace/Nutzungsbedingungen By the first use of the selected work the user agrees and declares to comply with these terms of use.
zbw
Leibniz-Informationszentrum Wirtschaft Leibniz Information Centre for EconomicsWesterheide, Peter
Working Paper
Cointegration of real estate stocks and REITs with
common stocks, bonds and consumer price inflation:
an international comparison
ZEW Discussion Papers, No. 06-57
Provided in cooperation with:
Zentrum für Europäische Wirtschaftsforschung (ZEW)
Suggested citation: Westerheide, Peter (2006) : Cointegration of real estate stocks and REITs with common stocks, bonds and consumer price inflation: an international comparison, ZEW Discussion Papers, No. 06-57, http://hdl.handle.net/10419/24512
Dis cus si on Paper No. 06-057
Cointegration of Real Estate Stocks
and REITs with Common Stocks, Bonds
and Consumer Price Inflation
– an International Comparison –
Dis cus si on Paper No. 06-057
Cointegration of Real Estate Stocks
and REITs with Common Stocks, Bonds
and Consumer Price Inflation
– an International Comparison –
Peter Westerheide
Die Dis cus si on Pape rs die nen einer mög lichst schnel len Ver brei tung von neue ren For schungs arbei ten des ZEW. Die Bei trä ge lie gen in allei ni ger Ver ant wor tung
der Auto ren und stel len nicht not wen di ger wei se die Mei nung des ZEW dar.
Dis cus si on Papers are inten ded to make results of ZEW research prompt ly avai la ble to other eco no mists in order to encou ra ge dis cus si on and sug gesti ons for revi si ons. The aut hors are sole ly
respon si ble for the con tents which do not neces sa ri ly repre sent the opi ni on of the ZEW. Download this ZEW Discussion Paper from our ftp server:
Non-Technical Summary
This paper analyses the performance of real estate securities and their relationship to other asset classes as well as to consumer price inflation in an international compari-son over a 15 year period from 1990 to 2004. In contrast to many existing studies the analysis focuses on the long run relationships, applying three different cointegra-tion tests. The analysis covers the US, Canada, Australia, Japan, the Netherlands, Belgium, France and Germany.
Results show that real estate securities in most countries had a remarkably high per-formance in nominal and real terms. The average perper-formance over the whole period (1990 – 2004) has been particularly high in capital market oriented countries in the sample (US, Australia), and also in France. Real estate securities have outperformed bond markets on a risk adjusted basis only in the US and in Australia, while an out-performance of stock markets can be observed also in Japan and France. Particularly in the period 2001 to 2004 real estate security market have soared in most countries with the notable exception of Germany, where average returns have been negative. In general, real estate securities seem to represent an asset class distinct from bonds and stocks in most countries. In the long run they seem to reflect the performance of direct real estate investments and provide a potential for further diversification of asset portfolios. Additionally, real estate stocks provide a (weak) hedge against con-sumer price inflation in almost every country.
The overall picture indicates furthermore, that the existence of specialised, tax trans-parent vehicles like REITs is not always correlated with high performance of secu-ritised real estate. Although our analysis does – due to data limitations – not investi-gate the relationship between real estate market performance and real estate securi-ties, one might well assume that characteristics of the surrounding markets – i.e. the stock market capitalization relative to the GDP as an indicator of the development stage of the stock markets – might have additional explanatory power.
In light of the international experience, the poor performance of the German real es-tate stock market can potentially be attributed to a couple of problems: Aside from the fundamental problems of the German market real estate market, Germany is the only real estate security market where REITs or similar investment vehicles have not existed until now. Additionally, the capital market capitalisation in relation to GDP is still low in international comparison.
Cointegration of Real Estate Stocks and REITs with Common
Stocks, Bonds and Consumer Price Inflation
- an International Comparison -
∗Peter Westerheide
Centre for European Economic Research (ZEW)
August 2006
This paper analyses the performance of real estate securities and their relationship to other asset classes as well as to consumer price inflation in an international compari-son over the period from 1990 to 2004. The analysis focuses on the long run rela-tionships, applying three different cointegration tests. It covers the US, Canada, Australia, Japan, the Netherlands, Belgium, France and Germany.
Results show that real estate securities in most countries had a high performance in nominal and real terms. The average performance over the whole period (1990 – 2004) has been particularly high in capital market oriented countries in the sample (US, Australia), and also in France. Real estate securities have outperformed bond markets on a risk adjusted basis only in the US and in Australia, while an outper-formance of stock markets can be observed also in Japan and France. Particularly in the period 2001 to 2004 real estate security market have soared in most countries with the notable exception of Germany.
In general, real estate securities seem to represent an asset class distinct from bonds and stocks in most countries. In the long run they seem provide a potential for fur-ther diversification of asset portfolios. Additionally, real estate stocks provide a (weak) hedge against consumer price inflation in almost every country.
Keywords: REITs, Real Estate Securities, Cointegration, Stock Markets, Bond Mar-kets
L 7, 1 Tel.: 0621 / 1235 - 146
P.O. Box 10 34 43 Fax: 0621 / 1235 - 223
D-68034 Mannheim E-mail: westerheide@zew.de
∗
We would like to thank Joachim Moser for helpful comments. All errors remain in the sole re-sponsibility of the author.
1
Introduction
Investment in securitised real estate is frequently considered as an instru-ment for participating in the long run developinstru-ment of the real estate market without suffering from its typical disadvantage – its illiquidity. However, there is an extensive debate on the risk-return characteristics of Real Estate Investment Trust (REITs) and other real estate stocks. The main question is whether real estate security returns primarily reflect real estate market de-velopments and provide a corresponding potential for portfolio diversifica-tion, or whether their returns are dominated by the general stock market or bond market movements. Former studies yield diverging results, depending on the research methodology applied as well as on the country and the time period under consideration.
This paper analyses the performance of real estate securities and their rela-tionship to other asset classes as well as to consumer price inflation in an international comparison over a 15 year period from 1990 to 2004. In con-trast to many existing studies the analysis focuses on long run relationships, applying three different cointegration tests. The analysis covers the US, Canada, Australia, Japan, the Netherlands, Belgium, France and Germany. The real estate security markets in this sample are heterogeneous regarding their experience with highly specialised, exchange traded real estate in-vestment vehicles like REITs or similar tax privileged instruments. Fur-thermore the countries differ with respect to the importance of stock mar-kets for corporate finance and private wealth accumulation. Therefore it is interesting to see whether differences in the performance and relationship with other asset classes coincide with these market characteristics.
The paper’s outline is as follows: After reviewing the existing literature, the second part of the analysis focuses on the performance of REITs and real estate stocks. In the third part short term correlations with the bond and the general stock market are analysed. The fourth part of the paper looks at the long run relationships between REITs and real estate stocks on the one hand and the general stock market and the bond market on the other hand. As an important characteristic of real estate investment, the ability to hedge against consumer price inflation is scrutinised as well. The fifth part sum-marises the main findings.
2
Literature review
Studies on the relationship between real estate stocks, particularly REITs and the common stock market are numerous. Some former studies have also analysed the inflation hedging ability of real estate securities.
How-based on linear regressions of periodical term returns. Cointegration tech-niques have rarely been applied in the past. The majority of studies refer to the US market, particularly to exchange traded US REITs.
Many previous studies find a significant positive correlation between common stocks and real estate stocks. A further common result is that in-flation hedging capabilities of real estate stocks seem to be limited, in con-trast to direct real estate investment, which should provide some inflation protection.
Our review highlights only some of the important studies. For a broader overview we refer the reader to the survey by Zietz, Sirmans, Friday (2003), for the older literature we refer to the review by Gorgel, McIntosh, and Ott (1995).
In an early study on the inflation-hedging characteristics of equity REITs, Murphy and Kleiman (1989) find for the period from 1972 to 1985, that REIT returns do not provide inflation protection.
Myer and Webb (1994) scrutinize the relationship between retail stocks, retail REITs and retail real estate in linear regressions with contemporane-ous and lagged variables and in VAR models during the period from 1983 to 1991. They find a positive contemporaneous correlation among retail stocks and retail REITs, but not among retail real estate and REITs or among retail real estate and retail stocks.
Yobaccio, Rubens and Ketcham (1995) test, with linear regressions, for the inflation hedging characteristics of US REITs during the period from 1972 to 1992 and find that REITs provide some hedging against expected, but not against unexpected inflation. In total inflation hedging capabilities of REITs are therefore poor.
Eichholtz and Hartzell (1996) analyse the relationship between property shares and common stocks in the UK and the US from 1977 to 1993 and in Canada from 1985 to 1993. They find evidence for a strong contemporane-ous relationship between common stocks and real estate stocks, though dif-fering across countries.
Mull and Soenen (1997) analyse the correlations between US REITs, do-mestic stocks, dodo-mestic bonds and dodo-mestic CPI inflation for the time pe-riod from 1985 to 1994 in the G-7 countries. They find a positive correla-tion with stocks, low – mostly negative – correlacorrela-tion with bonds and rather
small, mostly positive correlation with consumer price inflation.1 They conclude that due to the positive correlation with stocks, the diversification potential of US REITs is limited. By comparing a three asset model portfo-lio consisting of domestic bonds, domestic equity and US-REITs with a two asset portfolio without REITs they show that the inclusion of REITs does not improve the Sharpe ratio in most cases. However, these results depend heavily on the time period under consideration.
Okunev and Wilson (1997) test for cointegration of US REITs with the stock market for the period from 1979 to 1993 and find no cointegration when using standard Engle Granger tests. They test a nonlinear model to describe the relationship between REITs and wider stock markets and con-clude that there is evidence for a nonlinear dependency between both mar-kets. The link, however, seems to be very weak and divergences between both market decrease slowly over time, therefore diversification potential remains.
Liu, Hartzell and Hoesli (1997) evaluate inflation hedging properties of property trusts in Australia, France, Japan, South Africa, Switzerland, the UK and the US for the period from 1980 to 1991. They find that property trusts are not a better inflation hedge than common stocks and in some countries returns are like those of common stocks - but even stronger than those – inversely related to inflation. They also apply linear regression techniques like Fama/Schwert (1997) and Solnik (1983). Reverse causation between property return changes and inflation changes – i.e. that property return changes are predictors for inflation rate changes – is also tested and some evidence for this relation is found.
Chatrath and Arjun (1998) test for cointegration of US REITs with infla-tion. They find evidence for cointegration in the period from 1972 to 1995 when using Johansen tests, but no evidence with other cointegration tests. Ling and Naranjo (1999) test for integration of common stocks and real estate stocks in multifactor asset pricing models for the period from 1978 to 1994 in the US. They find evidence for (short term) integration between both markets, based on the hypothesis that risk premia in the returns are identical for both asset classes.
1
Mull and Soenen seem to interpret correlation results for the CPI inflation in a wrong way. They assess negative correlation of REIT returns and inflation as an indicator of
Glascock, Lu and So (2000) analyse cointegration of US-REIT returns with bonds, equities, unsecuritised real estate and consumer prices in the US. They apply Engle-Granger-tests (EG tests) and error-correction models (ECM) for the time period from 1972 to 1996. They find cointegration be-tween stocks and REITs after the 1993 tax reform in the US and cointegra-tion between bonds and REITs in the time period before the reform. They also find evidence for cointegration of REITs with unsecuritised real estate, measured by the NCREIF indices, and with consumer price inflation.
Maurer and Sebastian (2002) analyse inflation hedging characteristics of real estate securities in France, Germany, Switzerland and the UK for the period from 1980 to 2000. They find that only German investment funds provide an inflation hedge, but not real estate stocks in Germany and the other countries. The analysis is based on traditional linear regression tech-niques following Fama/Schwert (1997) and the extension provided by Yo-baccio, Rubens and Ketcham (1995) to test for the correlation between re-turns and expected and unexpected inflation. They also calculate short fall risk measures for real returns of real estate stocks and German real estate funds.
Brounen and Eichholtz (2003) analyse the diversification potential of prop-erty shares for the UK and the US for the period from 1986 to 2002. They find decreasing correlations between the asset classes and calculate that even in a worst case scenario Sharpe optimal portfolios should contain a real estate share of around 10 per cent.
Lizieri, McAllister and Ward (2003) study the convergence of real estate equities in the European monetary union in comparison to the stock mar-kets, applying correlation analysis, principal component analysis, Granger causality tests and VAR analysis. They conclude that commercial real es-tate equities are much less integrated than wider equity markets.
Hamelink and Hoesli (2004) analyse the determinants of real estate security returns in a cross-country analysis on company level for 10 countries dur-ing the period from 1990 to 2003. They find that country-specific effects dominate returns, but also property type, size, value and growth character-istics of the company are important.
Cauchie and Hoesli (2004) test for the integration of Swiss real estate in-vestment funds with stock and bond markets, using asset pricing models for the period from 1986 to 2002. They conclude that these funds are more in-tegrated with the stock market than with bonds.
3
Descriptive characteristics
The analysis covers the US, Canada, Australia, Japan, the Netherlands, Bel-gium, France and Germany. While in all of these countries real estate stocks are traded, not all of them have extended experience with real estate investment trusts (REITs) or similar specialised vehicles for indirect real estate investments. REITs are characterised by their obligation to derive most of their income from real estate business activities (i.e. owning and operating income producing real estate such as apartments, shopping cen-ters, offices, hotels and warehouses). REITs usually do not pay taxes on the company level, but are obliged to distribute nearly all of their income to their shareholders. REITs and similar real estate investment vehicles in other countries are frequently regarded as driving forces for the indirect real estate investment market: On one hand, they provide an opportunity for liquid investments in particular segments (property types, regions) of the real estate market. On the other hand, their regulation usually warrants a high degree of transparency and investor protection.
With respect to their REIT history the countries can be broadly arranged in two groups: While in some countries REITs or similar vehicles have a comparatively long tradition (US, the Netherlands, Australia, Canada), other countries recently introduced REITs (Japan, France). In Germany, the introduction of REITs and their legal design is currently a hot debate (for an overview of the introduction years of REITs in different markets see ta-ble 1). The countries differ also with respect to the type of their financing systems: While both the European countries in the sample and Japan have a bank based financing system, Australia, the US and Canada are known as countries with a more capital-market oriented financing system. Fig. 1 shows a graphical representation of countries ordered according to the market capitalisation of domestic equities in relation to their gross domestic product on one axis, and their experience with REITS or similar instru-ments on the other axis.
Combining both criteria, one can distinguish three groups of countries in a broad classification: Some countries have a long history of specialised real estate stock investment vehicles, traded in mature capital markets (quadrant IV). In other countries specialised real estate stock investment, via REITs or similar instruments, has also been available for a long time, however within an underdeveloped market surrounding (quadrant III). Finally, in the third group of countries, specialised real estate stock investments are avail-able only for a short period of time, and public equity markets are, at the same time, comparatively immature (quadrant I).
Table 1: Introduction of REITs
Country Year of Introduction
US 1960 Netherlands 1969 Australia 1985 Belgium 1990 Canada 1994 Japan 2000 France 2003
Germany Under consideration
Source: EPRA.
Figure 1: Market Characteristics
Source: WFE, Sachverständigenrat, own calculations.
3.1
The Data
The real estate security market is represented by the indices of the NAREIT (the U.S. National Association of Real Estate Investment Trusts) and the EPRA (European Public Real Estate Association). The NAREIT data cover all REITs trading on the New York Stock Exchange, the NASDAQ
Na-40 50 60 70 80 90 100 110 120 130 140 0 10 20 30 40 50
Years since Introduction of REITs (2004)
Tot a l E qui ty M a rk e t C a pi ta li s a ti o n (i n % o f G D P , 2 003) US BG AUS CA FR JP GE IV III I II
tional Market System and the American Stock Exchange. Aside from REITs (or their national pendants, respectively), the EPRA indices include also other listed stocks. EPRA provides not only European indices, but also indices for Australia, Japan, and Canada.
The inclusion of a company in the EPRA indices requires a minimum free float and turnover as well as a minimum share of revenues from relevant real estate activities2(see table 2). Therefore the EPRA indices mainly in-clude large companies and cover only a part of the market. According to EPRA estimates their indices represent on average around 85 per cent of
the total market capitalisation. 3 The EPRA indices are capitalisation
weighted with free float adjustment.
All NAREIT and EPRA indices are calculated as performance indices. For Germany we alternatively apply the DIMAX (Deutscher Immobilienaktien-Index). The DIMAX is a capitalisation but not free float weighted index, calculated on the basis of 45 publicly quoted German real estate companies by the German private bank Ellwanger and Geiger.4 For the inclusion in the DIMAX 75 % of turnover and revenues have to come from real estate ac-tivities.5
2
Real estate activities are defined as the “ownership, trading and development of in-come-producing real estate” (see EPRA (2005), Point 1.5.). Not included are e.g., the construction of residential homes for sale, the provision of construction management, general contracting and project management services, the provision of property man-agement, facilities manman-agement, brokerage and investment management services, holding companies (see EPRA (2005), point 1.6).
3
Telephone interview with Fraser Hughes, Research Director EPRA, on Sept. 28. 2004.
4
As of Dec. 31, 2004. For details see
http://www.privatbank.de/web/home.nsf/VCO/VSIN-59XEBA/$file/Dimaxde.pdf.
5
Real estate activities are defined as rent and lease, real estate management, trading in real estate, project development, and consulting.
Table 2: Requirements for the inclusion in EPRA indices Free float market
capitalisation
Annualised trad-ing volume in a three months
pe-riod
Share of EBITDA6 originating from real estate
activi-ties Australia 200 Mill. US-$ 100 Mill. US-$ 60 %
Belgium 50 Mill. € 25 Mill. € 75 %
France 50 Mill. € 25 Mill. € 75 %
Japan 200 Mill. US-$ 100 Mill. US-$ 60 % Canada 200 Mill. US-$ 100 Mill. US-$ 75 %
Netherlands 50 Mill. € 25 Mill. € 75 %
Germany 50 Mill. € 25 Mill. € 75 %
Source: EPRA.
In terms of bonds we use government bond indices with maturities from 7 to 10 years, calculated by Thomson Financial Datastream. For Germany, the REX (Deutscher Rentenindex), calculated by Deutsche Börse AG, is used instead. All indices are performance indices. As stock market indica-tors MSCI equity performance indices are used for all countries, except Germany, where the DAX 30 performance index, calculated by the Deutsche Börse AG, is used.
All time series consist of month end values for the period 1990 to 2004. The observation period for Canada is the only one that is substantially shorter, as no company fulfils the requirements for the Canadian EPRA in-dex from 1993 to 1996. Therefore the Canadian series start with January 1997.
4
Risk and Return Profiles
A first look into the average annual rate of return reveals that for the whole 15 year period 1990 – 2004 real estate stocks and REITs have performed well in most countries. However, differences between countries are sub-stantial: Real average rates of return, calculated as nominal rates of return minus consumer price inflation, amount to more than 10 per cent each year on average in the US, Canada (from 1997), and Australia. With 9 per cent real rate of return p.a. French real estate has also performed very well. Comparatively low are the long term average profits in the other European
6
Earnings before Interest, Depreciation and Amortization (operatives Geschäftsergeb-nis vor Zinsen, Steuern und Abschreibungen).
markets (Belgium, the Netherlands and Germany). In Germany, marked differences exist between the broad DIMAX index (with only 0.4 % annual real rate of return) and the EPRA index, which only consists of 3 large companies (with 3 per cent p.a.). Japan is a special case, where the burst of the real estate market bubble in 1990 induced a long lasting decline of the whole stock market. Real estate stocks – like the general stock market – had on average a negative nominal and real yield of around 4 per cent p.a. over the whole period.
A look at sub periods shows some further heterogeneity across countries and some interesting tendencies as well: In most of the countries real estate stocks performed poorly in the first half of the nineties, but in the second half of nineties the situation improved remarkably. Exceptions include Australia, where the performance continuously has been extraordinarily high and rather stable, and the US, where the real performance was stable and substantial as well. During the years 2001 to 2004 the performance of real estate stocks improved drastically again in all countries except Ger-many, where the situation deteriorated, and Australia, where performance declined a bit, albeit coming from a high level.
We calculated risk adjusted returns (following Modigliani/Modigliani (1997)) to compare real estate stock performance with the general equity market performance and the bond market performance. RAP is defined as
(1) RAPi =(σm/σi)(ri −rf)+rf. with
σm = standard deviation of benchmark
σi = standard deviation of asset i
ri = return of asset i
rf = risk free rate of return
RAP can be compared directly among investment alternatives, because all portfolios are adjusted by leverage operations to the risk σm of the
bench-mark.
The RAP relative to bonds (i.e. the difference of RAP for real estate stocks, using bonds as the benchmark, to the rate of return on bonds) is positive for the whole period only in the US, Canada and Australia. For different sub
no country with a positive value except Germany, using the EPRA index. Also in the second half of the nineties the bond market performed better in almost every country or at least as good as the real estate market on a risk adjusted basis. During the years 2001 to 2004 real estate stocks usually per-formed better than bonds, except in Japan and Germany.
With respect to the stock market, differences in risk adjusted returns (calcu-lated again against bonds as the benchmark for comparable figures) are higher. This is true particularly for the period from 2001 to 2004 because real estate stocks did not suffer as much from the burst of the technology bubble. In turn, the risk adjusted return in the second half of the nineties and 2000 was usually lower than on the general stock market. Over the whole 15 year period, real estate stocks performed better than general stocks on a risk adjusted basis in the US, Australia, Japan and France.
Table 3: Performance of Real Estate Stocks/REITs
USA CA* AU JP NL BE FR GE ** GE*** Annual Return
1990-2004 13.3% 15.7% -3.9% 5.9% 3.4% 10.8% 2.7% 5.2% 1990-1995 11.0% 15.1% -11.6% -5.7% -4.4% 0.6% -0.4% 13.1% 1996-2000 9.7% 12.8% 17.6% -1.7% 9.2% 6.0% 15.3% 13.2% 4.0% 2001-2004 20.9% 18.1% 13.2% 6.0% 19.3% 13.5% 21.1% -4.9% -4.1%
Real Annual Return
1990-2004 10.4% 13.1% -4.0% 3.4% 1.4% 9.0% 0.4% 3.0% 1990-1995 7.7% 12.0% -12.5% -8.3% -6.9% -1.7% -3.8% 9.7% 1996-2000 7.2% 11.0% 15.5% -1.6% 7.0% 4.3% 14.1% 11.8% 2.6% 2001-2004 18.5% 15.9% 10.4% 6.6% 16.9% 11.6% 19.2% -6.4% -5.5%
RAP Bonds (Diff.)
1990-2004 0.6% 1.4% -4.9% -3.1% -4.9% -1.8% -3.9% -2.8% 1990-1995 -2.2% -1.7% -7.0% -8.6% -7.3% -5.4% -5.7% 1.0% 1996-2000 0.8% -0.6% 1.4% -5.0% -1.6% -3.1% 0.4% -0.1% -3.5% 2001-2004 5.7% 1.9% 4.5% -1.9% 1.3% 1.3% 1.0% -7.8% -5.7%
RAP Equity (Diff.)
1990-2004 1.4% 4.0% 0.8% -0.7% -1.6% 1.4% -1.2% -0.2% 1990-1995 -1.4% 4.1% 0.2% -7.9% -3.1% -1.1% -3.3% 3.3% 1996-2000 -2.6% -1.1% 3.4% 0.7% -2.5% -2.2% -0.5% -1.5% -4.8% 2001-2004 11.9% 7.1% 3.1% 2.0% 8.7% 6.7% 8.0% -1.0% 1.1%
Source: Datastream, EcoWin, EPRA, NAREIT, own calculations. Real annual return = annual return minus CPI-Inflation. RAP Bonds (Diff.) = RAP with benchmark bonds market, difference to annual return on bonds, RAP Equity (Diff.) = RAP with benchmark bonds mar-ket, difference to RAP on equity (calculated with benchmark bond market). * Data only available for 1997 to 2004 **, DIMAX index = real estate stocks, *** EPRA index = real estate stocks.
5
Correlation Analysis
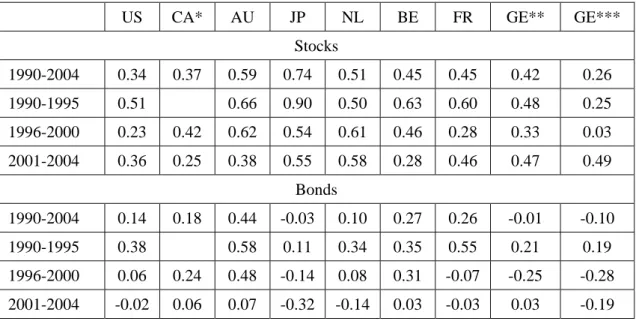
Correlations are measured on the basis of monthly rates of returns for dif-ferent time periods (see table 4). The correlations between the general stock market and real estate stocks are positive and range from 0.26 to 0.74 for the whole period from 1990 to 2004. In the first half of the 1990s the corre-lations have, on average, been higher than later. Particularly high correla-tions can be observed in the Japanese market, which declined most of the time. But also the Netherlands and Australia show substantial positive short term correlation of real estate stocks and general stock markets.
The correlation with the bond market is low or even slightly negative in almost every country. The only exception with a substantial positive corre-lation on average is Australia. Similar to the correcorre-lation with the general stock markets, the correlations with the bond markets tend to decrease in time. In the first half of the 1990s the correlations with the bond market have been higher in every country, except in Germany.
Table 4: Correlation of real estate stocks/REITs with general stocks and bonds
US CA* AU JP NL BE FR GE** GE*** Stocks 1990-2004 0.34 0.37 0.59 0.74 0.51 0.45 0.45 0.42 0.26 1990-1995 0.51 0.66 0.90 0.50 0.63 0.60 0.48 0.25 1996-2000 0.23 0.42 0.62 0.54 0.61 0.46 0.28 0.33 0.03 2001-2004 0.36 0.25 0.38 0.55 0.58 0.28 0.46 0.47 0.49 Bonds 1990-2004 0.14 0.18 0.44 -0.03 0.10 0.27 0.26 -0.01 -0.10 1990-1995 0.38 0.58 0.11 0.34 0.35 0.55 0.21 0.19 1996-2000 0.06 0.24 0.48 -0.14 0.08 0.31 -0.07 -0.25 -0.28 2001-2004 -0.02 0.06 0.07 -0.32 -0.14 0.03 -0.03 0.03 -0.19
Source: Datastream, EcoWin, EPRA, NAREIT, own calculations. * Data only available for 1997 to 2004, ** DIMAX index = real estate stocks, *** EPRA index = real estate stocks.
6
Cointegration Analysis
The potential for portfolio diversification by investment in real estate secu-rities depends not only on their short term correlations, but also on their long run relationships with other asset categories. Long run relationships are particularly important for investors who regard indirect real estate in-vestments as an alternative to direct inin-vestments, which is usually long term oriented. We therefore analyse whether real estate stocks and REITs
are cointegrated with the general stock market and the bond market. Since real estate investment is frequently regarded as an inflation hedge, we also look for cointegration of real estate security indices with consumer price indices.
6.1
Methodological Issues
We test for cointegration by applying three different procedures, going from limited to more general models. In the first step we have carried out Engle Granger tests (EG) for cointegration. In the second step we have es-timated single equation error correction models (ECM) to account for short run dynamics. Finally in the third approach we have applied the Johansen procedure to take endogeneity of all variables in the system into considera-tion.7
For the EG-Tests the linear regression (2) is estimated: (2) REt =α +β*Xt +ε1t
with REt = real estate stock index or REIT index, Xt = stock market index,
bond market index or CPI, ε1t = residual and α, β as estimated constant and
coefficient. Subsequently we have tested with ADF-tests whether the ε1t is
stationary, applying the Akaike criterion to determine the appropriate lag length, and using the MacKinnon (1996) values as critical values.
The ECM-models are specified according to equation 3, assuming weak exogeneity forXt for the cointegration vector:
(3) t t t n i i t n i i t t X RE RE X RE 1 1 2 1 0 ) ( β α ε δ γ + ΦΔ + ΓΔ + − − + = Δ − − = − = −
∑
∑
The symbols have the same meaning as in equation 2, with Φ and Γ as ma-trix of coefficients for the short term dynamics in the model, ε2t = residual
and γ, δ as estimated constant and coefficients. The lag length n of the ECM was determined using the Akaike criterion, for critical values of δ we referred to Ericsson/MacKinnon (2002).
7
proce-The Johansen models are specified as the two-equation system 4 (a, b) (4a) t t t n i i t n i i t t RE X RE X RE 1 1 1 3 1 1 1 1 1 δ ( β α) ε γ + Φ Δ + ΓΔ + − − + = Δ − − = − = −
∑
∑
(4b) t t t n i i t n i i t t RE X RE X X 2 1 1 4 1 2 1 2 2 δ ( β α) ε γ + Φ Δ + Γ Δ + − − + = Δ − − = − = −∑
∑
The symbols have again the same meaning as in equations 2 and 3, the co-efficients now being indexed to assign them to one of the two equations in the system. The lag length of the VAR is again determined by the Akaike criterion.
All series have been tested for unit roots by Augmented Dickey Fuller tests, using different criteria (Schwarz, Akaike and Modified Akaike) for the ap-propriate lag length specification (for details see table 6 a/b in the appen-dix). Usually all series are I(1), except the CPI series in the US, France, the Netherlands and Germany in specifications with the Modified Akaike crite-rion, that recommends very long lag lengths for the unit root tests of these series. These results indicate, that the series could be I(2) as well. Further exceptions are real estate stocks and general stocks in Japan, that are I(0).
6.2
Results
Cointegration between real estate stocks/REITs and the general equity market
Cointegration between the general equity market and real estate securities is unobservable in almost every country (see table 5, for details see tables 7, 9, 10, 12 in the appendix). One exception is Australia, where the EG tests indicate an equilibrium relationship between the general stock market and real estate stocks. However, in the ECM specification, the adjustment coefficient of the error correction term is insignificant. Cointegration is in-dicated in the Johansen specification as well, but the adjustment coefficient for the first equation is not significant and has the wrong (positive) sign. This implies that an equilibrium relationship exists, but the general stock market adjusts to the real estate stock market instead of the reverse.
In Japan EG results indicate stationarity of the residuals for the regression of the general stock indicator on the real estate stocks as well. However, due to the Japanese recession in the 1990s both indicators are stationary in levels; therefore stationarity of residuals does not really prove cointegra-tion. Consequently the ECM model shows an insignificant adjustment
coef-ficient for the error correction term. The Johansen results indicate two coin-tegrating equations and the sign of the coefficient in the cointegration vec-tor is positive, indicating that both indicavec-tors are diverging in time. In the Netherlands, where the Johansen test statistics indicate cointegration, the coefficient in the cointegration vector as well as the adjustment coefficients are signed incorrectly.
Cointegration between real estate stocks/REITs and the bond market
Evidence is mixed concerning cointegration with bonds. The US and Aus-tralia show no indication of cointegration between real estate stocks and bonds in all three procedures (see table 5, for details see tables 7, 9, 10, 12 in the appendix). For Japan, cointegration of real estate stocks with bonds is indicated in all three procedures. However, the results are misleading due to the different orders of integration of the time series. The bonds market performance indicator has been rising steadily over time and is I(1), while the real estate stock performance indicator was stationary in levels. There-fore the Johansen results show two cointegrating vectors, and the coeffi-cient of the bond market indicator in the error correction term has a positive sign.
In Canada, where the observation period is substantially shorter, ECM and EG results weakly indicate cointegration between real estate securities and bonds. For the European countries few results point to cointegration be-tween bonds and real estate. In Belgium and the Netherlands only Johansen results are significant but indicate two cointegrating vectors. EG and ECM results are not significant on a satisfying level, however, in both cases the test statistics (the ADF-Test and the t-test for the adjustment coefficient of the error correction term) point at least weakly to cointegration. In France Johansen results indicate cointegration between bonds and real estate stocks on at least the 20 per cent significance level. In Germany only the ECM results for the model with the EPRA index weakly point to cointegra-tion of real estate stocks with the bond market. Johansen and EG results show no evidence of cointegration.
It would be interesting to analyse to what extent these cross country differ-ences in the relationship between real estate stocks and bond markets de-pend on the average gearing of real estate companies. Unfortunately aver-age figures over the whole period of time are not available, and available data for single years (see UBS (2004)) does not show any congruence be-tween the cointegration pattern with the bond markets and the average gearing of real estate companies.
Cointegration between real estate stocks/REITs and the CPI
The tests for cointegration of real estate securities with the CPI do not yield significant results in every country (see table 5, for details see tables 7, 9, 10, 12 in the appendix). However, in most countries at least some weak evidence exists for long run equilibria between the development of con-sumer price indices and real estate stock/REIT indices.
Significant cointegration on usual levels is not at all observed in Germany and Australia. In Germany the CPI is I(0) with a significant drift term, ac-cording to unit root tests based on the Schwarz and Akaike criterion, but I(2) according to the Modified Akaike criterion. The evidence from the Johansen tests is not clear (the adjustment coefficient is incorrectly signed), but EG results point to weak cointegration in the specification with the DIMAX index. In Australia significant cointegration is also not indicated, but the results of EG and ECM point at least weakly to the existence of long run equilibria between both series. In every other country at least one test shows significant cointegration between the consumer price level and the development of real estate stocks.
In the US the ECM indicates cointegration only on the – usually not ap-plied – 20 per cent level, but the Johansen results show significant cointe-gration on the 5 per cent level. However, the results may be influenced by CPI time series characteristics. The Akaike and the Modified Akaike crite-rion recommend testing for unit roots of the US CPI with a 14 to 15 month lag length. ADF results then indicate that the CPI series is not clearly I(1), but probably I(2).
In Japan EG, ECM and Johansen all three procedures indicate cointegra-tion. However, as CPI is I (1), while real estate stocks seem to be I (0), re-sults are misleading. In Canada, EG provides strong evidence for cointegra-tion, the ECM results support this at least on a 20 per cent level. However, the Johansen test fails to indicate cointegration.
In the Netherlands, the Johansen results are significant, but EG and ECM weakly indicate cointegration as well. In France ECM does not provide evidence for cointegration but the Johansen results do and the EG test also shows weak signs for cointegration. Similar to the US, however, CPI is not clearly I(1), when Akaike or modified Akaike criterion are applied in unit root testing. In Belgium the Johansen results clearly point to cointegration, evidence in EG tests is weaker but significant as well.
Table 5: Cointegration of real estate stock indices with equity market, bond market and consumer price indices (for details see table 7, 9, 10, 12 in the Appendix)
Equity Bonds CPI
EG ECM J EG ECM J EG ECM J
US N N N N N N N (Y) Y** AU Y** N Y N N N N N N JP Y* N N N N N N N N NL N N N N N N N N Y* FR N N N N N (Y) N N Y** BG N N N N N N Y* N Y** GE DIMAX N N N N N N (Y) N N GE EPRA N N N N (Y) N N N N
CA N N N Y*** (Y) N Y*** (Y) N
Source: own calculations, ***/**/*: Significance on 1/5/10 per cent level, (Y) signifi-cance on 20 per cent level.
Summarising the findings on cointegration of real estate stocks with the general equity market, the results let us conclude that – contrary to their positive short term correlations – almost no evidence exists for a tight long run relationship between real estate securities and the development of broader stock markets.
With respect to bonds, there is also little evidence for a stable long run rela-tionship to real estate securities. For most European markets little evidence for cointegration of real estate stock markets with national bond markets exists. Only in one other non-European market – namely Canada – cointe-gration with the bond market can be observed. However, the Canadian sample is not strictly comparable to the others due to a much shorter time period under consideration.
Some indication for cointegration of real estate stocks with the CPI is ob-servable in six of eight countries. In almost every country weak evidence exists for a long run equilibrium between real estate stock indicators and the CPI, indicating that real estate stocks could basically serve as an infla-tion hedge.
7
Conclusion
Our analysis has shown that real estate securities in most countries had a remarkably high performance in nominal and real terms. The average per-formance over the whole period from 1990 to 2004 has been particularly high in the capital market oriented countries in the sample (US, Australia), but also in France. Real estate securities have outperformed the bond mar-kets on a risk adjusted basis only in the US and in Australia, while outper-formance of the stock markets can be observed also in Japan and France. Particularly during the period 2001 to 2004 real estate security markets have soared in most countries with the notable exception of Germany, where average returns have been negative.
Despite the rather high short term correlation of monthly returns with the wider stock markets in most countries, usually no cointegration with the stock markets exists. In some markets weak signs for cointegration with the bond markets can be observed. In general, however, real estate securities seem to represent an asset class distinct from bonds and stocks in most countries. In the long run they seem to reflect the performance of direct real estate investments and provide a potential for further diversification of as-set portfolios. Additionally, real estate stocks provide a (weak) hedge against consumer price inflation in almost every country: This results stands in contrast to the outcome of many previous studies, which have not focused on long run cointegrating relationships.
The overall picture indicates furthermore, that the existence of specialised, tax transparent vehicles like REITs is not always correlated with high per-formance of securitised real estate. Although our analysis does – due to data limitations – not investigate the relationship between real estate mar-ket performance (i.e. the performance of direct real estate investments) and the performance of real estate stocks and REITs, it is plausible to assume that characteristics of the surrounding markets – i.e. the stock market capi-talization relative to the GDP as an indicator of the development stage of the stock markets – might have additional explanatory power. In light of the international experience, the poor performance of the German real es-tate stock market can potentially be attributed to a couple of problems: Aside from the fundamental problems of the German market real estate market, Germany is the only real estate security market where REITs or similar investment vehicles have not existed until now. Additionally, the stock market capitalisation in relation to GDP is still low in international comparison.
References
Brounen, D./Eichholtz, P. (2003): Property, Common Stocks, and Property Shares. Increased potential for diversification. In: The Journal of Portfolio Management, Special Issue 2003, p. 129 - 137.
Chatrath, A./Linang, Y. (1998): REITs and Inflation: A Long Run Perspec-tive. In. Journal of Real Estate Reseach, Vol. 16, No. 3, 1998, pp. 311 - 325.
Cauchie, S./Hoesli, M. (2004): The Integration of Securitized Real Estate and Financial Assets. University de Geneve, Research Paper. 111, June 2004.
Crocker, H. L./Hartzell, D. J./Hoesli, M. E. (1997): International Evidence on Real Estate Securities as an Inflation Hedge. In: Real Estate Eco-nomics, 1997, V 25 2, pp. 193-221.
Eichholtz, P./Hartzell, D.J. (1996): Property Shares, Appraisals and the Stock Market: An International Perspektive. In: Journal of Real Es-tate Finance and Economics, 12 (1996), pp. 163 – 178.
EPRA (2005): „Ground Rules for the Management of the FTSE EPRA/NAREIT Global Real Estate Index”. www. epra.com (18.02.06)
Ericsson, N. R./MacKinnon, J. G. (2002): Distributions of error correction tests for cointegration. In: Econometrics Journal (2002), volume 5, pp. 285 – 318.
Fama, E.F./Schwert E.G. (1977): Asset Returns and Inflation, Journal of Financial Economics, 1977, 5, 115 – 146.
Glascock, J. L./Lu, C./So, R. (2000): Further Evidence on the Integration of REIT, Bonds, and Stock Returns. Journal of Real Estate Finance and Economics, 20:2, 177 – 194.
Gorgel, J.B./McIntosh, W./Ott, S.H. (1995): Real Estate Investment Trusts: A Review of the Financial Economics Literature. In: Journal of Real Estate Literature, 3, pp. 13 – 43.
Hamelink, F./Hoesli, M. (2004): What Factors Determine International Real Estate Security Returns? In: Real Estate Economics 2004 V32 3: pp. 437 - 462.
Ling, D.C./Naranjo, A (1999): The Integration of Commercial Real Estate Markets and Stock Markets. In: Real Estate Economics (1999) Vol. 27(3), pp. 483 – 515.
Lizieri, C./McAllister, P./Ward, C. (2003): Continental Shift? An Analysis of Convergence Trends in European Real Estate Equities. In: JRER, Vol. 25, No. 1 – 2003, pp. 1-21
MacKinnon, J.G. (1996), Numerical distribution functions for unit root and
cointegration tests, Journal of Applied Econometrics, 11, 1996,
601-618.
Maurer, R./Sebastian, S. P. (2002): Inflation Risk Analysis of European Real Estate Securities. In: JRER, Vol. 24, No.1 -2002, pp. 47 – 77. Meyer, F:C. N./Webb, J.R. (1994): Retail Stocks, Retail REITs and Retail
Real Estate. In: The Journal of Real Estate Research, Vol. 9, No. 1 (Winter 1994), p. pp. 65 -84.
Modigliani, F./Modigliani, L. (1997): Risk Adjusted Performance. How to measure it and why. In: The Journal of Portfolio Management. Win-ter 1997, pp. 45 – 54.
Mull, S. R./Soenen, L.A. (1997), U.S. REITs as an Asset Class in Interna-tional Investment Portfolios. Financial Analysts Journal March/April 1997, p. 55 – 61.
Murphy, J.A./Kleiman, R. T.(1989): The Inflation Hedging Characteristics of Equity REITs: An Empirical Study. In: Quarterly Review of Economics and Business, Vol. 29, No. 3, Autumn 1989, pp. 95 – 101.
Okunev, J./Wilson, P.J. (1997): Using Nonlinear Tests to Examine Integra-tion between Real Estate and Stock Markets. In: Real Estate Eco-nomics, 1997 V25, pp. 487 – 503.
UBS Investment Bank (2004): Real Estate Investment Trusts – Time is now. London.
Yobaccio, E./Rubens, J.H./Ketcham, D.C. (1995): The Inflation Hedging Characteristics of Risk Assets: The Case of REITs, Journal of Real Estate Research, 1995, 10, pp. 279-298.
Zietz, E./Sirmans, G.S./Friday, H.S. (2003): The Environment and Per-formance of Real Estate Investment Trusts. In: Journal of Real Es-tate Portfolio Management, Vol. 9 No. 2, 2003, pp. 127 – 165.
8
Appendix
Table 6a: Unit Root Test (Schwarz Criterion)
Levels 1. Diff.
Bonds Equity Real Estate CPI Bonds Equity. Real Estate CPI
US No. of Values 180 180 180 180 180 180 180 180 No. of Lags 0 0 0 1 0 0 0 0 Test -0.990 -1.220 0.594 -2.743 -12.043 -13.711 -12.800 -9.961 Prob 0.757 0.665 0.989 0.069 0.000 0.000 0.000 0.000 Canada No. of Values 96 96 96 96 96 96 96 96 No. of Lags 0 0 0 0 0 0 0 0 Test -0.307 -1.579 -1.275 0.756 -11.061 -8.051 -8.721 -8.606 Prob 0.919 0.489 0.639 0.993 0.000 0.000 0.000 0.000 Australia No. of Values 180 180 179 177 179 179 179 177 No. of Lags 0 0 1 3 0 0 0 2 Test -2.489 -0.326 -0.357 -0.154 -12.163 -14.709 -16.779 -3.265 Prob 0.120 0.917 0.912 0.940 0.000 0.000 0.000 0.018 Japan No. Of Values 180 180 180 180 179 179 179 179 No. Of Lags 0 0 0 0 0 0 0 0 Test -1.533 -3.351 -4.356 -1.833 -12.024 -13.056 -13.540 -12.532 Prob 0.515 0.014 0.000 0.364 0.000 0.000 0.000 0.000 Netherlands No. of Values 180 180 180 180 179 179 179 177 No. of Lags 0 0 0 0 0 0 0 2 Test -0.772 -1.368 1.783 -1.624 -11.815 -12.892 -10.807 -5.788 Prob 0.824 0.597 1.000 0.468 0.000 0.000 0.000 0.000 21
Levels 1. Diff.
Bonds Equity Real Estate CPI Bonds Equity. Real Estate CPI
Belgium No. of Values 179 180 180 180 179 179 179 179 No. of Lags 1 0 0 0 0 0 0 0 Test -1.746 -0.595 0.157 -1.917 -11.505 -12.159 -12.111 -11.959 Prob 0.407 0.867 0.969 0.324 0.000 0.000 0.000 0.000 France No. of Values 180 180 179 180 179 179 179 179 No. of Lags 0 0 1 0 0 0 0 0 Test -1.462 -0.851 1.186 -2.055 -11.454 -12.247 -10.612 -12.781 Prob 0.551 0.801 0.998 0.263 0.000 0.000 0.000 0.000 Germany (DI-MAX) No. of Values 180 180 180 180 180 180 180 180 No. of Lags 0 0 1 0 0 0 0 2 Test -0.406 -1.060 -1.135 -5.542 -12.485 -12.868 -11.032 -5.294 Prob 0.904 0.731 0.702 0.000 0.000 0.000 0.000 0.000 Germany (EPRA) No. of Values 179 178 No. of Lags 0 0 Test -2.350 -12.879 Prob 0.158 0.000 22
Table 6b: Unit Root Test (Modified Akaike Criterion)
Levels 1. Diff.
Bonds Equity Real Estate CPI Bonds Equity. Real Estate CPI
US No. of Values 180 180 180 180 180 180 180 180 No. of Lags 2 0 0 15 0 11 11 15 Test -0.973 -1.220 0.594 -1.618 -12.043 -2.716 -3.118 -2.383 Prob 0.762 0.665 0.989 0.471 0.000 0.073 0.027 0.148 Canada No. of Values 96 96 96 96 96 96 96 96 No. of Lags 0 1 0 2 0 9 6 0 Test -0.307 -1.780 -1.275 0.833 -11.061 -2.584 -3.173 -8.606 Prob 0.919 0.388 0.639 0.994 0.000 0.100 0.025 0.000 Australia No. of Values 177 179 178 175 170 177 172 175 No. of Lags 3 1 2 5 9 2 7 4 Test -2.364 -0.212 -0.442 -0.753 -3.304 -7.862 -3.849 -3.953 Prob 0.154 0.933 0.898 0.829 0.016 0.000 0.003 0.002 Japan No. Of Values 177 180 180 177 178 175 179 167 No. Of Lags 3 0 0 3 1 4 0 12 Test -2.467 -3.351 -4.356 -1.345 -8.439 -5.399 -13.540 -3.393 Prob 0.125 0.014 0.000 0.608 0.000 0.000 0.000 0.013 Netherlands No. of Values 177 180 179 176 176 168 167 169 No. of Lags 3 0 1 4 3 11 12 10 Test -1.163 -1.368 1.212 -1.191 -5.425 -2.716 -2.649 -2.088 Prob 0.690 0.597 0.998 0.678 0.000 0.073 0.085 0.250 23
Levels 1. Diff.
Bonds Equity
Real
Es-tate CPI Bonds Equity. Real Estate CPI
Belgium No. of Values 179 180 175 165 172 168 170 167 No. of Lags 1 0 5 15 7 11 9 12 Test -1.746 -0.595 0.094 -0.445 -3.999 -2.905 -3.229 -3.036 Prob 0.407 0.867 0.964 0.897 0.002 0.047 0.020 0.034 France No. of Values 176 180 173 165 176 168 174 166 No. of Lags 4 0 7 15 3 11 5 13 Test -1.339 -0.851 1.070 0.374 -4.915 -3.040 -3.772 -2.509 Prob 0.611 0.801 0.997 0.981 0.000 0.033 0.004 0.115 Germany (DI-MAX) No. of Values 180 180 180 180 180 180 179 180 No. of Lags 0 0 12 10 3 4 12 9 Test -0.406 -1.060 -1.311 -2.471 -5.394 -5.460 -2.800 -1.974 Prob 0.904 0.731 0.624 0.124 0.000 0.000 0.060 0.298 Germany (EPRA) No. of Values 179 164 No. of Lags 0 14 Test -2.350 -2.401 Prob 0.158 0.143 24
Table 7: Results Engle Granger Tests for Cointegration of Real Estate Securities
Equity Bonds CPI
US No. of Values 167 179 179
No. Of Lags 12 0 0
ADF test -1.677 -1.955 -2.019
Australia No. Of Values 179 178 177
No. Of Lags 0 1 2
ADF test -3.461** -1.774 -2.490
Japan No. Of Values 179 179 179
No. Of Lags 0 0 0
ADF test -3.224* -4.047*** -4.222***
Netherlands No. Of Values 178 178 165
No. Of Lags 1 1 14
ADF test 0.726 -1.993 -2.020
Belgium No. Of Values 174 178 174
No. Of Lags 5 1 5
ADF test -1.646 -2.000 -3.329*
France No. Of Values 172 177 173
No. Of Lags 7 2 6
ADF test 0.334 -1.289 -2.684
Germany (DIMAX) No. Of Values 179 167 166
No. Of Lags 0 12 13
ADF test -1.776 -2.510 -2.819 (*)
Germany (EPRA) No. Of Values 179 179 179
No. Of Lags 0 0 0
ADF test -2.305 -2.177 -2.043
Canada No. Of Values 96 96 96
No. Of Lags 1 14 1
ADF test -1.819 -7.364*** -4.556***
Source: NAREIT, EPRA, EcoWin, Thomson Financial Datastream, own calculations. ***/**/*/(*) = 1%/5%/10%/20% significance level. Lag determination by Akaike crite-rion, maximum lag order 15.
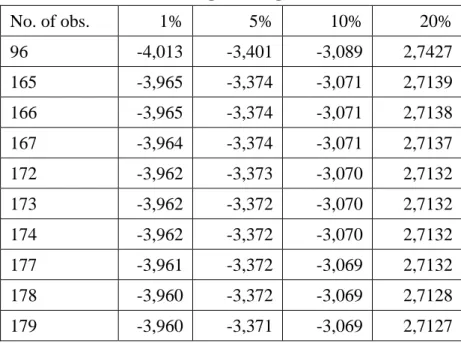
Table 8: Critical values Engle Granger Tests (with constant) No. of obs. 1% 5% 10% 20% 96 -4,013 -3,401 -3,089 2,7427 165 -3,965 -3,374 -3,071 2,7139 166 -3,965 -3,374 -3,071 2,7138 167 -3,964 -3,374 -3,071 2,7137 172 -3,962 -3,373 -3,070 2,7132 173 -3,962 -3,372 -3,070 2,7132 174 -3,962 -3,372 -3,070 2,7132 177 -3,961 -3,372 -3,069 2,7132 178 -3,960 -3,372 -3,069 2,7128 179 -3,960 -3,371 -3,069 2,7127
Source: MacKinnon (1996), calculations for 20 per cent level with program provided on http://qed.econ.queensu.ca/pub/faculty/mackinnon/numdist/
Table 9: Results of Error Correction Models with 1 and 2 Lags
Equity Bonds CPI Equity Bonds CPI
Coeff t-value Coeff t-value Coeff t-value Coeff t-value Coeff t-value Coeff. t-value US ΔEndog (-1) -0.05 -0.63 0.06 0.81 0.05 0.71 Δ Endog (-1) -0.04 -0.55 0.06 0.80 0.05 0.68 ΔExog 0.30 4.88*** 0.30 1.91* -0.83 -0.47 Δ Endog (-2) 0.11 1.46 0.12 1.53 0.10 1.30 Δ Exog (-1) 0.19 2.96*** 0.09 0.59 -1.27 -0.75 ΔExog 0.31 4.99*** 0.31 1.96* -1.02 -0.57 Res(-1) 0.01 0.79 -0.05 -1.79 -0.07 -2.55 Δ Exog (-1) 0.19 2.85*** 0.10 0.65 -0.61 -0.33 C 0.01 2.43** 0.01 2.32** 0.01 2.60** Δ Exog (-2) -0.03 -0.39 -0.04 -0.25 -1.23 -0.72 Res(-1) 0.01 0.52 -0.05 -2.02 -0.07 -2.76 C 0.01 2.00** 0.01 1.84* 0.02 2.29** Adj. r2 0.14 0.02 0.02 Adj. r2 0.14 0.02 0.02 DW 1.99 2.01 2.01 DW 2.02 2.01 2.00 AIC -3.85 -3.72 -3.72 AIC -3.84 -3.71 -3.70 Canada ΔEndog (-1) 0.14 1.35 0.16 1.57 0.14 1.42 Δ Endog (-1) 0.09 0.85 0.10 0.98 0.11 1.03 ΔExog 0.37 3.84*** 0.88 2.44** -0.55 -0.30 Δ Endog (-2) 0.11 1.10 0.08 0.83 0.08 0.75 ΔExog (-1) 0.04 0.38 0.45 1.25 0.29 0.15 ΔExog 0.36 3.82*** 0.82 2.28** -0.50 -0.26 Res(-1) -0.02 -0.91 -0.13 -2.59 -0.12 -2.69 Δ Exog (-1) 0.08 0.75 0.57 1.56 0.47 0.25 C 0.01 1.44 0.00 0.32 0.01 1.56 Δ Exog (-2) -0.08 -0.74 0.21 0.56 -0.81 -0.42 Res(-1) -0.01 -0.69 -0.12 -2.42 -0.11 -2.39 C 0.01 1.12 0.00 -0.15 0.01 1.32 Adj. r2 0.14 0.10 0.05 Adj. r2 0.13 0.07 0.01 DW 2.04 2.06 2.02 DW 2.01 2.00 1.98 AIC -3.21 -3.16 -3.11 AIC -3.22 -3.16 -3.09 Australia Δ Endog (-1) -0.13 -1.70* -0.23 -3.12*** -0.21 -2.96*** Δ Endog (-1) -0.11 -1.41 -0.20 -2.61*** -0.19 -2.46** ΔExog 0.48 9.33*** 0.71 7.03*** -31.75 -2.75*** Δ Endog (-2) 0.07 0.87 0.04 0.59 0.13 1.80* Δ Exog (-1) -0.02 -0.26 -0.04 -0.39 31.43 2.82*** ΔExog 0.47 9.18*** 0.69 6.82*** -29.31 -2.50** 27
Equity Bonds CPI Equity Bonds CPI Coeff t-value Coeff t-value Coeff t-value Coeff t-value Coeff t-value Coeff. t-value C 0.01 4.84*** 0.01 3.81*** 0.01 2.19** Δ Exog (-2) 0.03 0.54 0.17 1.49 7.05 0.61 Res(-1) -0.02 -0.89 -0.03 -1.47 -0.07 -2.46 C 0.01 3.84*** 0.01 2.78*** 0.01 1.83* Adj. r2 0,36 0,25 0,10 Adj. r2 0.36 0.26 0.11 DW 1,95 1,91 1,94 DW 1.98 1.97 1.98 AIC -4,53 -4,38 -4,20 AIC -4.52 -4.37 -4.19 Japan ΔEndog (-1) -0.05 -0.65 0.03 0.38 0.03 0.47 Δ Endog (-1) -0.05 -0.62 0.01 0.19 0.04 0.53 Δ Exog 1.11 14.22*** -0.37 -0.86 1.97 1.28 Δ Endog (-2) 0.02 0.20 -0.04 -0.56 -0.02 -0.34 ΔExog (-1) 0.03 0.30 0.03 0.07 1.33 0.86 Δ Exog 1.11 14.15*** -0.43 -1.00 2.13 1.36 Res(-1) -0.08 -2.33 -0.15 -3.97*** -0.15 -4.54*** Δ Exog (-1) 0.03 0.30 -0.09 -0.21 1.18 0.76 C 0.00 0.26 0.00 -0.19 0.00 -0.51 Δ Exog (-2) -0.10 -0.88 0.61 1.47 3.10 2.00** Res(-1) -0.08 -2.34 -0.13 -3.46** -0.17 -4.61*** C 0.00 0.14 0.00 -0.46 0.00 -0.58 Adj. r2 0.56 0.07 0.09 Adj. r2 0.55 0.06 0.09 DW 2.00 1.99 2.02 DW 1.95 1.94 1.95 AIC -2.76 -2.01 -2.04 AIC -2.74 -2.00 -2.03 Netherlands ΔEndog (-1) 0.22 2.90*** 0.21 2.85*** 0.20 2.71*** ΔEndog (-1) 0.21 2.68*** 0.19 2.56** 0.19 2.54** ΔExog 0.34 8.20*** 0.24 1.23 -1.36 -1.01 Δ Endog (-2) 0.02 0.27 0.06 0.81 0.06 0.74 ΔExog (-1) -0.02 -0.50 0.06 0.32 -0.38 -0.28 ΔExog 0.34 8.04*** 0.30 1.48 -1.27 -0.93 Res(-1) 0.01 0.86 -0.03 -1.90 -0.03 -2.11 Δ Exog (-1) -0.02 -0.42 0.06 0.29 -0.30 -0.22 C 0.00 0.66 0.00 0.58 0.01 1.51 Δ Exog (-2) 0.03 0.60 0.32 1.65 0.04 0.03 Res(-1) 0.01 0.89 -0.03 -1.67 -0.04 -2.19 C 0.00 0.53 0.00 -0.29 0.01 1.15 Adj. r2 0.29 0.05 0.05 Adj. r2 0.29 0.06 0.04 DW 2.02 2.03 2.02 DW 1.98 2.00 2.00 AIC -4.22 -3.92 -3.92 AIC -4.19 -3.92 -3.90 28
Equity Bonds CPI Equity Bonds CPI Coeff t-value Coeff t-value Coeff t-value Coeff t-value Coeff t-value Coeff. t-value
Belgium ΔEndog (-1) 0.07 0.99 0.09 1.18 0.09 1.13 Δ Endog (-1) 0.08 1.07 0.10 1.36 0.09 1.10 ΔExog 0.35 6.38*** 0.67 3.04*** -2.05 -1.42 Δ Endog (-2) -0.13 -1.69* -0.09 -1.17 -0.14 -1.78* Δ Exog (-1) 0.05 0.86 0.40 1.78* 0.28 0.20 ΔExog 0.34 6.12*** 0.61 2.74*** -1.89 -1.28 Res(-1) -0.02 -0.96 -0.03 -1.69 -0.04 -2.16 Δ Exog (-1) 0.05 0.79 0.39 1.70* -0.42 -0.29 C 0.00 -0.01 -0.01 -1.48 0.01 1.30 Δ Exog (-2) 0.01 0.23 -0.17 -0.72 -0.13 -0.09 Res(-1) -0.01 -0.71 -0.03 -1.61 -0.03 -1.68 C 0.00 0.14 0.00 -0.82 0.01 1.43 Adj. r2 0.20 0.10 0.03 Adj. r2 0.19 0.09 0.03 DW 1.98 1.96 1.98 DW 1.98 1.96 1.94 AIC -3.79 -3.67 -3.60 AIC -3.78 -3.66 -3.60 France ΔEndog (-1) 0.08 1.15 0.22 2.93*** 0.23 3.05*** Δ Endog (-1) 0.12 1.60 0.24 3.20*** 0.25 3.27*** ΔExog 0.31 6.76*** 0.69 3.41*** -0.02 -0.01 Δ Endog (-2) -0.03 -0.42 -0.09 -1.16 -0.10 -1.35 Δ Exog (-1) 0.16 2.96*** 0.17 0.82 -1.14 -0.63 ΔExog 0.31 6.65*** 0.69 3.41*** -0.10 -0.05 Res(-1) 0.01 1.23 -0.02 -1.46 -0.03 -1.67 Δ Exog (-1) 0.15 2.80*** 0.17 0.78 -1.42 -0.78 C 0.00 1.87* 0.00 0.11 0.01 1.69* Δ Exog (-2) -0.07 -1.24 -0.13 -0.62 0.85 0.47 Res(-1) 0.01 1.04 -0.02 -1.43 -0.02 -1.43 C 0.01 1.98** 0.00 0.48 0.01 1.44 Adj. r2 0.27 0.11 0.04 Adj. r2 0.27 0.11 0.04 DW 1.92 1.94 1.94 DW 2.01 1.98 1.97 AIC -3.86 -3.67 -3.59 AIC -3.85 -3.65 -3.58 ) Germany (DIMAX Δ Endog (-1) 0.12 1.71* 0.19 2.58** 0.19 2.52** Δ Endog (-1) 0.14 1.82* 0.20 2.61*** 0.19 2.51** Δ Exog 0.23 6.54*** -0.02 -0.12 -2.76 -2.27** Δ Endog (-2) 0.00 0.02 -0.05 -0.62 -0.01 -0.17 ΔExog (-1) 0.07 1.71* 0.01 0.07 0.22 0.18 Δ Exog 0.23 6.51*** -0.04 -0.23 -3.01 -2.41** Res(-1) -0.04 -2.12 -0.02 -1.71 -0.02 -1.32 Δ Exog (-1) 0.07 1.61 0.00 -0.01 -0.02 -0.02 C 0.00 0.27 0.00 0.66 0.01 1.68* Δ Exog (-2) -0.03 -0.76 -0.11 -0.62 1.61 1.28 Res(-1) -0.04 -2.21 -0.02 -1.75 -0.02 -1.24 29
Equity Bonds CPI Equity Bonds CPI Coeff t-value Coeff t-value Coeff t-value Coeff t-value Coeff t-value Coeff. t-value Adj. r2 0.25 0.03 0.05 Adj. r2 0.25 0.02 0.05 DW 1.98 1.98 1.99 DW 1.98 1.99 1.97 AIC -4.07 -3.81 -3.83 AIC -4.05 -3.79 -3.82 Germany (EPRA) ΔEndog (-1) 0.04 0.54 0.04 0.54 0.04 0.59 Δ Endog (-1) 0.04 0.50 0.04 0.49 0.05 0.64 Δ Exog 0.25 3.50*** -0.61 -1.87* -2.45 -1.08 ΔEndog (-2) 0.13 1.77* 0.10 1.31 0.15 1.94* Δ Exog (-1) -0.05 -0.63 -0.17 -0.55 -0.47 -0.20 Δ Exog 0.27 3.75*** -0.56 -1.70* -3.64 -1.58 Res(-1) -0.05 -2.46 -0.05 -2.58 -0.04 -1.89 Δ Exog (-1) -0.06 -0.75 -0.19 -0.58 -0.89 -0.39 C 0.00 0.75 0.01 1.73* 0.01 1.35 Δ Exog (-2) 0.04 0.51 -0.12 -0.40 3.99 1.74* Res(-1) -0.05 -2.52 -0.05 -2.71 -0.04 -2.17 C 0.00 0.64 0.01 1.64 0.00 0.63 Adj. r2 0.09 0.03 0.01 Adj. r2 0.10 0.03 0.03 DW 2.01 2.01 2.01 DW 2.01 2.01 2.02 AIC -2.68 -2.62 -2.60 AIC -2.68 -2.61 -2.61
Source: NAREIT, EPRA, EcoWin, Thomson Financial Datastream, own calculations. Endog = Real Estate Security Index, Exog = Equity, Bond, or CPI Index, RES = Engle Granger Residual
Table 10: Results of Error Correction Models with 3 and 4 Lags
Equity Bonds CPI Equity Bonds CPI Coeff t-value Coeff t-value Coeff t-value Coeff t-value Coeff t-value Coeff. t-value
US Δ Endog (-1) -0.05 -0.64 0.07 0.86 0.05 0.67 Δ Endog (-1) -0.04 -0.51 0.07 0.84 0.05 0.62 Δ Endog (-2) 0.15 1.88* 0.14 1.75* 0.11 1.36 ΔEndog (-2) 0.15 1.91* 0.13 1.72* 0.10 1.34 Δ Endog (-3) 0.12 1.54 0.08 1.02 0.04 0.53 ΔEndog (-3) 0.10 1.24 0.08 0.95 0.04 0.51 Δ Exog 0.33 5.26*** 0.35 2.19** -1.21 -0.65 ΔEndog (-4) -0.06 -0.76 -0.02 -0.19 -0.01 -0.15 Δ Exog (-1) 0.20 3.01*** 0.07 0.42 -0.64 -0.34 Δ Exog 0.33 5.22*** 0.34 2.11** -1.37 -0.73 Δ Exog (-2) -0.04 -0.59 0.00 0.00 -1.41 -0.74 Δ Exog (-1) 0.19 2.80* 0.07 0.41 -0.65 -0.33 Δ Exog (-3) -0.13 -1.91* -0.29 -1.78* -0.30 -0.17 Δ Exog (-2) -0.05 -0.68 0.00 -0.02 -1.28 -0.66 Res(-1) 0.00 0.13 -0.07 -2.40 -0.08 -2.87 ΔExog (-3) -0.13 -1.86* -0.29 -1.78* -0.44 -0.22 C 0.01 1.77* 0.01 1.88* 0.02 2.16** ΔExog (-4) 0.06 0.84 0.00 0.01 0.92 0.50 Res(-1) 0.00 0.29 -0.06 -2.21 -0.08 -2.58 C 0.01 1.83* 0.01 1.84* 0.02 1.81* Adj. r2 0.15 0.03 0.01 Adj. r2 0.14 0.02 0.00 DW 1.97 1.99 1.98 DW 2.00 1.99 2.00 AIC -3.83 -3.70 -3.68 AIC -3.81 -3.67 -3.65 Canada Δ Endog (-1) 0.09 0.79 0.11 1.03 0.13 1.18 ΔEndog (-1) 0.09 0.82 0.11 1.01 0.13 1.19 Δ Endog (-2) 0.12 1.16 0.09 0.81 0.09 0.82 ΔEndog (-2) 0.15 1.34 0.09 0.85 0.11 0.99 Δ Endog (-3) 0.07 0.68 0.11 1.05 0.10 0.93 ΔEndog (-3) 0.09 0.84 0.12 1.08 0.12 1.14 Δ Exog 0.37 3.86*** 0.84 2.25** -0.77 -0.40 Δ Endog (-4) -0.09 -0.85 0.01 0.08 -0.04 -0.40 Δ Exog (-1) 0.07 0.66 0.51 1.35 0.33 0.17 Δ Exog 0.37 3.73*** 0.84 2.18** -0.84 -0.43 Δ Exog (-2) -0.04 -0.38 0.21 0.54 -0.88 -0.45 ΔExog (-1) 0.07 0.65 0.49 1.25 0.32 0.16 ΔExog (-3) -0.15 -1.46 -0.16 -0.43 -1.12 -0.57 Δ Exog (-2) -0.05 -0.46 0.19 0.50 -1.42 -0.70 Res(-1) -0.02 -0.89 -0.14 -2.58 -0.13 -2.65 ΔExog (-3) -0.18 -1.62 -0.18 -0.47 -0.95 -0.48 C 0.01 1.08 0.00 -0.16 0.01 1.37 Δ Exog (-4) 0.04 0.34 -0.06 -0.16 -1.72 -0.88 Res(-1) -0.02 -0.86 -0.14 -2.45 -0.14 -2.70 C 0.01 1.21 0.00 -0.08 0.02 1.67* Adj. r2 0.13 0.06 0.00 Adj. r2 0.12 0.04 0.00 DW 1.98 2.00 2.00 DW 1.95 1.99 2.01 AIC -3.19 -3.12 -3.06 AIC -3.15 -3.06 -3.02 Australia 31
Equity Bonds CPI Equity Bonds CPI Coeff t-value Coeff t-value Coeff t-value Coeff t-value Coeff t-value Coeff. t-value
Δ Endog (-2) 0.06 0.81 0.03 0.39 0.15 1.89* ΔEndog (-2) 0.08 1.00 0.04 0.55 0.16 2.02** Δ Endog (-3) 0.01 0.18 -0.05 -0.69 0.00 -0.02 ΔEndog (-3) 0.00 -0.01 -0.07 -0.86 -0.01 -0.09 Δ Exog 0.48 9.14*** 0.69 6.69*** -33.85 -2.71*** Δ Endog (-4) 0.01 0.19 -0.03 -0.38 -0.04 -0.58 Δ Exog (-1) -0.02 -0.27 -0.08 -0.66 25.92 1.41 Δ Exog 0.48 9.20*** 0.70 6.74*** -36.87 -2.88*** Δ Exog (-2) 0.03 0.49 0.18 1.54 19.14 1.07 ΔExog (-1) -0.01 -0.14 -0.07 -0.57 30.35 1.56 Δ Exog (-3) -0.05 -0.79 0.02 0.21 -11.22 -0.95 ΔExog (-2) 0.04 0.60 0.19 1.60 16.24 0.88 Res(-1) -0.02 -0.99 -0.03 -1.41 -0.06 -2.24 Δ Exog (-3) -0.05 -0.86 0.03 0.29 -4.80 -0.26 C 0.01 3.63*** 0.01 2.77*** 0.01 1.56 Δ Exog (-4) -0.11 -1.77* -0.06 -0.56 -5.21 -0.44 Res(-1) -0.03 -1.19 -0.04 -1.68 -0.06 -2.20 C 0.01 3.63*** 0.01 2.75*** 0.01 1.72* Adj. r2 0.35 0.25 0.10 Adj. r2 0.38 0.25 0.10 DW 1.99 1.97 1.98 DW 1.95 1.97 1.99 AIC -4.50 -4.35 -4.17 AIC -4.52 -4.34 -4.15 Japan Δ Endog (-1) -0.05 -0.66 0.01 0.10 0.02 0.29 Δ Endog (-1) -0.06 -0.74 0.01 0.18 0.05 0.64 Δ Endog (-2) 0.00 0.05 -0.06 -0.75 -0.04 -0.58 Δ Endog (-2) 0.01 0.12 -0.03 -0.40 -0.03 -0.40 Δ Endog (-3) -0.03 -0.34 0.07 0.97 0.08 1.05 Δ Endog (-3) -0.02 -0.31 0.09 1.18 0.09 1.20 Δ Exog 1.08 13.62** * -0.60 -1.38 2.01 1.30 ΔEndog (-4) 0.00 0.06 0.03 0.35 0.05 0.74 Δ Exog (-1) 0.02 0.17 -0.12 -0.27 1.68 1.08 Δ Exog 1.08 13.53** * -0.64 -1.46 2.29 1.46 Δ Exog (-2) -0.10 -0.85 0.48 1.12 3.49 2.28** Δ Exog (-1) 0.02 0.20 -0.26 -0.58 1.79 1.15 Δ Exog (-3) 0.10 0.88 -0.46 -1.09 -0.18 -0.11 Δ Exog (-2) -0.11 -0.92 0.59 1.37 3.81 2.42** Res(-1) -0.07 -1.86 -0.12 -3.05* -0.15 -3.80** Δ Exog (-3) 0.10 0.82 -0.29 -0.67 -0.10 -0.06 C 0.00 0.36 0.00 0.26 0.00 -0.32 Δ Exog (-4) 0.08 0.69 -0.76 -1.80* 1.65 1.05 Res(-1) -0.07 -1.78 -0.14 -3.30** -0.17 -4.05*** C 0.00 0.44 0.00 0.63 0.00 -0.36 Adj. r2 0.53 0.04 0.07 Adj. r2 0.53 0.05 0.07 DW 2.02 2.01 1.98 DW 2.00 1.99 2.01 AIC -2.74 -2.03 -2.06 AIC -2.72 -2.02 -2.05 32
Equity Bonds CPI Equity Bonds CPI Coeff t-value Coeff t-value Coeff t-value Coeff t-value Coeff t-value Coeff. t-value
Netherlands Δ Endog (-1) 0.22 2.82*** 0.19 2.48** 0.19 2.51** Δ Endog (-1) 0.21 2.64*** 0.19 2.46** 0.19 2.53** Δ Endog (-2) 0.02 0.23 0.06 0.73 0.05 0.68 ΔEndog (-2) 0.03 0.36 0.05 0.65 0.05 0.66 Δ Endog (-3) 0.07 0.88 0.04 0.54 0.02 0.29 ΔEndog (-3) 0.06 0.76 0.04 0.54 0.03 0.34 Δ Exog 0.33 7.94*** 0.29 1.42 -1.10 -0.78 ΔEndog (-4) 0.08 1.05 0.01 0.12 -0.01 -0.09 Δ Exog (-1) -0.02 -0.34 0.08 0.39 -0.15 -0.11 Δ Exog 0.34 7.93*** 0.31 1.45 -1.30 -0.91 Δ Exog (-2) 0.03 0.61 0.34 1.72* -0.04 -0.03 Δ Exog (-1) -0.02 -0.39 0.05 0.23 -0.40 -0.27 Δ Exog (-3) -0.10 -1.92* -0.04 -0.17 -0.77 -0.55 Δ Exog (-2) 0.03 0.68 0.38 1.84* -0.20 -0.14 Res(-1) 0.01 0.55 -0.03 -1.72 -0.04 -2.21 Δ Exog (-3) -0.09 -1.81* -0.03 -0.13 -0.59 -0.40 C 0.00 0.72 0.00 -0.35 0.01 1.20 Δ Exog (-4) -0.07 -1.47 0.05 0.24 1.12 0.78 Res(-1) 0.00 0.19 -0.03 -1.76 -0.04 -2.20 C 0.00 0.75 0.00 -0.52 0.01 0.90 Adj. r2 0.30 0.06 0.03 Adj. r2 0.30 0.05 0.03 DW 2.03 2.00 1.99 DW 2.00 2.00 1.97 AIC -4.19 -3.89 -3.87 AIC -4.17 -3.87 -3.85 Belgium Δ Endog (-1) 0.09 1.10 0.11 1.46 0.09 1.18 ΔEndog (-1) 0.10 1.27 0.12 1.61 0.09 1.14 ΔEndog (-2) -0.11 -1.48 -0.08 -1.04 -0.11 -1.49 ΔEndog (-2) -0.09 -1.21 -0.06 -0.78 -0.09 -1.15 ΔEndog (-3) -0.03 -0.33 -0.01 -0.15 -0.04 -0.49 ΔEndog (-3) -0.03 -0.44 -0.03 -0.45 -0.05 -0.71 Δ Exog 0.33 5.85*** 0.49 2.13** -2.78 -1.92* Δ Endog (-4) 0.16 2.15** 0.20 2.63*** 0.16 2.07** Δ Exog (-1) 0.06 0.99 0.45 1.93* -0.68 -0.48 Δ Exog 0.31 5.56*** 0.53 2.30** -3.05 -2.08** Δ Exog (-2) 0.01 0.24 -0.15 -0.65 0.14 0.09 Δ Exog (-1) 0.06 0.92 0.49 2.08** -0.65 -0.45 Δ Exog (-3) 0.01 0.11 0.07 0.32 -3.82 -2.66*** Δ Exog (-2) 0.01 0.17 -0.12 -0.50 -0.29 -0.20 Res(-1) -0.01 -0.85 -0.04 -1.91 -0.04 -1.97 ΔExog (-3) 0.01 0.16 0.11 0.48 -3.01 -2.02** C 0.00 0.00 0.00 -0.94 0.02 2.49** ΔExog (-4) -0.08 -1.25 -0.05 -0.22 -0.29 -0.19 Res(-1) -0.02 -1.08 -0.04 -1.78 -0.04 -2.02 C 0.00 0.09 -0.01 -1.16 0.01 2.14** Adj. r2 0.18 0.08 0.07 Adj. r2 0.19 0.11 0.08 DW 1.98 1.97 2.00 DW 2.01 1.99 1.98 AIC -3.77 -3.66 -3.65 AIC -3.77 -3.67 -3.64 France 33