Exchange rate pass-through into import prices: A macro or micro phenomenon?
29
0
0
Full text
(2) The CIFF (Centro Internacional de Investigación Financiera) is being set up as a result of concerns from an interdisciplinary group of professors at IESE about financial research and will function as part of IESE’s core activities. Its objectives are: to unite efforts in the search for answers to the questions raised by the managers of finance companies and the finance staff of all types of companies during their daily work; to develop new tools for financial management; and to study more deeply the nature and effects of the transformations that are occurring in the financial world. The development of the CIIF’s activities has been possible thanks to sponsorship from: Aena, AT Kearney, Caja Madrid, Fundación Ramón Areces, Grupo Endesa, Telefónica and Unión Fenosa. http://www.iese.edu/ciif/.
(3) EXCHANGE RATE PASS-THROUGH INTO IMPORT PRICES: A MACRO OR MICRO PHENOMENON?. Abstract Exchange rate regime optimality, as well as monetary policy effectiveness, depends on the tightness of the link between exchange rate movements and import prices. Recent debates hinge on whether producer-currency pricing (PCP) or local-currency pricing (LCP) of imports is more prevalent, and on whether exchange rate pass-through rates are endogenous to a country’s macroeconomic conditions. We provide cross-country and time series evidence on both of these issues for the imports of twenty-five OECD countries. Across the OECD, and especially within manufacturing industries, there is compelling evidence of partial pass-through in the short-run – rejecting both PCP and LCP. Over the long run, PCP is more prevalent for many types of imported goods. Higher inflation and exchange rate volatility are weakly associated with higher pass-through of exchange rates into import prices. However, for OECD countries, the most important determinants of changes in passthrough over time are microeconomic and relate to the industry composition of a country’s import bundle.. JEL codes: F3, F4. Keywords: Producer currency pricing, exchange rate pass-through, imports, monetary policy.
(4) EXCHANGE RATE PASS-THROUGH INTO IMPORT PRICES: MACRO OR MICRO PHENOMENON? (1). 1. Introduction While exchange rate pass-through has long been of interest, the focus of this interest has evolved considerably over time. After a long period of debate over the Law of One Price and convergence across countries, beginning in the late 1980s exchange rate pass-through studies emphasized industrial organization and the role of segmentation and price discrimination across geographically distinct product markets. More recently, pass-through issues have played a central role in heated debates over appropriate monetary policies and exchange rate regime optimality (2). These debates hinge on the issue of the prevalence of producer-currency pricing (PCP) versus local-currency pricing (LCP) of imports, and on whether exchange rate pass-through rates are endogenous to a country’s inflation performance. Low import price pass-through means that nominal exchange rate fluctuations may lead to lower expenditure switching effects of domestic monetary policy, thereby leaving monetary policy more effective for dealing with real shocks. If pass-through rates are endogenous to a country’s relative monetary stability, the extent of this monetary policy effectiveness may be fragile and regime-specific (3). The first goal of our paper is to provide extensive cross-country and time-series evidence on exchange rate pass-through into the import prices of 25 OECD countries. Using quarterly data from 1975 through 1999, we document the prevalence of PCP and LCP in short-run and long-run pass-through elasticities. We use an economically meaningful estimation approach, meaning that we estimate pass-through rates after controlling for exporter marginal cost shifters. At the level of an aggregated import bundle, the evidence across countries is strongly supportive of partial exchange rate pass-through in the short run (defined as one (1) The views expressed in this paper are those of the individual authors and do not necessarily reflect the position of the Federal Reserve Bank of New York or the Federal Reserve System. We thank Rudiger Dornbush, Richard Marston, Andrew Rose and Alwyn Young for helpful comments, as well as the seminar participants at various universities, the ASSA, NBER, BIS, and Federal Reserve Bank of New York. We also thank Leticia Alvarez and Glenda Oskar for their research assistance. Address correspondence to: Linda S. Goldberg, Federal Reserve Bank of NY, Research Department, 33 Liberty St, New York, N.Y. 10045. Tel: 212-720-2836; fax: 212-720-6831; email: Linda.Goldberg@ny.frb.org. (2) The implications of pass-through performance for optimal monetary policy also is explored in Corsetti and Pesenti (2001), Obstfeld (2000), Devereux (2000), and Devereux and Engel (2000), among others. (3) See Taylor (2001). The role of the invoicing decisions of producers in influencing pass-through rates is explored in recent work by Devereux and Engel (2001) and Bacchetta and vanWincoop (2001)..
(5) 2. quarter). The unweighted average of pass-through elasticities across the OECD countries is about 60 percent over one quarter, and about 75 percent over the longer term. The United States has among the lowest pass-through rates in the OECD, at about 25 percent in the short run and 40 percent over the longer run. Corresponding rates of pass-through into German import prices are approximately 60 percent in the short run and 80 percent in the long run. We find that rankings of elasticities are not tightly correlated with country size, especially when the composition of country import bundles differs substantially. At a more disaggregated industry level, we reach similar conclusions about the prevalence of partial pass-through into import prices. There is strong evidence against both PCP and LCP as short-run descriptions of pass-through into Manufacturing and Food import prices. With manufacturing trade now so pervasive for OECD countries, these results drive the partial pass-through observed in almost all countries. Non-manufacturing and Raw Material imports generally reject LCP, and are mixed on rejections of PCP. Such findings are consistent with intuition about pass-through rates into products that are often invoiced in dollars. The second goal of our paper is to provide insights into the forces underlying crosscountry differences in pass-through rates and changes in pass-through elasticities over time but within countries. An intriguing hypothesis posed by John Taylor (2001) is that passthrough of costs into markups is endogenous to a country’s inflation performance. The important implication is that there is a virtuous –but fragile– circle wherein low inflation (variability) leads to reduced markups, less inflationary implications of monetary expansions, and continued low markups. Taylor argues that if declines in pass-through are a product of the low inflation environment of recent years (which in turn is associated with less persistent inflation), recent gains in price stability can be fragile and potentially eliminated by adverse price shocks. As an alternative to this view, if pass-through rates decline due to more structural reasons such as declining pricing power of firms, the recent regime of price stability may be more robust. Similarly, even without changes in the competitive structures of industries, the pass-through elasticities on import baskets can change purely in line with changes in the composition of the import basket if the component products have distinct passthrough elasticities. Ultimately, we conclude that while the Taylor argument has some statistical merit when properly tested, it is not of first order importance for the low and medium inflation countries of the OECD. First, despite lower inflation in many OECD countries in recent years, declining exchange rate pass-through into import prices has not been a general feature of the OECD countries. Levels of pass-through by country are significantly higher in countries with higher nominal exchange rate variability –consistent with recent theoretical advances on the optimal choice of invoicing currency– but largely uncorrelated with levels of inflation, money growth rates, or aggregate country size. Although changes in some of these macro series are weakly correlated with changes in pass-through, these macro variables are not of first order importance in explaining pass-through evolution within the OECD over the past 25 years. Far more important for overall pass-through rates are changes in the composition of industries in a country’s import basket. In particular, the move away from energy as a high proportion of the import bundles, to a much higher share for manufactured products, has been the primary driver behind recent pass-through changes into import prices among numerous OECD countries (4). (4) Our focus should not be confused with that of related recent papers that attempt to explain the pass-through of exchange rates into a country’s CPI. In these papers, exchange rate movements lead to import price passthrough. These enter with weights into the aggregate CPI of countries, with the weights possibly to be adjusted to reflect distribution costs, as in Burstein, Neves and Rebelo (2001), or central bank reaction functions, as in Gagnon and Ihrig (2001)..
(6) 3. The industry composition of trade is more structural than is inflation performance. Consequently, those OECD countries that have brought down their pass-through elasticities through changes in trade composition have pass-through reductions (and consequent implications for monetary policy) that are more robust to the inflation regime. Monetary policy transmission therefore is expected to be robust to the extent that industry pass-through rates remain stable, mainly evolving with the product mix of each country’s trade.. 2. Exchange Rates and Prices: Similar Equations, Different Interpretations Analyses of exchange rates and price linkages have followed numerous paths, ranging from early macroeconomic debate on exchange rates and monetarism, to market integration or segmentation associated with the law of one price, to the role of market microstructure in the ability and desire of producers to price discriminate. Empirical tests of associated hypotheses revolve around the familiar equation:. Pt = E t Pt*. [1]. where Pt is the domestic price index, Et is the nominal exchange rate (defined as domestic currency per unit of foreign), and Pt* represents foreign prices. (Relative) purchasing power parity tests use price indices across countries to test whether this relationship holds. Law of One Price hypotheses test the same equation for individual goods traded across countries. As nicely discussed in P. Goldberg and Knetter (1997), costs of transportation or resale (such as trade barriers) might preclude price equalization but give rise to a stable wedge between indices. Exchange rate pass-through studies consider the extent to which exchange rate movements are passed-through into traded goods prices, versus absorbed in producer profit margins or markups. Often these studies look at indices of industrial concentration or market power to explain pass-through differences or pricing-to-market. The textbook definition of exchange rate pass-through (ERPT) is the percent change in local currency import prices resulting from a one percent change in the exchange rate between the exporting and importing country. Evidence on tests of this relationship rely on the γ estimates based on a simple equation. pt = γet + ε t. [2]. where all lower-cased variables are in logs and e is an error term (5). Despite its popularity, this reduced form equation (whether in log levels or growth rates) is problematic for hypothesis testing because it represents an non-structural statistical relationship. The micro-foundations of pricing behavior by exporters are a better starting point for generating the more economically meaningful specifications that are appropriate for hypothesis testing. The pricing equation of an exporter from country x –and its elasticity of. (5) The γ’s are background information for the monetary policy debate discussed in Taylor (2001) and provided in studies such as McCarthy (2000). While Taylor argues that exchange rate pass-through elasticities appear to have declined over time for countries that have reduced their inflation levels and inflation variability, there has been no systematic analysis verifying this assertion..
(7) 4. response to an exchange rate movement– depend on the structure of demand and costs confronting the exporter. If the import prices of country j, Pt m , j are the dependent variables, pricing rule of the foreign exporters x supplying j is: Pt m . j = E t Pt x, j = E t Mkuptx, j ( Pt m , j / Pt )C x, j (W t j ,Yt , E t ) where MKUPt x, j ≡. [3]. Pt x, j x, j , Cw > 0, CEx, j < 0, Cyx, j > 0. x, j Ct. In equation [3] Mkuptx, j represents the markup rate of prices over costs for the exporter. Markup rates are industry specific and depend on the demand curve facing exporters x in country j. This demand depends, in turn, on Pt m , j / Pt , the prices of imports relative to prices of country j producers. Ctx, j is the marginal cost function of the exporter in his own currency. This exporter marginal cost function is increasing in export market wages, W t x, j , and increasing in country j demand conditions Yt (6). The exchange rate is an argument in the exporter’s cost function to the extent that the exporter relies on imported inputs or has other costs that move with the relative value of the destination market currency (7). Differentiation of [3] yields an expression of the form . m , j E t CEx, j . . W t x, j Cwx, j . x, j ⋅Y t P t = 1 + x, j ⋅ E t + M K UPt + Cwx, j Ct . [4]. where “.” over a variable represents a percentage change. Equation [4] clearly demonstrates that empirical specifications that seek to isolate pass-through elasticities should introduce controls for the exogenous cost shifters entering into foreign exporter pricing decisions. Without such controls the measured relationship is a statistical correlation without specific economic interpretation in terms of exchange rate pass-through. Further manipulation of [4] gives microfounded intuition behind pass-through elasticities into import prices (8). Multiplying through by E t / Pt m , j and rearranging terms, the exchange rate pass-through elasticity γ is a function of the markup and foreign marginal cost elasticities, η and λ:. γ=. . m, j P t / Pt m , j where γ = . , E t / Et. 1+ λ 1− η. . M k uptm . j / < Markuptx, j η= ≤ 0 (negative . m. j . m, j ( P t / P t / Pt. [5]. for “normally . x, j C t / Ctx, j ≤0. demand, which is less convex than constant elasticity curves), and λ = . E t / Et. shaped”. (6) More precisely, one should include as the appropriate demand variable an index of income levels across the producer’s home market and the destination market for its exports. Since we have no information on the composition of demand facing exporters in different countries, our proxy here is the GDP of the importing country. (7) See Campa and Goldberg (1997), Feenstra (1998), and Hummels, Ishii and Yi (2001) for evidence on increasing reliance on imported inputs and vertical integration of production across countries. (8) Our thanks to Richard Marston for suggesting the inclusion of this elasticities interpretation..
(8) 5. Any force that makes foreign marginal costs more sensitive to exchange rates makes local currency import prices less sensitive to exchange rates. The intuition behind this statement is that an exporter that relies more on imported inputs has a smaller share of local value-added in costs that can fluctuate with exchange rates. Also, exporters facing highly elastic demand curves will pass-through a lower percentage of exchange rate changes into destination market prices. An example is the small exporter supplying a large market populated with local competitors. Clearly, exchange rate pass-through depends on the structure of competition in the industry, as has been exposited simply and eloquently in Dornbusch (1987) and Marston (1990), among others, and supported empirically by Knetter (1993) and Yang (1997).. 3. Exchange Rates and Import Prices: The Evidence A. The Data and Estimation Methodology We capture the arguments of equation [4] through a log-linear regression specification similar to that tested throughout the exchange rate pass-through literature (9): pt = α + δx t + γet + ϕZt + ε t. [6]. where pt are local currency import prices, et is the exchange rate, xt is a primary “control” variable representing exporter costs, and Zt is a vector of other controls, including real GDP of the destination market. Biased estimates of the pass-through coefficient could arise if foreign wages or GDP are correlated with exchange rates but omitted from the regression. Our approach considers pass-through into import prices of specific countries, as opposed to other careful empirical studies of exchange rate pass-through that focus exclusively on the export prices of individual products or baskets from a single country to a number of destination markets (10). We pursue the import price approach because it is the more relevant dependent variable in the debate on the inflationary consequences of exchange rate fluctuations. Our dependent variables are import unit value indices (aggregated across all imports, and disaggregated into major industry groups) for 25 OECD countries. The OECD compiles quarterly data on import price indices for OECD countries, with the series commencing around 1975 and ending in 1999. In addition to the country aggregates, the OECD also reports disaggregated import prices at the country level for five product categories: Food, Energy, Raw Materials, Manufacturing, and Non-Manufacturing products. Since we ultimately find that energy pass-through elasticities exhibit anomalous behavior, we delve further into the prices of disaggregated energy imports. For cross-country (9) P. Goldberg and Knetter (1997) overview the relationships between these studies. Beyond the industrial organization themes, there also are studies that allow for pass-through elasticities to differ between appreciation and depreciation periods (Swamy and Thurman 1994) or to be distinct for anticipated versus unanticipated exchange rate changes (Marston 1990). (10) Knetter (1993), Marston (1990), P.Goldberg and Knetter (1996), and Kasa (1992) use export prices or export unit values from specific countries to multiple destinations with the intent of identifying price discrimination or pricing to market activity. While important in cross-country research, price discrimination across markets also is a theme within countries and across cities. For example, see Engel and Rogers (1996)..
(9) 6. comparisons, data allow for further disaggregation into Steam Coal, Coking Coal, and Crude Oil (data source: International Energy Agency). Nominal exchange rates are from the International Financial Statistics (series neu), defined in our specifications as domestic currency per unit of foreign currencies (1/neu), so that home currency depreciations appear as increases in the nominal exchange rate series. The real GDP series used are those of the importing countries (source: International Financial Statistics). It is more difficult to find a primary control variable that captures the shifting relative costs of a country’s trading partners. We construct a consolidated export partners cost proxy by taking advantage of the IFS reporting of both real reu and nominal neu exchange rate series and computing W t x, j = neutj ⋅ Pt j / reutj by country in our sample. This gives us a measure of trading partner costs (over all partners x of importing country j), with each partner weighted by its importance in the importing country’s trade. For each of these country import price indices, the first stage of our analysis entails estimating short-run and long-run pass-through elasticities, γ, from equation (11) [6]. We estimate these elasticities across 25 countries, and perform tests for structural changes in the estimated pass-through rates during the sample period. We then run second-stage regressions to explain cross-country and time series differences in pass-through performance with explanatory variables that include monetary aggregates and also emphasize the importance of the composition of a country’s import bundle. The first-stage regressions are specified to generate pass-through elasticities and to follow equation [6], expressed in first-differences, with the addition of lagged exchange rate and foreign production cost terms to allow for the possibility of gradual adjustment of import prices to exchange rates (12): ±4. ±4. t. i=0. ∆ptj = α + ∑ atj ∆etj± i + ∑ bt j ∆w tj± i + c j ∆gdptj + ϑ yj. [7]. The short-run relationship between exchange rates and the import prices of country j is given by the estimated a0j coefficient. The long-run elasticity is given by the sum of the ±coefficients on the contemporaneous exchange rate and four lags of exchange rate 4 terms ∑ atj (13). t =0. (11) These elasticities have a direct economic interpretation, in contrast with the statistical measures that would be generated by an equation such as [2]. We nonetheless also generated statistical pass-through elasticities to determine whether these differed substantially from the elasticities reported in the text. The differences were sometimes substantial, but were not systematically positive or negative biased across countries. (12) We include up to three lags of exchange rates and foreign prices/production costs in the regression. Most of the pass-through response occurs over the first and second lags after an exchange rate change, so the interpretation of four quarters as long run is empirically validated. An alternative specification, which used a lagged dependent variable and relied on a partial adjustment model, generated very similar empirical results (not reported in this version of the paper). (13) While the theoretical antecedents of this equation are log-level relationships among variables, for estimation the variables in these equations are first-differenced to control for the possibility of unit roots in the time series variables contained in these specifications..
(10) 7. The estimation methodology applied is ordinary least squares on variables in log differences, selected after we performed extensive checks on the stationarity of series and on appropriateness of a cointegration approach (14). We were unable to reject the hypothesis that the (log) series of import prices, foreign costs, and effective exchange rates were nonstationary. We performed additional tests to determine whether these three variables were cointegrated, i.e. whether a linear combination of these variables resulted in a stationary process (15). Abstracting from the issue of low power of these tests, and despite predictions of theory, we rejected the cointegration hypothesis and consequently did not apply an error correction model. B. Exchange Rate Pass-Through into Import Prices Estimates of exchange rate pass-through into import prices for the OECD countries are presented in Table 1. Taking unweighted averages across countries, we find that average pass-through into import prices is 0.61 in the short-run and 0.77 in the long-run. These averages mask interesting cross-country differences in pass-through into import prices. The United States has relatively low pass-through, 26 percent within one quarter and about 41 percent over the longer run. Pass-through estimates for countries such as France, Germany, and Switzerland are closer to 60 percent in the short run and 80 percent over the longer run. Smaller European countries typically have even higher pass-through rates, but a precise relationship between pass-through and country size is not empirically significant. A recurrent issue in the macroeconomics literature is the prevalence of localcurrency price stability (LCP) versus producer-currency pricing (PCP). LCP represents a null hypothesis of zero pass-through while PCP implies a pass-through of unity. Table 2 summarizes our tests for the existence of local-currency pricing, producer-currency pricing, or partial pass-through into import prices. For countries in the OECD we overwhelmingly reject complete pass-through (or PCP) and zero pass-through (or LCP) as a description of aggregate import prices in the short run. Partial pass-through is the best description for import price responsiveness in the first quarter: elasticities of overall import prices are significantly different from zero in 22 out of 25 countries and significantly different from one for 20 out of 25 countries. In the longer run, pass-through elasticities are larger and closer to one, although complete pass-through or producer-currency pricing is still rejected in 9 out of 25 countries. Thus, while PCP is better supported as a longer-run characterization, it is still rejected for many OECD countries. Recently, numerous commentators have speculated that pass-through rates have been declining. We address this issue directly by performing two types of structural change tests on the pass-through elasticities. We first assume an exogenously imposed break point in the middle of the sample and perform Chow tests. In a second set of tests we allow for endogenously determined structural break points (16). (14) Dickey Fuller Unit root tests on the logarithmic values of the import price, foreign costs, and exchange rate series in an econometric specification, with time trends, reject the unit root hypothesis at the 5% level in only 3 of 150 instances. This is clearly below the statistical error for 150 specifications, which would be 7.5 rejections. We therefore accept that the (log) series of import prices, foreign costs, and effective exchange rates are nonstationary, with the strong caveat that these stationarity tests have low power. (15) We reject that the log real exchange rate is stationary and that the vector (1,1,-1) is a cointegrating vector as suggested by the theory on the real exchange rate. Of course, if there is a cointegrating vector it may differ from what this theory predicts. We run a model where p(t) = a + b*e(t) + c*w(t) + u(t), and compute û(t) = ρ* û(t-1) + e(t). We test whether the estimated coefficient, ρ, is different from unity, and rejected for only 11 cases the hypothesis that ρ is different from unity at the 5% level. This is slightly higher than the 7.5 instances that statistical error would suggest, but still very low. (16) Hansen (2001) provides a good critique of different types of structural change tests..
(11) 8. Table 1: Exchange Rate Pass-through into Import Prices Country. Full Sample Pass-Through Elasticities Short-Run. Change in Pass-through Elasticities 1999 versus 1989. Long-Run. Australia 0.55* + 0.69*+ Austria 1.22* 1.25 Belgium 0.16 + 0.71 Canada 0.65* + 0.68*+ Switzerland 0.67* + 0.94* Czech Republic 0.38* + 0.61* Germany 0.59* + 0.79* Denmark 0.56* + 0.68* Spain 0.66* + 0.56*+ Finland 0.69* + 0.82* France 0.53* + 1.21* United Kingdom 0.39* + 0.47*+ Greece 0.40 + –0.02+ Hungary 0.58* + 0.85* Ireland 0.79* 1.37* Iceland 1.18* 0.76* Italy 0.67* + 0.62* Japan 0.88* 1.26* Netherlands 0.75* + 0.77* Norway 0.51* + 0.79* New Zealand 0.47* + 0.62*+ Poland 0.50 0.99* Portugal 0.60* + 0.88* Sweden 0.67* + 0.59*+ USA 0.26* + 0.41*+ Average 0.61 0.77 # countries with pass-through increase (# significant) 8 (2) # countries with pass-through decrease (# significant) 16 (4). *, + Significantly different from zero or one at 5 percent level.. Short-Run. Long-Run. –0.05 0.68 1.02* 0.20 –0.09 --–0.32 –0.42 –0.40 –0.15 –0.82* 0.11 –0.61 0.87* –0.03 0.41 –0.52 –0.36* –0.18 –0.18 –0.39* 0.75 –0.04 –0.62* 0.18 –0.04 9 (1) 15 (5). 0.09 0.24 0.18 –0.23 0.09 --–0.12 –0.80* –0.94* –0.02 –1.00 0.11 –1.24 0.93* –1.17 0.19 –0.65 –0.76* –0.17 –0.19 –0.53* 0.22 –0.26 –0.45 0.10 –0.27.
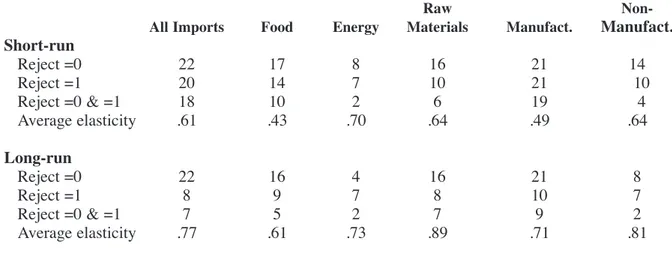
(12) 9. Table 2. Rejection of LCP or PCP for Import Prices Entries in table show number of countries for which hypothesis is rejected. Total number of countries is 25 for all imports, 24 for disaggregated products.. All Imports. Food. Energy. Raw Materials. Manufact.. Manufact.. Non-. Short-run Reject =0 Reject =1 Reject =0 & =1 Average elasticity. 22 20 18 .61. 17 14 10 .43. 8 7 2 .70. 16 10 6 .64. 21 21 19 .49. 14 10 4 .64. Long-run Reject =0 Reject =1 Reject =0 & =1 Average elasticity. 22 8 7 .77. 16 9 5 .61. 4 7 2 .73. 16 8 7 .89. 21 10 9 .71. 8 7 2 .81. In our implementation of the Chow-tests, we compare elasticities estimated over the first half of the sample, 1977 through 1989, with those from the full sample through 1999. The results from this split sample approach (shown in the rightmost columns of Table 1 and summarized in the bottom two rows of the table) tell a mixed story on the direction of change in pass-through across countries. Short-run exchange rate pass-through declined for 16 countries –4 cases with statistically significant declines– and increased in 8 countries. A similar pattern appears in the long-run elasticities. Thus, while Chow tests suggest that there has been a tendency toward declines in exchange rate pass-through across OECD countries, these tests also point to only a limited number of cases where these declines were statistically significant. Declining pass-through was not evident in the aggregate import prices of the United States. By contrast, Japan registered large declines in exchange rate pass-through into import prices. Overall, the Chow tests (with mid-point breaks) significantly reject structural stability for 6 of the 25 countries for pass-through coefficients over the aggregate import price series. For the second set of stability analyses, we test for the presence of structural breaks in pass-through using the method proposed by Andrews (1993) and Andrews and Ploberger (1994). These methods test for the existence of a structural break point in the stated relationship at some unknown date within the sample period. These tests have the advantage that the researcher does not need to specify a priori the date at which the structural break takes place. However, these tests are asymptotic and their power in our context is quite limited by the number of observations in our import price series (generally around 100 quarters per series). Indeed, as summarized in the last row of Table 3, we can never reject stability of long-run pass-through according to these tests. While short-run pass-through stability is also rejected for 9 countries, it is difficult to assign the timing of instability to a particular break date, suggesting that the instability is gradual rather than associated with a distinct point in time. The sample of 9 countries for which stability is indicated overlaps with, but is not identical to, the Chow test instability countries..
(13) 10. Table 3: Pass-Through Parameter Stability Entries in table show number of countries for which stability hypothesis is rejected. Total number of countries is 25 for all imports, 24 for disaggregated products. Chow Test Short-run instability Long-run instability Hansen Test Short-run instability Long-run instability. All Imports. Food. Energy. Raw Materials. Manufact.. NonManufact.. 9 6. 2 4. 2 1. 3 3. 5 4. 3 2. 9 0. 2 0. 4 0. 3 0. 5 0. 4 0. Next, we consider the degree and stability of exchange rate pass-through into the prices of the five available sub-aggregates of import prices reported by the OECD: Food, Energy, Raw Materials, Manufacturing Products, and Non-manufacturing Products (17). As summarized in Table 2, most industries exhibit a striking degree of partial pass-through. For all product categories with the exception of Energy, we reject the hypothesis of zero exchange rate pass-through (LCP) for more than half of the countries. For Manufacturing and Food, we similarly reject complete pass-through (PCP). The evidence in support of partial pass-through is strongest for Manufacturing imports, for which short-run pass-through differs significantly from both zero and one in 19 out of 24 countries. Food also exhibits partial pass-through in the short run. Local-currency pricing is often rejected for Non-Manufacturing and Raw Materials, but rejections of producer-currency pricing are more mixed across countries. The stability of pass-through into disaggregated import prices appears more robust than the stability into the aggregate import price series. This apparent stability helps provide a deeper understanding of the sources of fluctuations in pass-through into aggregate import prices. Indeed, the aggregate import price series could potentially evolve over time because of changes in the composition of the import bundles, rather than because of changes in the underlying pass-through elasticities on component products. For the underlying classes of imports we formally test for the stability of these pass-through elasticities by country. As summarized in Table 3, we never reject stability of the disaggregated pass-through coefficients for more than 5 countries, and the number is closer to 2 or 3 in any product category across 24 countries (18). By contrast, stability is rejected in 9 of the 25 cases for the aggregate import price series. These results are an indication that exchange rate pass-through rates for the sub-indices are more stable than the exchange rate pass-through for aggregated import prices. Finally, all of our tests showed that Energy imports have the most anomalous behavior among all the product categories, with country experiences varying considerably. For Energy imports, pass-through elasticities calculated using effective exchange rates are (17) Appendix Table 1 provides these estimates, by country. Another important issue with respect to monetary policy is the pass-through comparison for final goods prices versus imported intermediate goods prices (Obstfeld 2000). Energy and Raw Materials can be viewed as being closer to classification as imported intermediate goods than Food, Manufacturing, and Non-manufacturing Products. (18) Many of these instances of product category instability are attributed to data from New Zealand and Japan. Excluding these two countries, the number of countries for which there are rejects in the disaggregated data typically falls to 1 or 2..
(14) 11. noisy, but cluster either around zero (rejected in the short run for only 8 of 24 countries) or around one (rejected for 7 of 24 countries). Given the noise in the energy estimates of exchange rate, and the anecdotal evidence that energy markets are highly globally integrated with prices determined in U.S. dollars, we proceeded to a further examination of the Energy series. Specifically, we consider three available disaggregates of energy import prices: Oil, Coking Coal, and Steam Coal (19). Instead of using effective exchange rate series, we examined pass-through of bilateral local-currency exchange rates against the U.S. dollar. The resulting pass-through elasticities were much more precisely estimated for these disaggregated product categories. As reported in Appendix Tables 3A and 3B, bilateral dollar movements fully pass-through into local currency Oil prices. Coking Coal and Steam Coal, known to be more heterogeneous products because of their sulfur content and local standards, exhibit more varied rates of pass-through across countries. Overall, we again find that partial pass-through is a common phenomenon particularly among heterogeneous products. More homogeneous products have more extreme pass-through values.. 4. Exchange Rates and Import Prices: A Macro or Micro Phenomenon? The previous section demonstrated the prevalence of partial exchange rate passthrough into import prices, and the large cross-country and time-series variation in some elasticities. In this section we explore the empirical merits of alternative hypotheses posed in recent debates over the link between macroeconomic variables and pass-through. Given our breadth of data on aggregated and disaggregated import prices for OECD countries, we also pose an alternative explanation for time series changes in aggregate import price passthrough. Specifically, we consider the degree to which changes in aggregate import elasticities are attributable to movements over time in the composition of OECD imports. A. Macro determinants of pass-through Taylor (2000) hypothesized that the decline in average inflation rates in the developed world has also resulted in a decline in the degree in which firms pass-through changes in costs into prices for their final goods. By this view, all else equal, lower inflation leads to lower import price pass-through. The relationship between more stable monetary policy and pass-through also occurs in recent theoretical work by Devereux and Engel (2001) and Bacchetta and van Wincoop (2001) on optimal invoicing currency choice. If exporters set their prices in the currency of the country that has the most stable monetary policies, import prices in local currency terms would be more stable in countries with more stable monetary policy. All else equal, exchange rate pass-through would be higher for countries with more volatile monetary policy. Another reason for macro variables to influence pass-through is due to exporter competition for market share. As discussed in Froot and Klemperer (1989), exchange rate pass-through may be lower when nominal exchange rate variability is high and exporters to a country try to maintain local market share.. (19) See Appendix Table 3 for detailed results. The countries for which Oil import price data is used include: Australia, Austria, Belgium, Canada, Germany, Denmark, Spain, France, U.K., Greece, Italy, Japan, Netherlands, Norway, New Zealand, Portugal, and Sweden. We do not report pass-through for the U.S. import prices, since these tests are for currencies vis-à-vis the U.S. dollar..
(15) 12. Country size may be another important factor in ranking pass-through elasticities of countries. As initially exposited by Dornbusch (1987), exchange rate pass-through may be higher if the exporters are large in number relative to the presence of local competitors. One approximation to this point is that pass-through elasticities might be inversely related to country real GDP. An alternative approach would be to also consider measures of sectorspecific openness for countries. We test for the importance of these alternative hypotheses by running second-stage regressions over the short-run and long-run pass-through elasticities of OECD countries. The second-stage regression is given by. γ sri or lr = α + βx i + ε i. [8]. where xi is a vector representing all the exogenous regressors: country-specific average inflation rates, money growth rates, exchange rate volatility, and real GDP during the sample period. The bivariate and multivariate cross-country regressions use weighted least squares regressions of short and long-run elasticities. In this weighted least squares method, where we use as weights the inverse of the standard error of the estimated pass-through elasticities, noisy estimates receive less weight in the second-stage specifications. The time series variables used in constructing the right-hand-side macro variables are all measured quarterly over the sample period 1975:1 to 1999:4. These variables include: Money measured as the average annualized growth rate of the money supply (in logs); Inflation is average annualized inflation rate, based on consumer price indices (in logs); Exvol is the average of the quarterly squared changes in the nominal exchange rate; GDP is the nominal value in national currency deflated using the CPI deflator and converted into U.S. dollar at the average 1996 nominal exchange rate. The results of the second-stage panel regressions are presented in Table 4. These cross-country results, which do not have a time series component, show that country-specific rates of exchange rate pass-through into import prices are not significantly correlated with inflation or money growth. However, short-run elasticities are correlated with nominal exchange rate volatility: countries with more nominal volatility have higher pass-through rates. The result that lower nominal volatility is associated with lower pass-through is consistent with the main theoretical results of Devereux and Engel (2001) and Bacchetta and vanWincoop (2001). The role of country size, however, is insignificant in the rankings of pass-through rates across countries. Despite the observation that U.S. pass-through rates are quite low, across the OECD there is no systematic relationship between pass-through and a country’s real GDP. Some large countries have high pass-through (Japan) while some small countries have low pass-through (Czech Republic)..
(16) 13. Table 4. Determinants of Pass-Through Elasticities: Cross-Country Panel. A. Short-Run Elasticities of Aggregate Import Prices Constant Money. 0.536** (0.237) 0.022 (0.237). Inflation. 0.640** (0.145). 0.571*** (0.042). –0.026 (0.074). ExVol. 4.737*** (1.686). Real GDP AdjR2. 0.656*** (0.180). –0.04. –0.038. 0.223. –0.011 (0.030) –0.037. 0.683** (0.333) 0.173 (0.167) –0.252* (0.135) 5.875*** (1.828) –0.011 (0.030) 0.273. Table 4. B. Long-Run Elasticities of Aggregate Import Prices Constant Money Inflation. 0.737** (0.277) 0.003 (0.113) –0.088 (0.086). 0.912*** (0.171). ExVol. 0.744*** (0.054). 0.184 (2.041). Real GDP AdjR2 Nobs. 0.770*** (0.208). –0.043 25. 0.020 25. –0.043 25. –0.004 (0.034) –0.043 25. 0.657 (0.488) 0.432 (0.229) –0.435** (0.181) 0.788 (2.220) –0.022 (0.040) 0.071 25. ***, **, * indicate statistical significance at the 1, 5 and 10 percent levels, respectively. All regressions are weighted least squares.. While these cross-country results are especially interesting for currency invoicing hypotheses, the tests conducted are not the most appropriate ones for addressing the type of pass-through endogeneity exposited by Taylor (2000). For satisfying the latter objective, we abstract from other country-specific determinants of pass-through rates and ask whether changes to a country’s pass-through elasticities are systematically associated with changes in macroeconomic performance. The changes approach is particularly relevant since the macroeconomic indicators introduced in equation [8] have moved substantially during the past three decades for many OECD countries. For example, inflation rates and money growth were substantially larger during the first part of the sample than during the second. To capture the observation that the average behavior of some of these exogenous variables over the full period is not representative of behavior over shorter intervals, we split the full sample period into four subperiods: 1975:1 to 1980:4, 1981:1 to 1986:4, 1987:1 to 1992:4, and 1993:1 to 1999:4. For each subperiod, we run a first-stage regression of the type shown by equation [7] and consequently generate four estimates of the short and long-run pass-through elasticities of aggregated import prices for each country. We then apply a timeseries panel version of equation [8] as the second-stage specification. More precisely, we regress the estimated elasticities (4 per country, 25 countries) against the average value of the.
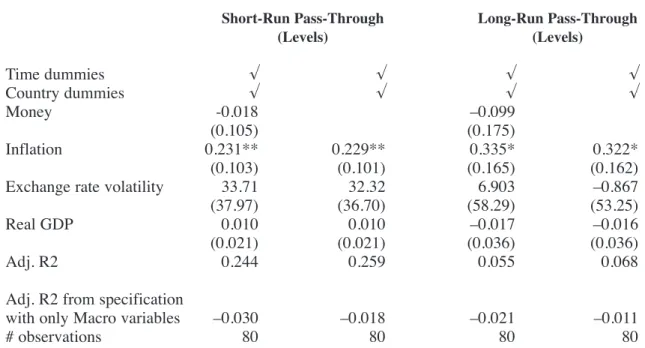
(17) 14. macroeconomic variables for each country during the respective time periods (20). We again use a weighted least squares procedure to reduce the importance of the noisier parameter estimates in driving overall conclusions (the weights are the inverse of the estimated standard error for each pass-through). Within this time-series panel approach, the second-stage regressions also include country and time dummies in order to account for other country and period-specific fixed effects that are not captured by the exogenous right-hand-side variables. The time-series panel results presented in Table 5 show the role of changes in macroeconomic determinants in driving changes in the short-run and long-run pass-through elasticities of OECD countries. Consistent with Taylor’s (2000) arguments, short-run passthrough is lower when a country achieves lower inflation, less money growth, or less exchange rate variability. Lower and more stable monetary conditions induce producers to pass on a smaller percentage of cost shocks into final goods prices. While money growth and exchange rate volatility do not appear to be statistically important in these multivariate regressions, this is mainly due to their high correlation with inflation, which is picking up the statistical contribution of both terms. Despite the joint statistical significance of these macroeconomic variables for the short-run specification, they account for a negligible amount of the variation over time in pass-through elasticities across countries. The order of magnitude of the impact of inflation changes on pass-through changes is low, especially in the context of the inflation ranges observed within the OECD: a one percentage point increase in the average inflation rate for a country is associated with a 0.0023 increase in pass-through. Indeed, F-tests show that these macro variables have no explanatory power for long-run pass-through rates across our OECD country sample. Table 5. Macroeconomic Determinants of Pass-Through: Time Series Panel Regressions Short-Run Pass-Through (Levels). Time dummies Country dummies Money Inflation Exchange rate volatility Real GDP Adj. R2 Adj. R2 from specification with only Macro variables # observations. √ √ -0.018 (0.105) 0.231** (0.103) 33.71 (37.97) 0.010 (0.021) 0.244 –0.030 80. √ √. Long-Run Pass-Through (Levels). 0.229** (0.101) 32.32 (36.70) 0.010 (0.021) 0.259. √ √ –0.099 (0.175) 0.335* (0.165) 6.903 (58.29) –0.017 (0.036) 0.055. √ √ 0.322* (0.162) –0.867 (53.25) –0.016 (0.036) 0.068. –0.018 80. –0.021 80. –0.011 80. ***, **, * indicate statistical significance at the 1, 5 and 10 percent levels, respectively. All regressions are weighted least squares.. (20) The GDP variable reflects the 1996 U.S. dollar value of each country’s GDP in 1978, 1984, 1990 and 1996..
(18) 15. B. The Role of the Composition of Trade An alternative explanation for changes in exchange rate pass-through into aggregate import prices may be the changes that have occurred in the composition of country imports. Composition shifts, operating over pass-through elasticities that differ across types of imports, could deliver changes in the pass-through elasticities on aggregate import prices. If a country shifts the content of its trade from industries with high pass-through elasticities into industries with lower elasticities, the country’s aggregate import pass-through elasticities will decline. Conversely, a shift to higher pass-through products would raise the overall passthrough elasticity of aggregated import prices. What is the empirical evidence on the changing composition of trade within the OECD? A decomposition of imports into the five product categories shows that composition changes have been substantial (21). The main force at work has been a tremendous rise in the relative importance of manufacturing imports, along with a reduction in the relative importance of energy. In 1980 manufacturing imports comprised more that 50 percent of the overall (merchandise) import bill for most countries (Appendix Table 4). The clear exceptions were countries heavily reliant on imported energy, notably Japan, followed by Italy and France. Japan also stood out among OECD countries for the relatively large share of raw materials in its imports. However, due to lower energy prices, changes in energy policies, and a dramatic growth of manufacturing trade, by the 1990s there was a striking cross-country shift in the composition of imports. By 1992 manufactured products accounted for more than 70 percent of the imports of many OECD countries, and often represented closer to 80 percent of the import bill. For France, manufactured products grew from 45 to 79 percent of imports. At the same time these countries experienced a clear decline in the share of energy products in total imports, as illustrated in Figure 1, and an almost identical increase in the share of manufacturing products. Since product categories have distinct (and relatively stable) passthrough rates, this shift in the relative importance of energy and manufacturing products in import volumes will be shown to account for a significant fraction of the changes observed in the pass-through elasticities into aggregated import prices across OECD countries. Figure 1. Decline of Energy Share in Imports, 1992 vs. 1980 Energy as a percent of total country imports in 1980 versus 1992 50 France. Italy. 45 40 35 30 Japan. 25. U.S.. 20 15. Canada. Denmark Finland Germany. Netherlands Norway. Times. A ustria. 10. Belgium Australia. Ireland UK. 5 0 By OECD Country. (21) These categories are defined by the availability of cross-country data on import prices..
(19) 16. To empirically determine the importance of import composition for pass-through rates, we introduce a trade composition effect directly into the time-series panel regressions. Specifically, for each country and time period we construct an “imputed aggregate passthrough elasticity” which captures the changes in a country’s aggregate pass-through elasticities specifically attributable exclusively to changes in the composition of its imports. The construct uses the time-invariant (full sample period) estimates of pass-through elasticities for each of the five industry groupings for each country. The imputed elasticity is constructed by varying over time the weights of each type of import in each country’s total import bundle. We use as weights the import share values at 1980, 1986, 1992, and 1998 (22). The imputed measure tracks reasonably well the pattern of pass-through declines observed in the actual pass-through estimates for the sample of countries for which comparisons are possible. The imputed measure generates declines for 10 of the 14 cases where declines were observed in the actual data. The imputed measure generates passthrough increases in 5 of the 7 cases where increased pass-through was observed in the actual data. The main reason for this decline in the aggregate import price elasticity is due to the decline in the relative weight in overall imports of energy and raw materials. These are the two products for which the import price elasticities were often highest. According to this calculation, the aggregate pass-through elasticity for the United States would have declined from 0.37 to 0.25 between 1980 and 1998 solely due to the change in the product composition of imports. For Italy, the decline would have been far more dramatic, from 0.87 to 0.62. C. Micro v. Macro Determinants of Exchange Rate Pass-Through As a final exercise, we run a horse race to statistically contrast the explanatory power of the micro versus macro variables for exchange rate pass-through movements over time and across countries. For most countries we have pass-through estimates at four intervals. We have imputed elasticities (from the disaggregated import data) for the 21 countries that had adequate trade share decompositions for our purposes. This composition effect is interpreted as a microeconomic force behind changes in aggregate exchange rate pass-through. The extended second-stage regression takes the form: ∆γ sr or lr = β1∆ ln money tj + β 2 ∆ ln inflationtj + β 3 ∆ ln exchevolt j + β 4 ∆ ln GDPt j. β 5 ∆ ln imputedt + α + α t + ν t j. i. [9]. j. where country and time dummies are included, and weighted least squares estimation is again applied. The results are reported in Table 6. Common time dummies, macro variables and imputed trade shares explain about 20 percent of the observed differences over time in the short-run pass-through elasticities of countries. The hypothesis of the joint insignificance of the macro variables cannot be rejected at the one percent level. Almost all of the explanatory power of the regressions comes from. (22) Availability of the appropriate disaggregated import data reduced the number of countries included..
(20) 17. the imputed trade elasticity variables, even though the composition arguments are made with only the coarsely disaggregated series that are available in the import price data. Trade composition effects are the clearly dominant explanation for movements over time in the short-run and long-run sensitivity of import prices to exchange rates. Table 6. Macro versus Micro Determinants of Pass-Through: Time Series Panels Short-Run Pass-Through (log Levels). Time dummies Country dummies Money Inflation Exchange rate volatility (x100) Trade Imputed Elasticity Real GDP Adj. R2 Adj. R2 from specification w/only Macro variables Adj.R2 from trade imputed elasticity only # obs. √ √ –0.169 (0.125) 0.101 (0.147) 3.965 (3.203) 2.505** (1.115) 0.011 (0.022) 0.21 –0.03 0.19 68. √ √. Long-Run Pass-Through (log Levels). 0.108 (0.148) 3.873 (3.236) 2.549** (1.126) 0.013 (0.022) 0.19. √ √ –0.310 (0.202) 0.220 (0.233) –0.171 (4.915) 1.643*** (0.848) –0.010 (0.040) 0.24. √ √ 0.212 (0.237) –0.508 (0.499) 1.590*** (0.861) –0.005 (0.040) 0.21. –0.02. –0.02. –0.01. 68. 0.19 69. 69. ***, **, * indicate statistical significance at the 1, 5 and 10 percent levels, respectively. All regressions are weighted least squares.. 5. Conclusions In this paper we have provided cross-country, time-series, and industry-specific evidence on the pass-through of exchange rates into import prices across a large sample of OECD countries. As a cross-country average, import prices in local currencies reflect 60 percent of exchange rate fluctuations in the short run, and nearly 80 percent over the long run. By contrast, exchange rate pass-through into U.S. import prices is 25 percent in the short run and 40 percent over the long run. For the OECD as a whole, partial pass-through is overwhelmingly the best description of import price responsiveness shortly after an exchange rate movement. In the longer run, pass-through elasticities are closer to one, although complete pass-through, or producer-currency pricing, is still rejected for many countries. Macroeconomic variables play a significant but limited role in explaining cross-country differences in levels of pass-through elasticities. Most notably, pass-through into import prices is lower for countries with low average inflation and low exchange rate variability. While there is evidence that pass-through rates have been declining over time in some countries, this pattern of pass-through decline has not been a common feature of all OECD countries. Short-run exchange rate pass-through elasticities rise with price inflation (or higher money growth rates). Despite statistical correlations, the quantitative importance.
(21) 18. of these macroeconomic effects have been small in the OECD. Recent arguments for virtuous cycles between inflation, money policy effectiveness and pass-through have not been of firstorder importance within the OECD countries. Observed changes in pass-through rates into aggregate import prices more closely reflect changes over time in the composition of import bundles of OECD countries. Passthrough elasticities for manufacturing products and food products are generally partial, so that both local-currency price stability and producer price stability are rejected for most countries. By contrast, energy and raw material imports appear to have pass-through elasticities closer to one. The shift in the import composition toward manufactures and away from energy and raw materials imports has contributed significantly to pass-through declines in about half of the OECD countries examined. These types of changes of pass-through into import prices –associated with widespread changes in the composition of industrial activity and trade– are likely to be more durable than those associated with the types of changes in macroeconomic policy environments observed in the OECD in recent decades.. References Andrews, D. W. K., 1993, “Tests for Parameter Instability and Structural Change With Unknown Change Point”, Econometrica 61, pp. 821-856. Andrews, D. W. K. and W. Ploberger, 1994, “Optimal Tests When a Nuisance Parameter Is Present Only Under the Alternative”, Econometrica 62, pp. 1383-1414. Bacchetta, Philippe and Eric vanWincoop, 2001, “A Theory of the Currency Denomination of International Trade”, Manuscript, November. Ball, Laurence, 1999, “Policy Rules for Open Economies”, in John Taylor (Ed.) Monetary Policy Rules (University of Chicago Press, Chicago), pp. 127-144. Burstein, Arie, Joao Neves and Sergio Rebelo, 2001, “Distribution Costs and Real Exchange Rate Dynamics During Exchange Rate Based Stabilizations”, Forthcoming Journal of Monetary Economics. Campa, José and Linda Goldberg, 1997, “The Evolving External Orientation of Manufacturing: Evidence from Four Countries”, Economic Policy Review (July, Federal Reserve Bank of New York), vol. 3, no. 2, pp. 53-81. Clarida, Richard, Jordi Gali and Mark Gertler, 1998, “Monetary Policy Rules in Practice: Some International Evidence”, European Economic Review, 42: 1033-67. Corsetti, Giancarlo and Paolo Pesenti, 2001, “International Dimensions of Optimal Monetary Policy”, NBER working paper #8230. Cunningham, Alastair and Andrew Haldane, 1999, “The Monetary Transmission Mechanism in the United Kingdom: Pass-Through and Policy Rules”, prepared for the 3rd Annual Conference of the Central Bank of Chile, September 21-22. Devereux, Michael, 2001, “Monetary Policy, Exchange Rate Flexibility and Exchange Rate Pass Through”, in Revisiting the Case for Flexible Exchange Rates (Bank of Canada), pp. 47-82..
(22) 19. Devereux, Michael and Charles Engel, 2000, “Monetary Policy in the Open Economy Revisited: Price Setting and Exchange Rate Flexibility”, National Bureau of Economic Research working paper no. 7665. Devereux, Michael and Charles Engel, 2001, “Endogenous Currency of Price Setting in a Dynamic Open Economy Model”, Manuscript, June. Dornbusch, R, “Exchange Rates and Prices”, American Economic Review 77 (March 1987), 93-106. Engel, Charles and John Rogers, 1996, “How Wide is the Border?” American Economic Review, Vol. 86, no. 5 (December), pp. 1112-25. Feenstra, Robert, 1998, Integration of Trade and Disintegration of production in the global economy”, The Journal of Economic Perspectives, vol. 12, pp. 31-50. Froot, Ken and Paul Klemperer, 1989, “Exchange Rate Pass-Through When Market Share Matters”, American Economic Review (September), pp. 637-54. Gagnon, Joseph and Jane Ihrig, 2001, “Monetary Policy and Exchange Rate Pass-Through”, Board of Governors of the Federal Reserve System, International Finance Discussion Papers #704 (July). Goldberg, Pinelopi and Michael Knetter, 1997, “Goods Prices and Exchange Rates: What Have we Learned?”, Journal of Economic Literature, vol. 35, pp. 1243-92. Hansen, Bruce E., 1997, “Approximate Asymptotic P Values for Structural Change Tests”, Journal of Business and Economic Statistics, January, 12:1, pp. 60-67. Hansen, Bruce E., 2001, “The New Econometrics of Structural Change: Dating Breaks in U.S. Labor Productivity”, Journal of Economic Perspectives, vol. 15, no. 4, Fall, 1999:4 pp. 117-128. Hummels, David, Jun Ishii and Kei-Mu Yi, 2001, “The Nature and Growth of Vertical Specialization in World Trade”, Journal of International Economics, June, vol. 54 (1), pp.75-96. Kasa, Kenneth, 1992, “Adjustment Costs and Pricing to Market”, Journal of International Economics, (February) vol. 32, no.1-2, pp. 1-30. Knetter, Michael, 1989, “Price Discrimination by U.S. and German Exporters”, American Economic Review, March, vol. 79, pp. 198-210. Knetter, Michael, 1993, “International Comparisons of Pricing to Market Behavior”, American Economic Review, June, vol. 83, pp. 473-86. Lane, Philip, 1997, “Inflation in Open Economies”, Journal of International Economics, vol. 42, pp. 327-347. Marston, Richard, 1990, “Pricing to Market in Japanese Manufacturing”, Journal of International Economics, Vol. 29, pp. 217-36..
(23) 20. McCarthy, Jonathan, 2000, “Pass-Through of Exchange Rates and Import Prices to Domestic Inflation in Some Industrialized Economies”, Federal Reserve Bank of New York Staff Report no. 3 (September). Obstfeld, Maurice, 2000, “International Macroeconomics: Beyond the Mundell-Fleming Model”, mimeo, December. Swamy, P. and Stephan Thurman, 1994, “Exchange Rate Episodes and the Pass-Through of Exchange Rates to Import Prices”, Journal of Policy Modeling, vol. 16 (6), pp. 609623. Taylor, John B, 2000, “Low Inflation, Pass-Through, and the Pricing Power of Firms”, European Economic Review, June, volume 44, issue 7, pp. 1389-1408. Yang, Jaiwen, 1997, “Exchange Rate Pass-Through into U.S. Manufacturing Industries”, Review of Economics and Statistics. vol. 79, pp. 95-104..
(24) 21. Data Appendix EXCHANGE RATE RATE PASS-THROUGH INTO IMPORT PRICES: MACRO OR MICRO PHENOMENON?. OECD import price series Source: OECD Statistical Compendium. Quarterly time series of import price indices in local currency for 1975:Q1 to 1999:Q4. For each country prices exist for five different product categories: Food, Energy, Raw Materials, Manufactures, NonManufacturing products. The countries for which data exist are: Australia, Austria, Belgium, Canada, Switzerland, Czech Republic, Germany, Denmark, Spain, Finland, France, United Kingdom, Greece, Hungary, Ireland, Iceland (only aggregate import prices available), Italy, Japan, Republic of Korea, Mexico, Netherlands, Norway, New Zealand, Poland, Portugal, Sweden, Turkey, United States. 10 of the 27 OECD country series had import price data ending in 1999. 5 countries had data ending in 1998, 1 in 1997, 2 in 1996, and 2 in 1995. We use 25 countries for the empirical work, excluding Korea, Turkey and Mexico for lack of effective exchange rate indices. Effective Exchange Rate Indices The nominal and real measures are index numbers defined in terms of domestic currency per units of foreign currency. The real effective exchange rate is calculated from Unit Labour Costs for developed countries by the IMF. Code in IFS database: neu (reu). Money Supply Defined as money in national currency, seasonally adjusted, with the exception of Sweden and the U.K., for which we have used a somewhat broader definition (money and quasi-money or M0). International Financial Statistics Code in IFS database: 66. Inflation Rate Annual inflation rate based on the consumer price indices from the International Financial Statistics. Code in IFS databse: 64. Disaggregated Energy Prices Oil prices are the average cost (in dollars/bbl) of total crude imports converted in national currency using the average quarterly nominal exchange rate. Data are quarterly from 1980:1 to 1999:4. Source: International Energy Agency. Steam and Coking Coal prices are the import cost (in U.S. dollar/tonne) converted to national currency using the average quarterly nominal exchange rate. Data are quarterly from 1980:1 to 1999:4. Source: International Energy Agency..
(25) 22. Appendix Table 1 EXCHANGE RATE RATE PASS-THROUGH INTO IMPORT PRICES: MACRO OR MICRO PHENOMENON?. Import Pass-through Elasticities (Statistical), 1975 - 1999 Country. Australia Austria Belgium Canada Switzerland Czech Republic Germany Denmark Spain Finland France United Kingdom Greece Hungary Ireland Iceland Italy Japan Netherlands Norway New Zealand Poland Portugal Sweden USA Average. Full Sample Pass-Through Elasticities. Change in Elasticities 1999 versus 1989. Short-Run. Long-Run. Short-Run. Long-Run. 0.548*+ 1.079* 0.658* 0.704*+ 0.597*+ 0.494*+ 0.497*+ 0.701*+ 0.727*+ 0.587*+ 0.562*+ 0.314*+ 0.300+ 0.464*+ 0.802* –0.012+ 0.747* 0.841* 0.737* 0.377*+ 0.582*+ 0.495*+ 0.559*+ 0.678*+ 0.184*+ 0.569. 0.596*+ 1 1.307* 0.706*+ 0.735*+ 0.801* 0.734* 1.419*+ 0.780* 0.450*+ 1.569*+ 0.564*+ 0.268 0.595*+ 1.443* –0.028+ 1.124* 1.177* 1.122* 0.337+ 0.767* 0.887* 1.086* 0.676* 0.292*+ 0.816. –0.010 0.600 0.154 0.114 –0.121 n.a. –0.272 –0.582* –0.281 –0.002 –0.479 0.112 –0.489 0.903* 0.016 1.142* –0.429 –0.397* –0.362 –0.270 –0.410* 0.163 0.007 –0.595* 0.256 –0.128. 0.161 0.469 0.021 –0.235 0.142 n.a. 0.021 –0.919* –0.382 0.324 –1.279* 0.063 –0.93 1.053* –1.105 0.441 –0.934* –0.725* –0.401 –0.26 –0.703* 0.31 0.374 –0.41 0.28 –0.224. * Significantly different from zero at the 5 percent level. + Significantly different from one at 5 percent level..
(26) 0.33*+ 0.02 0.11+ 0.84* 0.44*+ 0.45* 0.32*+ 0.65*+ 0.73*+ –0.17 0.78* 0.22*+ 0.39+ 0.73* 0.74* 0.50*+ 0.71*+ 0.29* 0.64* 0.52*+ 0.02+ 0.33 0.63*+ 0.08+ 0.43. 0.36*+ 0.39 0.64* 0.70* 0.80* 0.97* 0.48*+ 0.23* 0.64* 0.65 1.30* 0.52*+ 0.52 1.06* 1.31* 0.54*+ 0.73*+ 0.22+ –0.07+ 0.65* 0.12+ 0.90* 0.62 0.24+ 0.61. Long-Run. 0.45 1.58 –0.35 0.80 1.89*+ –0.55 1.51* 1.20*+ 0.86* 1.60 0.50 0.09+ 0.05+ –0.04+ 0.94* 1.11 1.08* 2.12* –0.08 0.02+ 0.07+ 0.38 0.96* 0.69 0.70. Short-Run. –0.30+ 3.06 –1.38 –0.39 2.68*+ 1.03 2.00* 0.93 –0.58+ 2.38 1.69 –0.05+ –1.29 0.92 1.92* –0.23 2.17*+ 2.18 0.09 0.53 0.19+ 0.02 0.03 –0.16+ 0.73. Long-Run. ENERGY. *Significantly different from zero (5%), + Significantly different from one (5%).. Australia Austria Belgium Canada Switzerland Czech Republic Germany Denmark Spain Finland France United Kingdom Greece Hungary Ireland Italy Japan Netherlands Norway New Zealand Poland Portugal Sweden United States average. Short-Run. FOOD. 0.52*+ 2.62 1.85* 0.64* 0.74*+ 0.99 1.11* 1.06* 1.12* 0.04 0.58*+ 0.06 0.86* 2.20*+ 0.92 0.80* 1.68* 0.39 0.45*+ –0.15+ 1.23* 0.45*+ 0.39*+ 0.89. 0.42*+ 0.21+ 0.72* 0.88* 1.13* 0.88* 1.20* 0.19 0.40*+ 0.02+ 1.07* 0.45*+ 0.06+ 0.64. Long-Run. 0.38*+ 1.39 0.84* 0.43+ 0.53*+ 0.60* 0.82* 1.08*+ 0.68* 0.39. Short-Run. RAW MATERIALS. 0.58*+ 1.02* 0.21+ 0.70*+ 0.63*+ 0.46*+ 0.40*+ 0.50*+ 0.60*+ –0.20+ 0.42*+ 0.41*+ 0.52*+ 0.52*+ 0.68* 0.54*+ 0.69*+ 0.29*+ 0.48*+ 0.43*+ 0.50 0.68*+ 0.63*+ 0.22*+ 0.50. Short-Run. 0.80*+ 0.63 0.58* 0.73*+ 0.85*. 0.51*+ 0.50*+ 0.67*+ 0.89* 0.66 1.06* 0.53*+ 0.24+ 0.68* 1.23* 0.74* 0.85* 0.29*+ 0.84* 0.62*+ 0.99* 0.96* 0.70* 0.49*+ 0.71. Long-Run. MANUFACTURING. Disaggregated Import Price Indices, Full Data Sample. EXCHANGE RATE RATE PASS-THROUGH INTO IMPORT PRICES: MACRO OR MICRO PHENOMENON?. Appendix Table 2. 0.47*+ 1.51* 0.11+ 0.68* 1.20* –0.04+ 0.97* 1.10*+ 0.87* 1.07 0.58 0.25*+ 0.20 0.24+ 0.76* 0.86* 0.94* 1.25* 0.31+ 0.43*+ 0.06+ 0.21 0.87* 0.46+ 0.64. 0.11+ 2.75* 0.44 0.37 2.18*+ 0.91 1.33* 0.88 0.14+ 1.62 1.29* 0.32+ -0.43 0.94* 1.70* 0.33 1.49*+ 1.41* 0.08 0.63 0.12+ 0.45 0.31 0.12+ 0.81. NONMANUFACTURING Short-Run Long-Run. 23.
(27) 24. Appendix Table 3A EXCHANGE RATE RATE PASS-THROUGH INTO IMPORT PRICES: MACRO OR MICRO PHENOMENON?. Exchange Rate Pass-Through into Energy Import Components (Constructed using Local Currency Import Price and LC/US$ exchange rate and world dollar price for the energy product) Oil Country. Australia Austria Belgium Canada Germany Denmark Spain Finland France U.K. Greece Ireland Italy Japan Netherlands Norway New Zealand Portugal Sweden Average. Short-run. Long-run. 1.29* 0.67* 0.68* 1.42* 0.87* 0.96 0.94*. 1.11* 0.92 0.91* 0.85 0.97* 0.92 0.98*. 1.05* 0.88* 0.84*. 1.07* 0.78* 0.76*. 0.88* 0.98* 0.84* 1.38 1.54* 1.62* 0.91* 1.04. 0.94* 1.42* 0.96* 2.93 1.03* 0.41 1.09* 1.06. Coking coal Short-run Long-run. Steam Coal Short-run Long-run. 0.88*. 1.08*. 0.87*. 1.18*. 0.14+ 2.90 1.09* 0.75 0.36*+ 0.18+. 0.39+ –4.01 1.15* 1.57 0.99*+ 0.98*. 0.73*+ 0.90*+ 0.82* 1.06* 0.93* 0.84*. 1.04* 1.05* 0.80* 0.19 0.70* 0.96*. 3.70 0.85* 0.96* 0.89*. 1.65 1.04* 1.09* 0.95*. 0.59* 1.07* 0.94* 0.99*. 0.70* 1.24* 1.06* 1.39*. 1.16 .68#. 0.63 1.03#. 0.89. 0.94. Significantly different from zero (5%); + Significantly different from one (5%). # excludes Denmark and Ireland.. Appendix Table 3B Rejection of LCP or PCP for Energy Import Prices on dollar movements (Entries in table show number of countries for which hypothesis is rejected) Oil (of 17 countries). Short-run Reject =0 Reject =1 Reject =0&=1 Average Long-run Reject =0 Reject =1 Reject =0& =1 Average. Coking Coal (of 11 countries). Steam Coal (of 11 countries). 15 0 0 1.04. 6 3 1 1.15. 11 2 2 0.89. 12 0 0 1.06. 7 2 1 0.63. 10 0 0 0.94.
(28) 25. Appendix Table 4 EXCHANGE RATE RATE PASS-THROUGH INTO IMPORT PRICES: MACRO OR MICRO PHENOMENON?. Share of total imports by major product category Country. Australia Austria Belgium Canada Germany Denmark Spain Finland France U. Kingdom Hungary Ireland Iceland Italy Japan Netherlands Norway New Zealand Poland Portugal Sweden United States. 1980. Food 1992. 5.38 5.97 10.25 0.00 10.86 10.24 n.a. 6.77 0.00 12.02 n.a. 11.61 n.a. 0.00 10.45 12.60 6.63 n.a. n.a. n.a. 6.78 7.58. 4.61 4.89 9.93 6.11 9.63 12.85 10.93 5.82 9.44 10.65 5.50 11.29 9.44 11.80 15.97 11.77 6.13 6.62 10.65 11.07 7.13 5.27. Energy 1980 1992. 13.78 15.44 17.49 19.17 22.53 22.49 n.a. 28.58 55.45 13.29 n.a. 14.80 n.a. 55.76 49.79 23.79 17.31 n.a. n.a. n.a. 24.17 33.86. 5.83 5.13 7.58 4.34 7.46 6.14 10.06 12.85 7.97 5.57 15.01 5.19 8.31 8.46 22.65 8.53 3.42 6.54 16.81 8.16 8.67 10.28. Raw Materials 1980 1992. Manufacturing 1980 1992. 4.72 7.09 7.69 9.65 8.29 6.57 n.a. 5.57 0.00 7.46 n.a. 3.59 n.a. 0.00 16.91 7.14 8.89 n.a. n.a. n.a. 4.61 4.51. 74.31 71.34 61.61 71.18 55.83 59.41 n.a. 58.82 44.55 64.35 n.a. 67.50 n.a. 40.74 21.75 55.08 66.80 n.a. n.a. n.a. 64.03 51.10. 2.88 4.32 5.36 3.30 4.74 4.23 5.35 7.55 3.50 4.06 4.11 2.52 5.06 7.23 11.11 4.88 7.13 4.08 6.12 4.58 3.80 2.82. 84.51 85.61 70.83 82.96 75.99 73.98 73.36 73.75 78.81 78.38 75.36 78.17 76.98 67.80 47.97 74.60 83.21 82.69 66.35 75.77 79.76 77.84. Nonmanufacturing 1980 1992. 1.81 0.16 2.96 0.00 2.50 1.30 n.a. 0.27 0.00 2.88 n.a. 2.49 n.a. 3.50 1.10 1.38 0.37 n.a. n.a. n.a. 0.41 2.95. 2.17 0.06 6.29 3.29 2.18 2.80 0.29 0.03 0.29 1.34 0.01 2.83 0.21 4.72 2.30 0.21 0.11 0.07 0.07 0.43 0.64 3.79. Share of food includes imports in SITCs 0 and 1, Raw Materials includes SITCs 3 and 4, Energy includes SITC 3, Manufacturing includes SITCs 5, 6, 7, and 8, and Non-Manufacturing includes SITC 9..
(29) Australia Austria Belgium Canada Switzerland Czech Republic Germany Denmark Spain Finland France United Kingdom Greece Hungary Ireland Italy Japan Netherlands Norway New Zealand Poland Portugal Sweden United States average. –0.053 0.360 –0.243 –0.338 –0.009 0.232 –0.001 0.128 0.077 0.222 –0.003 0.077 0.138 0.143 0.014 –0.397 –0.047 0.040 0.189 –0.190 0.018 0.342 –0.172 0.005 0.024. Short-Run. 0.009 0.343 –0.608 –0.312 0.010 –1.673 –0.193 0.209 0.063 0.158 –0.020 0.099 0.123 0.293 –0.079 –0.315 –0.075 0.040 0.150 –0.205 –0.078 0.347 –0.126 –0.007 –0.077. Long-Run. FOOD. –0.039 –0.813 1.080 0.392 –0.109 1.658 –0.435 –0.390 0.100 1.052 –0.585 –0.070 0.248 0.483 –0.595 –1.637 –0.535 –0.254 0.822 0.199 0.015 –0.287 0.221 0.932 0.061. Short-Run. –0.158 –1.659 1.497 0.434 –0.471 0.917 –1.597 –0.761 –0.067 0.746 –1.056 –0.253 0.289 0.709 –1.928 –2.754 –1.068 –1.176 0.904 0.186 –0.189 –0.725 –0.002 1.303 –0.279. Long-Run. ENERGY. 0.168 –0.180 0.651 0.016 –0.057 –0.697 –0.471 0.051 0.057 0.349 –0.354 0.129 0.207 –0.023 –0.049 –0.228 0.159 0.493 –0.072 0.015 0.030 –0.001 0.115 0.009. –0.027 0.168 0.295 –0.045 –0.215 –0.221 –0.134 0.483 –0.054 0.030 –0.109 –0.070 0.064 0.000. Long-Run. 0.042 –0.187 0.514 0.105 –0.067 –0.848 –0.265 –0.081 0.056 0.507. Short-Run. RAW MATERIALS. –0.051 –0.023 0.201 0.003 –0.017 0.083 –0.097 0.057 –0.031 –0.267 –0.042 0.003 0.100 0.657 0.105 –0.141 –0.104 0.041 0.123 –0.110 –0.444 0.100 –0.210 –0.034 –0.002. Short-Run. 0.017 –0.013 0.185 0.006 0.006 0.120 –0.183 0.227 –0.005 –0.152 0.021 0.048 0.127 1.021 –0.119 –0.090 –0.136 0.040 0.139 –0.130 –0.120 0.108 –0.153 0.032 0.036. Long-Run. MANUFACTURING. Change over time in Disaggregated Import Price Pass-Through Elasticities (1999-1989). EXCHANGE RATE RATE PASS-THROUGH INTO IMPORT PRICES: MACRO OR MICRO PHENOMENON?. Appendix Table 5. 0.032 –0.533 0.273 0.125 –0.031 –0.849 –0.295 –0.100 0.055 0.594 –0.266 –0.026 0.220 0.329 –0.350 –0.489 –0.329 –0.128 0.400 0.068 0.056 0.168 –0.099 0.549 –0.023. 0.012 –1.054 0.320 0.017 –0.337 0.038 –1.059 0.023 –0.029 0.419 –0.420 –0.296 0.160 0.462 –1.233 –0.807 –0.619 –0.435 0.409 0.052 –0.069 0.171 –0.225 0.679 –0.156. NONMANUFACTURING Short-Run Long-Run. 26.
(30)
Figure


+4


Related documents
e) In 2001, New Yorkers witnessed the biggest terrorist attack in the history 35-39. sorularda, verilen cümleleri tamamlayan en iyi ifadeyi bulunuz. sorularda, verilen cümlelerin
Unemployment and Subjective Well-being Among the Youth: Evidence from a Longitudinal Study in Poland
This approach allows us to check if the individual change in labour market status translates into changes in individual subjective well-being, and how the changes in
The fact that no specific course was required in all programs also means that the focus of the concentration can change significantly depending on the individual school and
court would then apply the reasonable basis test for factual compelled speech, or the Central Hudson or the strict scrutiny tests for opinion speech, depends on the
• Training via 36 on-demand webstreams or current webinars/year • Access to dozens of proprietary publications, models, resources • 1,000 uses of online course training
Skin Contact : Immediately flush skin with plenty of soap and water for at least 15 minutes while removing contaminated clothing and shoes.. Get medical attention if
These include heuristic, deterministic, and hybrid optimization methods and classical mathematical optimization procedures, such as, firstly, mixed-integer linear programming
This paper contributes towards exploring the technical and institutional feasibility of small hydropower storage and pumped-storage schemes in Switzerland.. Within the European
