A framework for distributed collaborative
automotive testing
Mathias Johanson
Alkit Communications AB
[email protected]
Lennart Karlsson
Luleå University of Technology
Division of Computer Aided Design
[email protected]
Abstract
In this paper we explore the opportunities of improving the testing and verification phases of product development in the automotive industry, through a combination of broadband telematic services and tools and methods for distributed collaborative engineering. The development of a prototype system for remote vehicle testing is described, and experiences from experimental usage of the system at an automotive winter testing facility are reported. The prototype system supports real time communication of audio, video and measurement data from a vehicle at a test track, to a remote location such as an automotive company's development site. Initial results from using the system are promising, indicating a clear potential of improving the testing and verification phases of product development within the automotive sector, which will be essential in the future in order to meet demands on shortened development cycles and increased testing needs.
1 Introduction
The need for testing and verification of products in the automotive industry is growing due to the increasing complexity of electronic control systems in modern vehicles [1, 2]. Since testing and verification is expensive in terms of prototypes and personnel, simply increasing the volume of the testing can be prohibitively costly. Moreover, since product development cycles must be shortened in order to take new products quicker to the market, lesser and lesser time is available for testing and verification. In addition to this, automotive testing facilities are commonly located in remote rural areas, due to the need for extreme climate conditions and privacy, and as a result, a significant part of the budget for automotive testing expeditions is the traveling costs for the engineers. In response, the testing and verification processes must be made more efficient, reducing the need for more prototypes, and reducing the need to send test engineers to remote locations for extended periods of time. To accomplish this, we propose a framework for distributed collaborative automotive testing, based on a combination of broadband telematic services and tools for distributed collaborative engineering. The general idea is to enable automotive test engineers to participate in vehicle testing without having to be physically present at the proving ground. The hypothesis is that a significant amount of a test engineer's work can be performed using broadband networks and customized collaboration tools for interpersonal communication and data sharing. In order to explore this hypothesis, an automotive winter testing facility in northern Sweden was equipped with a wireless network infrastructure, which was interconnected with the Internet through a high bandwidth fibreoptic link. The wireless network makes it possible to transmit measurement data in real time from a car at the test track, to a server located at the proving ground. The server stores the measurement data in a database, and also acts as a redistribution gateway making it possible to access the data from a remote location, typically from the development site of the car manufacturer conducting the tests. In addition to wireless measurement data communication, live video can be transmitted from a camera installed in a car, giving remote test engineers visual feedback from the moving car. An audio connection with the car is also available, so that a remote engineer can talk directly to the driver of the car.
Different kinds of data visualization tools are used to monitor and analyze the measurement data. In the case study described in this paper, a 3D visualization tool for analysis of temperature data from climate tests was used in combination with 2D plots and numeric presentation of measurement data from temperature sensors. To facilitate high quality interpersonal communication between the engineers at the proving ground, and the engineers at the development site, a software suite of synchronous collaboration tools was used, providing high quality videoconferencing, application sharing, and data
sharing functionality. Since the communication between the proving ground and the development site is a public Internet connection, strong data encryption is employed to secure the communication.
2 Pilot study
The pilot test case was conducted in collaboration between Volvo Car Corporation and Luleå University of Technology. The system was installed at Arctic Falls proving ground in Älvsbyn in northern Sweden, and at Volvo Car Corporation's development site in Gothenburg, in the southwest of Sweden. The distance between Älvsbyn and Gothenburg is approximately 1500 km. The pilot case chosen was climate testing, involving transmission of temperature data from the cars for real time visualization and analysis. Climate tests were chosen as the pilot case primarily because temperature data are suitable for real time presentation.
For the pilot study, three Volvo cars were equipped with temperature sensors and measurement data collection systems running on laptop computers. Each car transmitted up to 64 measurement channels, with a sampling frequency of 1 Hz.
Experiments were also performed with video communication from a car at the test track. A video camera was mounted in the car, facing the windshield, making it possible for a remote engineer to get a first person video view from the car. An audio communication tool was also available, making it possible to talk to the driver (or a passenger) wearing a headset.
3 Overview of the framework
The main components of the technological framework for distributed collaborative testing are: a wireless network infrastructure at the test site, a broadband network link interconnecting the test site and the development site, a measurement data collection and communication tool, measurement data visualization and analysis tools, live audio and video streaming tools, and a suite of tools for distributed collaborative work.
3.1 The wireless network
The wireless network installed at the proving ground is an IEEE 802.11b wireless LAN (WLAN) infrastructure, giving a theoretical maximum bandwidth of 11 Mbps. Five antenna masts cover the test tracks, resulting in more or less 100% coverage. The effective bandwidth is high enough to support transmission of several simultaneous measurement channels, from several cars (with a reasonable data sampling frequency), and the wireless network can also support video and audio streams from the cars. Since wireless networks are prone to illicit eavesdropping, and since the built-in encryption in the IEEE 802.11 standard (WEP) is considered too weak for potentially sensitive measurement data, a Virtual Private Network (VPN) [3] client software is installed on the data acquisition systems in the cars, providing strong encryption of all data transmitted over the network.
3.2 Data acquisition and transmission
Measurement data from temperature sensors in the cars are stored locally, and also presented graphically, on the data acquisition systems in the cars, in addition to being transmitted over the wireless network. This makes it possible to monitor data in the car while the test is conducted. Moreover, no data will be lost if the wireless link fails.
The system can collect other kinds of measurement data; for instance accelerometer and GPS positioning data have been tested.
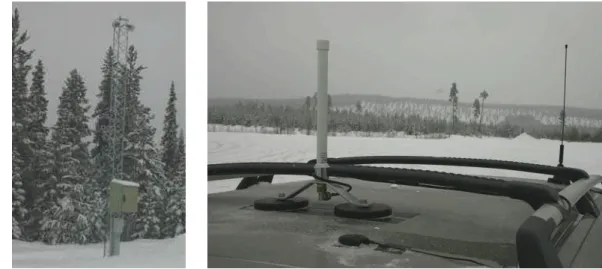
The data acquisition systems are equipped with WLAN cards that are connected to an external antenna, for enhanced radio signal characteristics. A picture of an antenna mounted on the roof of a car is given in Figure 1.
The real time exchange of measurement data is carried out using the ASAP-3 protocol, developed by the working group on standardization of application systems of the Association of Standardization of Automation and Measuring Systems (ASAM) [4].
Figure 1 Wireless network antennae.
Left: Access point antenna mast, Right: Car-mounted antennae
3.3 Broadband network connection
The test site and the development site are interconnected by a broadband IP network infrastructure. For the purpose of the test case presented in this paper, Arctic Falls proving ground in Älvsbyn in the north of Sweden, and Volvo Car Corporation's development site in Gothenburg were connected to the Swedish university network [5] using 100 Mbps FastEthernet connections. Consequently, the bandwidth available between the two sites is high enough to support high quality video communication, in addition to the real-time data.
Since the network is in fact a part of the public Internet, a number of security issues must be considered. To begin with, firewalls are installed at each site, to protect from intrusion. Moreover, to ensure privacy and integrity of data, the same VPN solution chosen to protect the wireless communication is also used over the Internet connection. Tunneling all traffic through VPN not only gives strong encryption of data, but also simplifies firewall traversal and avoids problems related to network address translation issues.
3.4 Data visualization and analysis tools
Measurement data can be visualized in real time in different ways, depending on the type of test and on user preference. In the pilot study, three different visualization techniques were used for presentation of temperature measurement data in real time:
3.4.1 Excel presentation
Measurement data are presented as 2D graphs and numerical values in Microsoft's Excel, using a Visual Basic plug-in that imports data in real time from the data acquisition systems, using ASAP-3. An example of temperature measurement plots in Excel is shown in Figure 2.
The main advantage with this type of presentation is ease of use of the application, due to the users being familiar with Excel in their day-to-day work. It is also very straightforward to export graphs and tables of measurement data to reports. The main drawback is that it is difficult to get around quirks and oddities in Excel, and the visualization possibilities are rather limited. It is also a platform dependent solution, limited to machines running the Windows operating system.
3.4.2 Web browser presentation
A web-based interface was also used to present 2D plots of measurement data. In this approach, a Java applet in a web page fetches the measurement data from the data distribution server at the proving ground, which in turn fetches the data from the data acquisition systems in the cars. In this case, the server can also store data, for later access.
The main benefit of this solution is ease of access to data: any Internet-connected computer with a web browser can be used to visualize data. It is also a platform independent solution.
Figure 2 2D data presentation tools:
Left: Excel presentation of temperature data, Right: Web-based Java presentation of temperature data and accelerometer plot
3.4.3 3D presentation
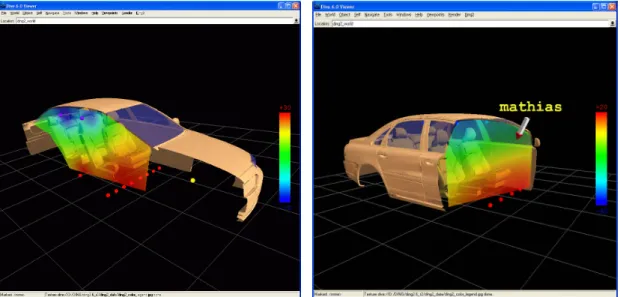
A 3D visualization tool is used to visualize temperature data as colors in a clipping plane through a geometry model of the car. The visualization tool, previously described by Törlind [6], is based on a multiuser VR system [7], allowing many simultaneous users to connect and visualize data. Each user can have his/her own viewpoint, inspecting data independently, or all viewpoints can be synchronized for collaborative analysis and discussion. The temperature is interpolated from the measurement data given by the sensors inside the car. The sensors are represented by small spheres in the 3D model, and the interpolated temperature values are visualized in a clipping plane with a color map representing the temperature from blue (coldest) to red (hottest). A screen shot of the 3D visualization tool is shown in Figure 3.
The 3D visualization tool is both a tool for data presentation and a true distributed collaboration tool. Each user's viewpoint in the virtual world is represented by an iconic avatar in the shape of a cone pointing in the viewpoint direction. Thus, each user gets an awareness of the other users' actions, and interaction support mechanisms like shared pointers and view synchronization are available to facilitate collaborative analysis of data.
The main benefit of the 3D visualization tool is that it is easy to get an overview of the temperature distribution in the car. Drawbacks are that you only get an instantaneous view of the temperature, whereas a 2D temperature plot also gives you the development of temperature over time. Another drawback noted is that climate test engineers currently are not used to this kind of advanced visualization tools, but this might change once they are familiarized with the technology.
3.5 Collaboration tools
A suite of software tools for distributed collaborative work, known as the Confero suite [8], supports high quality interactive communication between test engineers at the test site and engineers at the development site. A continuously open video link, with high quality video cameras and high quality projection systems (two 50" plasma screens at Arctic Falls, two projectors at Volvo), between the two sites gives the remote team members a feeling of presence, and an unintrusive awareness of what was going on at the test site. The high quality audio conferencing system, using echo-canceling omnidirectional microphones, makes it possible for all persons present at the two sites to talk to each other in an unrestricted and relaxed way.
By using a multipoint conferencing gateway known as a reflector, acting as a relay point for all audiovisual communication, the collaboration session can easily be extended with more participants. In the trials, up to six sites connected to the collaboration session using audio and video.
Except for audiovisual communication support, the collaboration software also makes it possible for the users to share applications, through a generic application sharing mechanism. Two or more users can work jointly on the same document, or look at and interact with the same data, even if the data analysis tool in itself doesn't provide a collaborative mode. The collaboration software also supports synchronous file sharing (useful for instance for sending large measurement datasets back to the development site), instant text messaging, and shared playback of multimedia objects.
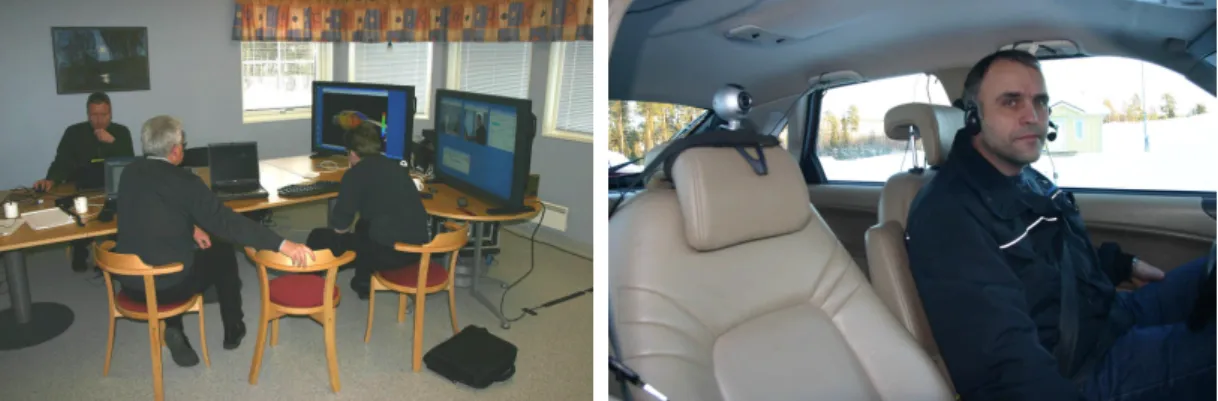
The collaboration studio at Arctic Falls is shown in Figure 4.
3.6 Voice and video communication with the car
Voice communication with the cars at the test range is supported through a customized light-weight version of the audio communication tool of the Confero suite, running on the measurement data collection system in the car. The driver of the car uses a headset to communicate, in order to get both hands free for controlling the car. Voice quality is substantially better than telephony quality, and since all communication is using the same network transport, the voice communication is protected by the same encryption techniques as the measurement data.
Through a digital video camera installed in the car, a remote engineer can get a first person video view from the car. Both the video and audio signals can be stored to disk for later playback.
The real time audio and video communication tools installed in the car are fully integrated with the collaboration tool used for high quality communication between the test site and the development site. Consequently, all participants of the collaboration session can talk directly to the driver of the car, and see live video from the car.
A picture from the interior of a car equipped with audio and video devices is shown in Figure 4.
Figure 4 The collaboration studio at Arctic Falls proving ground (left), and a car equipped with voice and video communication devices (right)
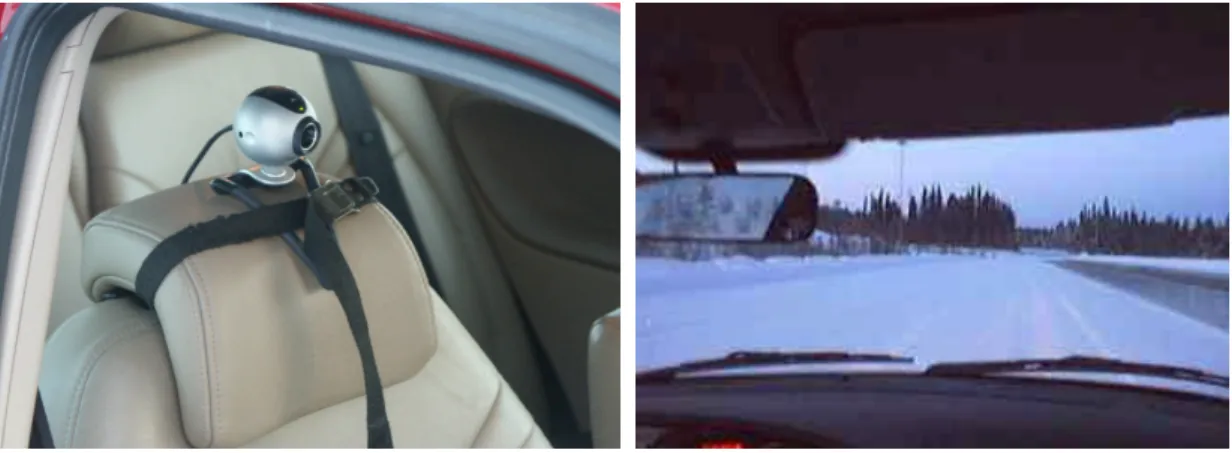
Figure 5 Camera mounted in the car (left) and view from camera (right)
4 Results from pilot study and experimental use
The pilot study proved that the concept for distributed collaborative engineering in automotive testing is feasible, and revealed a great potential of improving the efficiency of the testing and verification process. It is important to stress that in order to achieve measurable effects in terms of shortened development cycles and decreased cost of test expeditions, new work processes must be developed and implemented in the automotive companies, taking advantage of the opportunities given by the new technology. Some of the effects we can foresee after the pilot study are summarized below.
One of the most important effects noted in the pilot study, is the opportunity the technology gives to engage people directly in the testing process, who normally would be involved at a much later stage, typically after the testing is finished. To illustrate this, at one point in the climate expedition of the pilot study, the designer of an air nozzle was asked to visit the collaboration studio at the development site to talk directly to the test engineers conducting a heating test at the proving ground. The designer would normally see the measurement data from the expedition a day or two after the test, but in the current situation, he could see temperature measurements in real time, visualized in the 3D model, and presented as 2D graphs. From the live data he could conclude that the configuration of the nozzle was incorrect, and he could ask the driver of the car – who for this particular test was equipped with temperature sensors on his feet – what it felt like, and then instruct an engineer to change the configuration of the nozzle. After reconfiguration, the test was repeated, and the designer could see from the measurement data that the temperature was now more equal at the driver's left and right foot, and he could verify this with the driver, using the voice link. With the traditional way of working, the nozzle designer would see the measurement data at best the day after the test, and the test would then have to be redone the next day, with the new configuration of the nozzle. With the distributed mode of work, the faulty configuration could be corrected at once, during the test, saving time. For more complicated re-configuration procedures, live video from the car can be useful, in that the driver (or someone else) can use a handheld camera to show the remote engineer the current configuration of some component, simplifying for the remote engineer to assist with the reconfiguration.
In addition to making it possible to transmit measurement data from the cars at the test track to the development site of the car manufacturer, the wireless network at the proving ground also gives an opportunity for the test engineers to relay measurement data between the cars. In the climate tests of the pilot study, it proved to be very useful for the test engineers riding in the cars to be able to access and visualize measurement data (in this case temperature values) from the other cars, for comparative analysis. In climate testing, comparative studies of different climate control systems is very common. With the traditional mode of work, the climate test engineers compare measurement data from the different cars after the test is finished. When wireless measurement data exchange between the cars is available, the comparative test was finished when the test ended, and hence time could be saved in the overall testing process.
In validation of climate control systems, subjective testing is an important component, as a complement to objective temperature measurement collection. This means that climate testers ride with the cars to experience the subjective impression of the climate in the car. In the pilot study, voice communication with the cars was found to support the subjective testing process. Using the voice link, the test engineers can be asked what it feels like in the car in different phases of a test. Previously, a VHF radio system has been used for this purpose. The benefit of the voice over IP solution tested in the pilot
study is that it provides encryption of the voice channel, using the same algorithm as for the measurement data, and that it can be easily integrated with the videoconferencing tool used for communication to remote sites. There is also a possibility to store the voice to disk, synchronized with the measurement data. This makes it possible to attach verbal comments to the data being logged, providing context to the data, which can help the interpretation of the data during analysis. In the same fashion, the live video feed from a car can also be stored, providing even more context to the data. As previously discussed, three different visualization techniques for temperature data presentation was used in the pilot study: 2D plots in Microsoft Excel, 2D plots in a Java-based web page, and color-coded presentation in a 3D model of a car. The climate test engineers of the pilot study expressed concerns about the practical usefulness of the 3D presentation. This might depend on the fact that the test engineers had little or no experience of 3D visualization systems, and were much more used to 2D plots of temperature data. However, the 3D presentation does have a number of drawbacks: Firstly, the 3D presentation only provides a view of the current temperature, there is no history, as is the case with a 2D curve, where you can easily see the development of temperature over time. Secondly, the 3D presentation does not easily support visualization of a reference value, such as the temperature that the climate control system is currently set to. This is commonly added to the 2D plots to see how well the measured temperature corresponds to the desired temperature. The main advantage, as acknowledged by the climate test engineers, is that the 3D presentation gives a very good overview of the temperature distribution in the car.
The possibility of getting a live video feed from a car was highly appreciated by the remote engineers, as it gave a very good feeling of presence, and an awareness of what was going on during a test. The positioning of the camera can be changed depending on what view is most useful for the remote engineer for each particular test. For most of our experiments, the camera was positioned as shown in Figure 5, facing the windshield. This gives the remote engineer a first person view from the passenger seat of the car of the car's current position on the test track, what the weather conditions are like and general contextual clues about the environment in which the test session is being conducted. Specifically, for winter climate tests, the video was found to be useful in providing information to the remote engineer about the defrosting of the windshield. As previously discussed, the video was also useful when an engineer at the proving ground needed assistance from a remote engineer, with re-configuration or technical problem solving.
In addition to the benefits of live transmission of measurement data, audio and video from the vehicle at the test track to the development site, the network access to the vehicle from the development site was useful for downloading measurement task definitions to a flight recorder installed in the car.
5 Discussion
Real time presentation and analysis of measurement data is only feasible if the sampling rate of the data is reasonably low, as for instance in temperature data collection. Many kinds of automotive testing, most notably motor testing, are using a very high sampling rate, which is simply impossible to visualize and analyze in real time. Nevertheless, many of the benefits of distributed collaborative analysis of data are still relevant, even if the data is collected beforehand.
An opportunity arising with distributed collaborative testing is the possibility for a test engineer to take part in two or more test expeditions, conducted in different geographical places, at the same time. For instance, we can envision simultaneous winter and summer testing, in different climate zones, coordinated by test engineers taking part in both test expeditions using distributed collaborative engineering tools, as described in this paper. In much the same way as studies of the use of business videoconferencing has shown that it is possible to enable people to work more effectively by replacing physical meetings with distributed virtual meetings, we believe that the efficiency of automotive testing and verification can be improved by means of tools and methods for distributed collaborative engineering. We can only speculate on the effects these kinds of highly virtualized testing procedures can have on the efficiency on the overall product development process, but the potentials seem to be limited only by our imagination.
Since new cars are getting increasingly complex, the prototypes are becoming more expensive to build. Therefore, to remain cost effective, the automotive companies need to reduce the number of prototypes built. To some extent this can be accomplished by replacing traditional testing and verification procedures with simulation using virtual prototypes, but there will still be a considerable need for testing with real prototypes. The concept for distributed collaborative testing and verification, using
wireless measurement data acquisition, has a potential of reducing the number of prototypes needed, by making it possible to conduct several tests at the same time using the same physical prototype. Consider for example a climate test being performed at a proving ground that provides wireless network access to the cars. The cars used for the climate tests can be equipped with flight recorders for motor data acquisition. Remote motor testing engineers can then access the motor test data while the cars are used for climate tests. The challenge with this approach is to design testing procedures in a way that ensure that the different simultaneous tests are not interfering with each other.
Wireless access to cars at a proving ground makes it possible not only to access data from the cars, but also to upload data to the cars. Specifically, new software for electronic control units in the cars can be uploaded, so that a new version of a software component can be tested directly, for instance after a software bug is fixed. Since a lot of the development time of modern cars is related to software development, reducing the development cycles for software development and testing has a great potential of reducing the overall development time.
From the perspective of the providers of automotive testing facilities, emerging techniques for distributed collaborative testing – in combination with the desire of automotive companies to replace more and more verification work with advanced simulation – may at first suggest a reduced need for the proving grounds' services in the future. We believe this to be a false conclusion. Instead, we believe that by meeting the automotive companies need for more efficient testing with improved communication and collaboration infrastructure at the proving grounds, the providers of testing facilities can improve their business opportunities and climb higher in the value chain. Instead of merely providing ice surfaces, test tracks, workshops, and so on, they can provide advanced engineering services to the automotive companies, taking over parts of the testing work traditionally performed by engineers employed by the auto makers. A clear trend in the automotive industry is that more and more development work is carried out in collaboration with subcontractors. We believe that this trend in the future will apply also for testing and verification, i.e. the auto makers will commission specialized testing and verification companies to perform well-defined testing procedures supervised from the development site of the automotive companies using distributed collaborative testing tools.
6 Conclusions and future directions
In this paper we have presented a framework for distributed collaborative work in automotive testing. The framework consists of a combination of broadband telematic services and tools for distributed collaborative engineering.
The pilot trial demonstrated that it is possible to follow an automotive winter testing expedition at a proving ground, in real time, from a car manufacturer's development center, located over 1000 km away. The presented system enables a new way of working in automotive testing, making it possible for car manufacturers to conduct testing more efficiently, reduce the need for prototypes, and increase the quality of the testing. By shortening the time needed for testing and verification, the overall time to market for new products can be shortened, making automotive companies more competitive in the global marketplace. In addition, proving ground operators can improve their businesses by providing tools and infrastructure for distributed collaborative automotive testing. Test procedures traditionally performed by personnel employed by the automotive companies can be taken over by local entrepreneurs, with remote assistance and supervision.
In future research we will explore the possibilities of combining live measurement data acquisition and transmission with simulation. By feeding live measurement data from a car into a simulator, we can compute interesting properties in terms of the dynamics of a moving car, that cannot be measured directly [9]. For instance, measurement data about a car's current position, velocity and acceleration can be used as input to a simulation model, to calculate the normal forces acting on the tires of the car. The result can be visualized in real time, in a 3D model of the car, giving the engineers an improved understanding of the behavior of the car during, for instance, handling tests. We believe that this kind of hardware-in-the-loop simulations, combining real time measurement data acquisition and simulation techniques, will further improve automotive testing and verification processes in the future.
References
[1] Grimm, K., "Software Technology in an Automotive Company - Major Challenges," Proceedings of the 25th International Conference on Software Engineering (ICSE'03), Portland, Oregon, USA, 2003.
[2] Voget, S., "Future Trends in Software Architectures for Automotive Systems," Advanced Microsystems for Automotive Applications, Berlin, Germany, May 2003.
[3] OpenVPN Virtual Private Network software: http://openvpn.net
[4] ASAM: Association for Standardisation of Automation and Measuring Systems, http://www.asam.net
[5] SUNET – Swedish University Network, http://www.sunet.se.
[6] Törlind, P., "A Collaborative Framework for Distributed Winter Testing," Proceedings of eChallenges e-2004, Vienna, Austria, October 2004.
[7] Hagsand, O., "Interactive Multiuser VEs in the DIVE System," IEEE Multimedia, 3(1), pp. 30-39, 1996.
[8] Johanson, M., "Multimedia Communication, Collaboration and Conferencing using Alkit Confero," Alkit technical report 2004:1, April 2004.
[9] Nybacka, M., Larsson, T., Johanson, M., Törlind, P., "Distributed real-time vehicle validation," To appear at ASME International Design Engineering Technical Conference, Philadelphia, September 2006.