May 2020
Public Transportation Accessibility, Proximity to New
Public Transportation Accessibility, Proximity to New
York City, and Residential Property Values in New
York City, and Residential Property Values in New
Jersey
Jersey
Sangwan Lee
Portland State University, sangwan@pdx.edu
Michael Smart
Rutgers University, mike.smart@rutgers.edu
Follow this and additional works at: https://pdxscholar.library.pdx.edu/hgjpa
Part of the Public Affairs, Public Policy and Public Administration Commons, and the Urban Studies and Planning Commons
Let us know how access to this document benefits you.
Recommended CitationRecommended Citation
Lee, Sangwan and Smart, Michael (2020) "Public Transportation Accessibility, Proximity to New York City, and Residential Property Values in New Jersey," Hatfield Graduate Journal of Public Affairs: Vol. 4: Iss. 1, Article 6.
10.15760/hgjpa.2020.4.1.6
Public Transportation Accessibility,
Proximity to New York City, and
Residential Property Values in New
Jersey
In recent years, as housing with better transit accessibility has become unaffordable to many households in many regions globally, the call to study the connection between transit and property values has shifted to concern itself with the negative consequences of transit access being capitalized into property values. The primary purpose of this research is to define the effect of station proximity and other characteristics on housing prices and provide evidence if there is displacement in the area with better accessibility to transit. The outcome reveals that locational factors are associated with housing prices. Inherent housing features, the number of beds, structure age, and parking spots were the strongest predictors in this model of housing prices. Relative to housing near other transit lines, housing near the Northeast Corridor Line, which provides direct access to New York Penn Station, had much higher sales prices. Given the significant increase in the poverty rate in a high-density area with a transit station, low-income people move into the inner-city area with higher population density and public transportation accessibility. We expect that the results can contribute to providing improved housing price forecasting model, responding to the housing crisis, and ultimately establishing sophisticated strategies for affordability and livability.
Sangwan Lee
Ph.D. Student in Urban Studies Nohad A. Toulan School of Urban Studies & Planning
Portland State University
506 SW Mill Street, Portland, Oregon, 97201
Tel: 908-420-7363; Email: sangwan@pdx.edu
Michael J. Smart Ph.D. Associate Professor
Edward J. Bloustein School of Planning and Public Policy
Rutgers, the State University of New Jersey
33 Livingston Avenue, New Brunswick, New Jersey, 08901 Tel: 848-932-2751;
1 Introduction
Decades of research on transportation’s role in determining land and property values have demonstrated that, in many cases, public transportation service can impart a positive impact on valuation. That access is an asset is not surprising; classical models of urban spatial development center on this very notion. However, in recent years as housing has become unaffordable to many households in many regions globally, the call to study the connection between transit and property values has shifted to concern itself with the negative consequences of transit access being capitalized into property values. Transit investments bring benefits for some and hardship for others, thereby leading to an under-researched spatial inequality issue (Peter Moskowitz 2017; Zuk et al. 2018). Since it is likely that gentrification has more negative than positive consequences, such as the displacement of incumbent residents, it is crucial to understand the causes of gentrification in an effort to retain affordability and livability. In this regard, while previous literature points out that free-market forces, public investments, and individual preferences are leading causes of gentrification, transportation accessibility and proximity to employment centers are also closely related to the issue (Lees et al., 2010; Slater, 2006; Zuk et al., 2018). The spatial benefits can lead to increases in property values by reducing transportation costs and attracting mixed-use to the neighborhoods (Bowes and Ihlanfeldt 2001; Kay et al. 2014).
The primary purposes of this research are to define the effect of proximity to transit stations and New York City on housing prices in New Jersey, while controlling for attributes of the property, and to figure out whether there are low-income residents who are priced out. To analyze the housing price premium, this research paper evaluates property values in municipalities where a New Jersey Transit (NJ Transit) commuter rail station is located, by using hedonic price modeling to disentangle the effect of rail proximity from other factors. We also examine the trends in the poverty rate over time and the correlation between the proximity variables and poverty rate to explain the effect of transit-induced gentrification on low-income people.
This paper differs from many others on the topic. Firstly, our study improves on many prior studies by using actual transaction prices for each housing unit as a dependent variable, rather than block-group-level data, annual average appreciation rate, or country tax assessment records. The data at the individual housing level enables us to analyze if there is a non-linear relationship between independent variables, such as distance to the nearest transit and housing characteristics, and housing prices. Secondly, although neighborhood features, including walkability and transit characteristics like whether or not transit station
provides direct access to New York City can also affect the property values, very few studies, to date, have explored the association. Hence, this study attempts to extend insights and investigate the variables that influence sales prices. Thirdly, the focus of many previous studies has been on transit’s role in property valuation in the (near) absence of new transit service. Instead, our research sits within a context of rapidly increasing property valuation that others have found to radiate outward from the urban core (the island of Manhattan, in New York City) along major transit corridors (Barton and Gibbons 2017). We examine this phenomenon as it relates to heavily utilized commuter rail service linking northern and central New Jersey to the region’s core. Fourthly, this research chose New Jersey as a study area due to its unique characteristics. The interesting feature is that NJ Transit, one of the largest and most heavily utilized state-wide public transportation systems, offers greater access to not only employment centers and central business districts in New Jersey, but also in major cities such as New York City and Philadelphia. Lastly, although previous literature has mostly focused on the housing prices increase, we suggest a way to determine if there is transit-oriented displacement in areas proximate to public transportation.
This paper divides the discussion into two sections; (1) the central portion of the paper shows the results of the hedonic regression analysis, and (2) the second part provides evidence if there is displacement in the area with better accessibility to transit. From a policy perspective, the results of this paper can contribute to providing improved housing price forecasting models, responding to the housing crisis, and ultimately establishing sophisticated strategies for affordability and livability, especially in inner-city areas.
2 Literature Review
Generalizing previous studies’ findings on transit’s impact on property values can be difficult, since the methodology, geography, and context of the studies vary considerably (Duncan 2011). A few studies suggest that housing near transit may sell for less because of negative externalities, such as noise and congestion, which may outweigh the accessibility benefits (Bowes and Ihlanfeldt 2001; Kay et al. 2014). However, other studies have found a positive effect of transit on property values, in line with the bid-rent theory of the urban land market, in which accessibility to the city center plays a crucial role in land prices (Alonso 1964). A large body of literature has revealed that transportation improvements can trigger a modest premium on residential property near rail stations, and the built environment near stations can enlarge those premiums (Cervero and Landis 1997; Debrezion et al. 2007).
Regarding the transportation accessibility advantage, station proximity within a transit-supportive built environment (a high density of roadway intersections) incorporating commercial establishments has a considerable impact on station area premiums in San Diego (Duncan 2011). International research, conducted in Greece, Australia, South Korea, and Italy, obtains results which are consistent with the literature; that is, the access improvements conferred by public transportation yield a land price premium for nearby properties (Cervero and Kang 2011; Efthymiou and Antoniou 2013; Mulley et al. 2016; Pagliara and Papa 2011). Similarly, after the announcement of the construction of a light-rail line, property values can increase significantly, meaning that the expected change in transportation accessibility raises the demand for housing near the planned rail stations (Pan 2013).
With the impact of transportation proximity, the design characteristics of transit-oriented development (TODs), like street connectivity, smaller block sizes, and mixed-use development patterns, are also important factors that impact housing prices (Song and Knaap 2003). Station proximity and station area attributes, such as station parking, distance to downtown, crime, and neighborhood income, play an essential role in the housing prices in Atlanta (Bowes and Ihlanfeldt 2001).
Previous studies in New Jersey similarly find that properties around train stations can gain a property value premium. For instance, properties around urban commuting stations on the Hudson-Bergen Light Rail line have higher residential property values, likely through enhanced transportation accessibility and lower transportation costs (Kim and Lahr 2014). Proximity to transit stations with direct New York City service and TOD amenities also leads to higher property valuations in New Jersey (Kay et al. 2014). Other work suggests that there is an association between the rise in property values and New Jersey Transit Village designation; additionally, difficult-to-measure factors such as the planning capacity of a municipality may have a positive impact on property value appreciation (Department of Transportation, New Jersey 2017).
Thus, most studies of transit’s impact on urban real estate confirm that transportation improvements have a positive influence on nearby housing prices (Cervero and Kang 2011). Due to the increase in housing prices, affordable housing for low-income people may not be preserved, particularly in areas with better public transportation accessibility, resulting in the displacement (Dawkins and Moeckel 2016). The accessibility could have a significant impact on low-income people who frequently cannot afford automobiles, as it determines the accessibility to employment, education, and health facilities (Langford et al. 2012; Saghapour et
al. 2016). Despite the social and economic issues caused by the displacement, previous studies have failed to overcome the limitations of data and methodological diversity (Zuk et al. 2015). As background to this research, the next section describes data and formulation.
3 Research Design
The first part of this research estimates the correlation between the dependent variable and independent variables by using the hedonic regression model (Monson 2009). As such, in the context of real estate, the methodology can also be utilized to disentangle, estimate, and explain the effects of various factors— such as characteristics of the property, the neighborhood, or others—on land and property prices. We then present the trends in the poverty rate over time and the correlation between location factors and the poverty rate to explore whether displacement has occurred.
3.1 Study Area
This research analyzes residential properties in New Jersey for four main reasons regarding transportation and the built environment. Firstly, unlike other transit systems, trains in New Jersey have been operated since 1833, and consolidated into the state-run NJ Transit in 1979. This research is unique in that it focuses on a longstanding and well-utilized transit system, in turn providing a broad understanding of the impact of public transportation on housing prices. Secondly, NJ Transit offers greater access to employment centers and central business districts in New Jersey municipalities and major cities such as New York City. Particularly for those wishing to travel to New York City, which has high levels of traffic congestion and high parking costs, transit access likely represents a significant time- and money-saving amenity. Hence, New Jersey homeowners and renters are more likely to pay premiums to live near rail stations compared to other states (Bowes and Ihlanfeldt 2001; Kay et al. 2014). Thirdly, to establish so-called “smart growth” (transit-supportive development) near transit stations in New Jersey, the state operates a Transit Village Initiative that seeks to foster redevelopment and revitalization centered on transit facilities (Noland et al. 2012). This policy focuses mainly on developing a new urban paradigm to transform the built environment and intensify mixed-use development, encourage transit ridership, and create a pedestrian-friendly built environment (Ewing and Cervero 2010).
3.2 Hedonic Regression Model
Our analysis uses an ordinary least squares hedonic model, illustrated by the following equation:
P = f (L, H, B, T, N, e)
Where P, the sales price of housing, is a function of L (Locational Factors), H (Housing Characteristics), B (Built Environments), T (Transit features), N (Neighborhood Characteristics), and e (Error Term). To analyze the effects of transportation accessibility and other factors on property value, we gathered 2,156 housing sales records in 112 municipalities across the state.
3.3 Variable Specification for the Hedonic Regression Model
Based on the theoretical framework of the hedonic regression analysis mentioned above, this research uses housing prices as a dependent variable, and 13 characteristics regarding the housing unit, its neighborhood, the built environment, and location as independent variables (see Table 1). Table 5 in the Appendix shows the summary statistics of the variables.
Housing Price
The dependent variable, housing price, is obtained from Zillow.com, and the dataset includes 2,156 home sales in July 2018 in New Jersey. We take a log form for the actual transaction prices for home sales in reasoning that the log-transformed housing price can create better outcomes than housing prices. Moreover, we used log transformation due to the positively skewed and highly dispersed distribution of housing prices.
Locational Factors
Regarding the key independent variables, this research determines the effect of distance to the nearest NJ Transit station and New York Penn Station, the rail system’s hub in Manhattan. The distance from each observation to train stations and New York Penn station is calculated in ArcGIS Network Analyst using data from the New Jersey Department of Transportation and checked by Google Earth. Because upon visual inspection of our data, we observed a logarithmic relationship between the distance variables and individual housing prices, we take log form for
the distance to the nearest transit station and the distance to New York Penn station. Given that there is no clear central point within the Central Business District, the data regarding the distance to the nearest CBD is unreliable. We, therefore, omitted the location factor in our final model.
Housing Characteristics
The independent variables for housing characteristics are also obtained from Zillow.com and checked by Google Earth. Since the number of bedrooms is collinear with the number of kitchens and bathrooms, we omitted the housing features. In our final model, we use the number of bedrooms, the number of parking spots, the structure’s age, and housing size as housing characteristics. More importantly, because a second-degree equation is needed to fully explain the effect of age and the number of beds, we include age squared, and bedrooms squared in our model.
Built Environment
Unlike other studies, we include Walk Score, a proprietary metric scaled from zero (least walkable) to 100 (most walkable), which Manaugh and El-Geneidy (Manaugh and El-Geneidy 2011) find to be a good predictor of walking trips. As such, to analyze and explain the effect of walkability on housing price, the Walk Score of individual properties is the major independent variable of interest. The Walk Score for each observation is acquired from Walkscore.com. Upon inspecting our data, we found that housing prices in areas with low Walk Scores and high Walk Scores are more likely to be expensive than those in the areas with a middling Walk Score, suggesting that the squared term of Walk Score may improve model fit. This research also examines the relationship between the property value and Transit Village designation (a multi-agency Smart Growth partnership). The Transit Village designation may provide additional benefits to developers and residents, thereby leading to increase housing prices.
Transit Characteristics
The Northeast Corridor Line, NJ Transit’s busiest commuter rail line, offers a direct transit line between Trenton Transit Center and New York Penn Station to commuters. Proximity to this transit line is important for people who commute to New York Penn Station and other transit stations including Newark Penn Station and Elizabeth. Thus, a dummy variable for the Northeast Corridor Line is used to indicate the absence or presence of the transit line. Moreover, the Light Rail Transit (LRT) in New Jersey contains Hudson-Bergen Light Rail, Newark Light Rail, and
the River Line. Residential properties near the relatively newly developed rail system appreciate in value because they capitalize on their new-found accessibility (Kim and Lahr 2014). Therefore, since the accessibility to LRT may be expected to shift the outcome, we include a dummy variable for LRT.
Neighborhood Characteristics
Neighborhood characteristics in our research include population density, the proportion of the local population that is non-Hispanic white, and per capita income at the Census Block Group level. Neighborhood characteristics play an important role in housing values, though other studies on housing price effect normally overlook the characteristics. The data at the Census Block Group level is gathered from the American Community Survey (ACS) 2013-2017. To simplify the interpretation of our model results, population density and the per capita income are divided by 1,000.
Table 1 Variables used in Hedonic Regression Models
Variable Name Description Source
Dependent Variable
ln(Housing Price) Log-Transformed Housing Price in July 2018
Zillow.com Independent Variables
Locational Factors
ln(Distance to Transit) Log-Transformed Road network distance in miles between each observation and the nearest NJ transit station
Calculated using GIS & Google Earth
ln(Distance to NY Penn Station)
Log-Transformed Road network distance in miles between each observation and New York Penn Station
Calculated using GIS & Google Earth
Housing Characteristics
Beds Number of bedrooms Zillow.com
Beds² Number of bedrooms Squared Zillow.com
Age Age of house at sale date Zillow.com & Google Earth Age² Age of house at sale date Squared Zillow.com & Google Earth Parking Spots Number of parking spots Zillow.com & Google Earth Housing Size in 100 sqft The size of housing in square feet(sqft)
in 100 sqft
Zillow.com Built Environment
Walk Score The walkability of each address by analyzing walking routes, the distance to amenities, population density, road metrics and so forth
WalkScore.com
Transit Village Whether or not the individual housing is located within 0.5 miles from Transit Village
Dummy variable: Yes (1) or No (0)
Calculated using GIS & Department of Transportation, New Jersey
Transit Characteristics
Northeast Corridor Line Whether or not The nearest transit from individual housing is Northeast Corridor Dummy variable: Yes (1) or No (0)
Calculated using GIS & Department of Transportation, New Jersey
Light Rail Transit Whether or not The nearest transit from individual housing is Light Rail Dummy variable: Yes (1) or No (0)
Calculated using GIS & Department of Transportation, New Jersey
Neighborhood Characteristics
Population Density in 1,000 Total population per square miles at Census Block Group Level in 1,000s in 2017
2013-2017 American Community Survey 5-year estimates
The proportion of NH White The Proportion of Non-Hispanic White Residents at Census Block Group Level in 2017
2013-2017 American Community Survey 5-year estimates
Per Capita Income in $1,000s The income per capita at Census Block Group Level in $1,000s in 2017
2013-2017 American Community Survey 5-year estimates
3.4 Trends in Poverty Rates over Time
The second part of this study employs Census 1970, 1990, 2000, and the American Community Survey (ACS) 2013-2017 to analyze changes in poverty rates over time in New Jersey. We used Census Tract level data since it enables us to examine a longer period than Census Block Group Level. We divided Census Tracts into four groups based on distance from the centroid of the census tract to the nearest transit station (1 mile) and New York Penn Station (10 miles). The distances are based on our result of a hedonic regression model (see Figures 2 and 3 in the Appendix). We extract 172 census blocks due to system-missing values and then use 1838 census blocks.
3.5 Correlations between Poverty Rate and Locational Factors
The trend in the poverty rate over time may not indicate the correlation between poverty rate and transit accessibility. We used Multivariate Ordinary Least Square Model to examine the locational impact on the poverty rate, controlling for variables that can be significantly correlated (see Table 2).
In this part, we used data at the Census Block Group level for more precise distance to the nearest transit station and New York Penn Station. As shown in Table 2, the dependent variable is the poverty rate in 2010 and 2017, and the key
independent variables are log-transformed road network distance from the centroid of census block group to the nearest transit station and New York Penn Station.
Table 2 Variables used in Multivariate Ordinary Least Square Model
Variable Name Description Source
Dependent Variable
Poverty Rate Poverty Rate in 2010 and 2017 at Census Block Group Level
2013-2017 American Community Survey 5-year estimates
Independent Variables Locational Factors
ln (Distance to Transit) Log-Transformed Road Network Distance in Miles between the Centroid of the Census Block Group and the Nearest NJ Transit Station
2013-2017 American Community Survey 5-year estimates
ln (Distance to NY Penn Station)
Log-Transformed Road Network Distance in Miles between the Centroid of the Census Block Group and New York Penn Station
2013-2017 American Community Survey 5-year estimates
Neighborhood Characteristics
Population Density The population density at Census Block Group level in 2017
2013-2017 American Community Survey 5-year estimates
Education Attainment (Less Than High School)
The percentage of population 25 years and over in Census Block Group who have less than high school degree in 2017
2013-2017 American Community Survey 5-year estimates
Unemployment Rate Unemployment Rate for Population in labor force 16 years and over at Census Block Group Level in 2016
2013-2017 American Community Survey 5-year estimates
Proportion of Black The Proportion of Black Residents at Census Block Group Level in 2017
2013-2017 American Community Survey 5-year estimates
Proportion of Hispanic The Proportion of Hispanic Residents at Census Block Group Level in 2017
2013-2017 American Community Survey 5-year estimates
4 Results
This section describes three main parts; (1) the result of the hedonic regression models, (2) the trends in the poverty rate over time, and (3) the result of the multivariate ordinary least square regression models.
4.1 The Hedonic Regression Models
All Residential Properties (Model 1)
The results of our model are displayed in Table 4; overall, the fit of the model is good (r-squared of 0.699), and most of our coefficients are statistically significant. We tested several specifications, including housing prices in $1,000, and found that a logarithmic transformation fit the data considerably better (see Tables 4 and 7 in the Appendix). In our initial model, we used a linear term for distance to transit and New York Penn Station, and found that a logarithmic transformation fit the data considerably better in each case. We initially included travel time in minutes to the nearest transit station and New York Penn station in our model rather than road network distance. We found that there is no difference between travel time and road network distance. More importantly, the measurement of travel time may be significantly influenced by transportation features such as travel mode choice and peak time. Therefore, in our final model, we used road network distance instead of travel time.
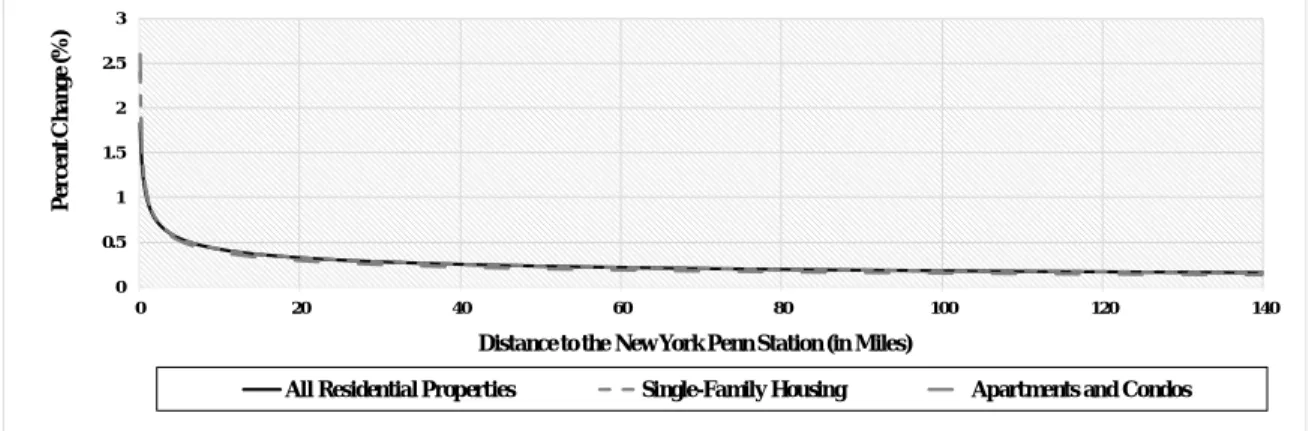
In Table 4, a notable finding of our model regards the locational factors: the nearest transit station and New York Penn Station. Our model indicates that while controlling for other variables, proximity to NJ Transit station and New York Penn station leads to a rise in residential property valuation, but also there is the logarithmic relationship (see Figures 2 and 3 in Appendix). As the figures show, properties nearest a transit station and nearest New York Penn Station sell at considerably higher prices, controlling for other variables in the model. It further indicates a threshold distance to these amenities, beyond which additional distance appears to matter little. The important finding is that the steep drop-off in prices in the first ten miles from the New York Penn station, which covers Newark and Jersey City, and the flatter relationship beyond that point.
More interestingly, the distance to New York Penn Station is the second strongest predictor of housing price in our model (β=-0.479). It suggests that housing prices in New Jersey are strongly influenced by easy access to employment opportunities and social services significantly increases in and around Manhattan. The result of the inverse relationship between the distance and housing price indicates that people are willing to live in municipalities near their closest train station and New York City. We believe that diverse factors, including transportation cost, travel time, locational amenities, and nearby employment opportunities, may explain this result.
Given the result of the Northeast Corridor line, the direct access to New York Penn Station via commuter rail is a strong predictor of housing prices in New Jersey. The outcome suggests that the accessibility to New York City and other destinations on this line, such as Newark, Elizabeth, and Jersey City, is a crucial component for residential choice. The relationship between housing price and Light Rail Transit was also significant.
Regarding the built environment, we initially expected that better walkability near a transit station would enhance property values by making walking and the use of transit less onerous. In this regard, the benefit of the Walk Score is capitalized into higher commercial and residential values because people are willing to invest in properties with better walkability (Pivo and Fisher 2011). On the other hand, another study suggests that walkability might not be associated with property valuation, but the research omitted the variable from final models because the study used block data for median property valuation rather than individual properties (Kay et al. 2014). The outcome of this research suggests that Walk Score has not a statistically significant impact on housing appreciation. Unlike research conducted by Noland et al. (2012), there is no statistically significant association between the designation of New Jersey Transit Villages and housing value.
Similar to other studies, housing characteristics, such as the number of beds, structure’s age, parking spots, and housing size are significant predictors of housing prices. The relationship between housing prices and the structure’s age suggests that all else equal, the price of housing with medium structure age is typically lower than that of older and newer housing in New Jersey. Sales prices are lowest for homes approximately 100 years old and the highest for 200-year-old homes. Moreover, houses with more rooms, more parking spaces, and bigger housing size have higher sales values, all else equal. Given that the number of beds and structure age are the strongest predictors in this model with statistical significance, we conclude that the innate housing conditions play a crucial role in determining housing prices. Concerning housing values, the value of properties in a census block group with a higher proportion of white residents and higher per capita income are more costly than other houses.
Submarkets Influence (Models 2 and 3)
To see if the outcomes of residential properties with distinct features are different, we tested several specifications. As shown in Table 4, we divided residential properties into two submarkets, such as single-family housing (Model 2) and apartments and condos (Model 3). Given that there is a difference in the
outcomes between Model 2 and Model 3, the predictors of property values considerably differ by two submarkets.
Surprisingly, in the analysis that included apartments and condos, proximity to the nearest transit station, which are the variables of interest, is unrelated to housing prices, while the variable was a significant predictor in Model 2. Yet, there is a negative relationship between housing prices and distance to the nearest transit station in Model 3 (B=-0.028). The distance to New York Penn Station has a higher impact on the property value of apartments and condo (B=-0.416) than that of single-family housing (B=-0.381), suggesting that proximity to New York is more crucial for people who live in an apartment or condo than those who are in single-family housing.
For housing characteristics, all the independent variables were statistically significant in both models. More importantly, only apartments and condos were significantly influenced by walkability. Specifically, Table 4 indicates a strong non-linear relationship between walkability and home sales prices, suggesting that homes in very low-walkability and very high-walkability areas selling for considerably more than those in areas with middling walkability.
Table 4 The Result of the Hedonic Regression Model for All Residential Properties and Two Submarkets (Dependent Variable: Log-Transformed Housing Price) All Residential Properties (Model 1) Single-Family Housing (Model 2) Apartment and Condo (Model 3)
Variable Name B Beta B Beta B Beta
(Constant) 12.679 ⃰ ⃰ ⃰ 12.869 ⃰ ⃰ ⃰ 12.713 ⃰ ⃰ ⃰ Locational Factors
ln (Distance to Transit Station)
-.044 ⃰ ⃰ ⃰ -.062 -.041 ⃰ ⃰ -.057 -.028 -.037 ln (Distance to New York
Penn Station) -.377 ⃰ ⃰ ⃰ -.479 -.381 ⃰ ⃰ ⃰ -.439 -.416 ⃰ ⃰ ⃰ -.594 Housing Characteristics Beds .248 ⃰ ⃰ ⃰ .531 .167 ⃰ ⃰ ⃰ .337 .331 ⃰ ⃰ ⃰ .465 Beds² -.018 ⃰ ⃰ ⃰ -.348 -.011 ⃰ ⃰ ⃰ -.211 -.039 ⃰ ⃰ -.329 Age -.008 ⃰ ⃰ ⃰ -.412 -.008 ⃰ ⃰ ⃰ -.409 -.011 ⃰ ⃰ ⃰ -.538 Age² .000 ⃰ ⃰ ⃰ .256 .000 ⃰ ⃰ ⃰ .254 .000 ⃰ ⃰ .379 Parking Spots .051 ⃰ ⃰ ⃰ .145 .046 ⃰ ⃰ ⃰ .137 .144 ⃰ ⃰ ⃰ .187 Housing Size in 100 sqft .014 ⃰ ⃰ ⃰ .184 .013 ⃰ ⃰ ⃰ .179 .024 ⃰ ⃰ ⃰ .211
Built Environment
Walk Score -.001 -.055 -.001 -.031 -.007 ⃰ ⃰ -.312
Walk Score² .000 .003 .000 -.018 .000 ⃰ ⃰ .347
Transit Village -.005 -.002 .012 .006 .020 .010
Transit Characteristics
Northeast Corridor Line .213 ⃰ ⃰ ⃰ .093 .194 ⃰ ⃰ ⃰ .087 .237 ⃰ ⃰ .088 Light Rail Transit -.098 ⃰ ⃰ ⃰ -.047 -.106 ⃰ ⃰ -.042 -.099 -.065
Neighborhood Characteristics
Population Density in 1,000 .000 -.010 .000 -.004 .000 .000 Proportion of the White .005 ⃰ ⃰ ⃰ .204 .005 ⃰ ⃰ ⃰ .223 .002 ⃰ .063 Per Capita Income in $1,000s .010 ⃰ ⃰ ⃰ .347 .010 ⃰ ⃰ ⃰ .357 .009 ⃰ ⃰ ⃰ .345
Sample Size 1,780 1,501 279
R Square 0.699 0.697 0.771
Dependent Variable: Log-Transformed Housing Price
⃰ Significant at p < 0.10; ⃰ ⃰ Significant at p < 0.05; ⃰ ⃰ ⃰ Significant at p < 0.001
4.2 Trends in Poverty Rates over Time
Since transit accessibility can, in some cases, cause housing prices to appreciate and spur gentrification (Pagliara and Papa 2011), low-income people may be displaced from transit-accessible areas toward peripheral areas with lower property prices.
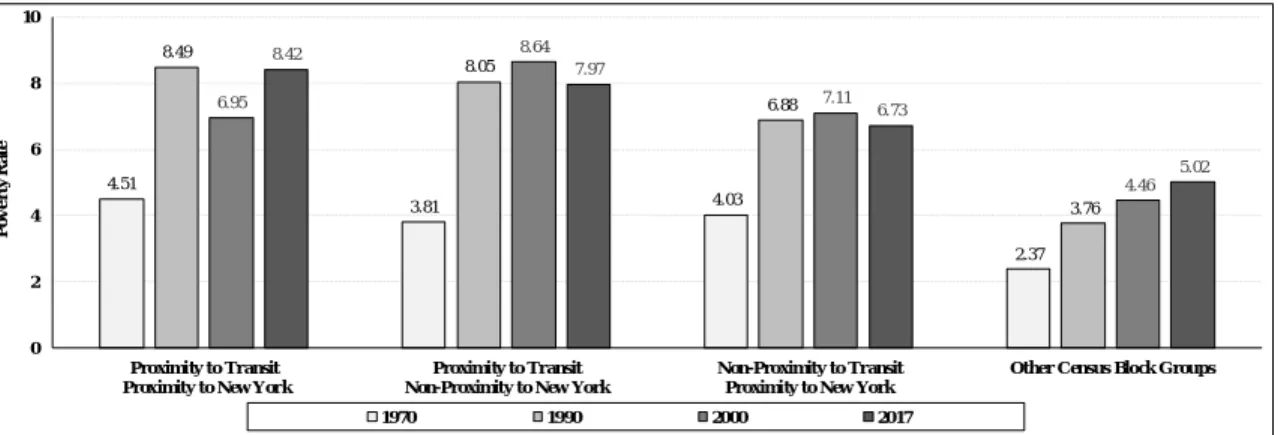
However, Figure 1 shows that the poverty rate has doubled from 1970 to 2017 in census tracts with proximity to not only transit station but also New York Penn Station. On the other hand, in areas with far from the transit station and New York Penn Station, the poverty rate has increased more slowly and from a lower base rate, from 2.37% to 5.02%. The finding indicates that, in the past half-century, low-income people in New Jersey have disproportionately moved into areas where have better public transportation accessibility. We, therefore, conclude that public transportation accessibility is essential for low-income people, many of whom cannot afford the high costs of automobiles.
Figure 1 Trends in the Poverty Rate over Time in New Jersey, 1970-2017
4.3 Correlation between Poverty Rate and Accessibility to Transit Stations in New Jersey and New York Penn Station
We examined the correlation between the poverty rate and transit accessibility, controlling for diverse independent variables. We tested several specifications, including percent change in the poverty rate and log-transformed the percent change as a dependent variable, and found that the models cannot adequately explain the hypothesis. Thus, we used the poverty rate in 2010 and 2017 in our final models. Table 5 shows the results of our models; the fit of the model is good (r-squared of 0.261 and 0.256), and all the independent variables turn out to be a statistically significant predictor of the poverty rate.
As shown in Table 5, for locational factors, the distance to the nearest transit station is negatively related to the poverty rate in 2010 and 2017 (B=0.190 and -0.269). The result supports the conclusion in the previous chapter that low-income people are more likely to live in an area with better transit accessibility. Yet, unlike a hypothesis we made, distance to New York Penn Station and poverty rate are positively related. The poverty rate was significantly influenced by neighborhood characteristics of census block groups, including population density, education attainment, unemployment rate, the proportion of Non-Hispanic black and Hispanic. 4.51 3.81 4.03 2.37 8.49 8.05 6.88 3.76 6.95 8.64 7.11 4.46 8.42 7.97 6.73 5.02 0 2 4 6 8 10 Proximity to Transit Proximity to New York
Proximity to Transit Non-Proximity to New York
Non-Proximity to Transit Proximity to New York
Other Census Block Groups
P o v e rty R a te 1970 1990 2000 2017
Table 5 The Result of the Multivariate Ordinary Least Square Regression Model for Correlation between Poverty Rate and Transit Accessibility
DV: Poverty Rate in 2017 DV: Poverty Rate in 2010
VIF
Variable Name B Beta B Beta
(Constant) -2.921*** -2.636*** Locational Factors ln (Distance to Transit) -.190** -.034 -.269*** -.049 1.658 ln (Distance to NY Penn Station) .978*** .118 .738*** .091 2.075 Neighborhood Characteristics Population Density in 1,000 .064*** .122 .054*** .101 1.900 Education Attainment
(Less than High School) .146*** .230 .127*** .224 2.135
Unemployment Rate .175*** .101 .118*** .122 1.226
Proportion of NH Black .072*** .225 .065*** .219 1.395 Proportion of Hispanic .034*** .105 .024*** .075 2.474
Sample Size 6,283 6,285
R Square 0.261 0.256
⃰ Significant at p < 0.10; ⃰ ⃰ Significant at p < 0.05; ⃰ ⃰ ⃰ Significant at p < 0.001
5 Conclusion
This research improves on existing studies and examines the impact of public transportation accessibility and New York on residential property values in New Jersey. We also examine the trends in the poverty rate and the correlation between transit accessibility and poverty rate to see if low-income people are disproportionately priced out of transit-accessible places.
An interesting finding is that the locational factors are strongly associated with housing prices and that the relationship between prices and distance to major activity centers and to transit is logarithmic rather than linear. Also, distance to New York Penn Station is a strong predictor in the models. Relative to housing proximate to other transit lines, housing near Northeast Corridor Line, that provides direct access to New York Penn Station without a transfer, had much higher housing price. The relationship between the Walk Score and housing price of apartments and condos suggests that home-buyers are split on the attractiveness of walkability, with some preferring very un-walkable areas, and others preferring very walkable areas.
The hedonic regression models show that proximity to the nearest downtown, NJ Transit station, and New York Penn station increases residential property valuation. However, the second part of this research indicates that low-income people move into the inner-city area with a proximity to the transit station and Manhattan, regardless of higher housing prices. More importantly, as the distance to the nearest transit station decreases, the poverty rate increases, suggesting that low-income people who may not able to afford a vehicle live in the area with better public transportation accessibility.
Since the increased housing price is a vital issue in planning for equitable cities, this research, which explains the correlation between property values and diverse factors, has an economic and social significance. Because it is possible to predict the change in housing prices by using the hedonic model in the study, the finding helps private sector, policymakers, and community members to understand the effects of public transit on housing price. The contribution enables them to suggest comprehensive approaches to prevent gentrification and displacement.
We believe our research highlights the need to preserve affordable housing near transit—particularly in places such as New Jersey, where transit riders are rich and poor alike—though we do not investigate which methods of achieving this laudable aim are best suited to achieving that task. Our results suggest that transit may meaningfully increase property values, making transit-accessible housing unaffordable for those who need it most. While some of this increase in property value (and, not investigated here, likely rent) may be recouped through lower transportation expenditures, the housing premiums we find in our study suggest robust public intervention may be needed to achieve a transportation and housing balance that suits diverse residents’ needs.
6 Appendix
Table 5 Univariate Statistics for Variables in the Hedonic Regression Model
Variable Name N Range Mean Std.
Deviation Dependent Variable Housing Price in $1,000s 2,156 3,478.0 439.4 229.7 ln (Housing Price) 2,156 5.1 12.8 0.7 Independent Variables Locational Factors ln (Distance to Transit) 2,153 4.9 0.1 0.9
ln (Distance to NY Penn Station) 2,156 4.4 3.3 0.8
Housing Characteristics Beds 2,156 11.0 3.5 1.4 Beds² 2,156 143.0 14.5 13.0 Age 2,156 192.0 60.1 34.2 Age² 2,156 36,864. 0 5,148. 6 4,589.0 Parking Spots 2,156 17.0 2.3 1.8 Housing Size in 100 spft 1,782 68.0 19.1 8.7 Built Environment Walk Score 2,156 99.0 53.9 28.9 Walk Score² 2,156 9,801.0 3,736. 4 2,922.9 Transit Village Yes No 2,156 269(12.5%) 1,887(87.5%) Transit Characteristics
Northeast Corridor Line Yes
No
2,156 169(7.8%) 1,987(92.2%)
Light Rail Transit 2,156
Yes No 261(12.1%) 1,895(87.9%) Neighborhood Characteristics Population Density in 1,000 2,156 125.4 11.5 14.9 Proportion of White 2,156 100.0 65.2 26.7
Table 6 Univariate Statistics for Variables in Multivariate Ordinary Least Square Regression Model
Variable Name N Range Mean Std.
Deviation Dependent Variable Poverty Rate in 2017 6,283 100.0 4.9 6.9 Poverty Rate in 2010 Independent Variables Locational Factors ln (Distance to Transit) 6,230 3.7 0.3 0.5
ln (Distance to NY Penn Station) 6,230 1.6 1.5 3.6
Neighborhood Characteristics Population Density in 1,000 6,305 156.1 9.4 13.2 Education Attainment 6,296 88.1 11.1 10.9 Unemployment Rate 6,296 38.8 4.7 4.0 Proportion of Black 6,296 100.0 13.3 21.9 Proportion of Hispanic 6,296 100.0 19.3 21.7
Figure 2 The Relationship between Distance to the Nearest Transit Station and Housing Price
0.8 0.9 1 1.1 1.2 0 2 4 6 8 10 12 14 P e rc e n t C h a n g e ( % )
Distance to the Nearest Transit Station (in Miles)
Figure 3 The Relationship between Distance to the New York Pen Station and Housing Price
Table 7 The result of the Hedonic Regression Model for All Residential Properties and Two Submarkets (Dependent Variable: Housing Price in $1,000) All Residential Properties (Model 1) Single-Family Housing (Model 2) Apartment and Condo (Model 3)
Variable Name B Beta B Beta B Beta
(Constant) 168.449 ⃰ ⃰ ⃰ 206.939 ⃰ ⃰ ⃰ 359.780 ⃰ ⃰ Locational Factors ln (Distance to Transit Station) -34.000 ⃰ ⃰ ⃰ -.104 -33.876 ⃰ ⃰ ⃰ -.103 -11.717 -.034 ln (Distance to New York
Penn Station) -99.463 ⃰ ⃰ ⃰ -.277 -97.568 ⃰ ⃰ ⃰ -.245 -125.284 ⃰ ⃰ ⃰ -.400 Housing Characteristics Beds 88.008 ⃰ ⃰ ⃰ .413 54.563 ⃰ ⃰ ⃰ .240 104.778 ⃰ ⃰ .329 Beds² -6.354 ⃰ ⃰ ⃰ -.268 -3.232 ⃰ ⃰ -.140 -9.423 -.178 Age -3.903 ⃰ ⃰ ⃰ -.446 -3.707 ⃰ ⃰ ⃰ -.412 -7.071 ⃰ ⃰ ⃰ -.740 Age² .021 ⃰ ⃰ ⃰ .321 .019 ⃰ ⃰ ⃰ .290 .047 ⃰ ⃰ ⃰ .608 Parking Spots 19.685 ⃰ ⃰ ⃰ .123 19.854 ⃰ ⃰ ⃰ .129 15.695 .046 Housing Size in 100 sqft 8.633 ⃰ ⃰ ⃰ .258 8.123 ⃰ ⃰ ⃰ .243 15.393 ⃰ ⃰ ⃰ .295 Built Environment Walk Score -1.374 ⃰ ⃰ -.135 -1.327 ⃰ -.127 -2.622 -.258 Walk Score² .015 ⃰ ⃰ .148 .014 ⃰ .130 .035 ⃰ ⃰ .384 Transit Village -47.069 ⃰ ⃰ -.052 -36.421 ⃰ ⃰ -.040 -63.014 ⃰ -.071 Transit Characteristics
Northeast Corridor Line 78.728 ⃰ ⃰ ⃰ .075 83.400 ⃰ ⃰ ⃰ .082 1.938 .002 Light Rail Transit -10.033 -.011 -2.271 -.002 -68.500 ⃰ ⃰ -.101
0 0.5 1 1.5 2 2.5 3 0 20 40 60 80 100 120 140 P e rc e n t C h a n g e ( % )
Distance to the New York Penn Station (in Miles)
Neighborhood Characteristics
Population Density in 1,000 1.167 ⃰ ⃰ .057 1.966 ⃰ ⃰ .069 .870 .067 Proportion of the White 1.193 ⃰ ⃰ ⃰ .107 1.478 ⃰ ⃰ ⃰ .137 -1.155 ⃰ ⃰ -.088
Per Capita Income in $1,000s
5.630 ⃰ ⃰ ⃰ .427 5.984 ⃰ ⃰ ⃰ .444 5.403 ⃰ ⃰ ⃰ .439
Sample Size 1,780 1,501 279
R Square 0.641 0.638 0.730
Dependent Variable: Housing Price in $1,000
7 References
Alonso, W., 1964. Location and land use. Toward a general theory of land rent. Location and land use. Toward a general theory of land rent.
https://doi.org/10.4159/harvard.9780674730854
Barton, M.S., Gibbons, J., 2017. A stop too far: How does public transportation concentration influence neighbourhood median household income? Urban Studies 54, 538–554. https://doi.org/10.1177/0042098015593462
Bowes, D.R., Ihlanfeldt, K.R., 2001. Identifying the Impacts of Rail Transit Stations on Residential Property Values. Journal of Urban Economics 50, 1–25. https://doi.org/10.1006/juec.2001.2214
Cervero, R., Kang, C.D., 2011. Bus rapid transit impacts on land uses and land values in Seoul, Korea. Transport Policy 18, 102–116.
https://doi.org/10.1016/j.tranpol.2010.06.005
Cervero, R., Landis, J., 1997. Twenty years of the Bay Area Rapid Transit
system: Land use and development impacts. Transportation Research Part A: Policy and Practice 31, 309–333. https://doi.org/10.1016/S0965-8564(96)00027-4
Dawkins, C., Moeckel, R., 2016. Transit-Induced Gentrification: Who Will Stay, and Who Will Go? Housing Policy Debate 26, 801–818.
https://doi.org/10.1080/10511482.2016.1138986
Debrezion, G., Pels, E., Rietveld, P., 2007. The Impact of Railway Stations on Residential and Commercial Property Value: A Meta-analysis. J Real Estate Finan Econ 35, 161–180. https://doi.org/10.1007/s11146-007-9032-z
Department of Transportation, New Jersey, 2017. NJ Transit 2017 Annual Report. Duncan, M., 2011. The Impact of Transit-oriented Development on Housing
Prices in San Diego, CA. Urban Studies 48, 101–127. https://doi.org/10.1177/0042098009359958
Efthymiou, D., Antoniou, C., 2013. How do transport infrastructure and policies affect house prices and rents? Evidence from Athens, Greece.
Transportation Research Part A: Policy and Practice 52, 1–22. https://doi.org/10.1016/j.tra.2013.04.002
Ewing, R., Cervero, R., 2010. Travel and the Built Environment. Journal of the American Planning Association 76, 265–294.
https://doi.org/10.1080/01944361003766766
Kay, A.I., Noland, R.B., DiPetrillo, S., 2014. Residential property valuations near transit stations with transit-oriented development. Journal of Transport Geography 39, 131–140. https://doi.org/10.1016/j.jtrangeo.2014.06.017
Kim, K., Lahr, M.L., 2014. The impact of Hudson-Bergen Light Rail on residential property appreciation. Papers in Regional Science 93, S79– S97. https://doi.org/10.1111/pirs.12038
Langford, M., Higgs, G., Fry, R., 2012. Using floating catchment analysis (FCA) techniques to examine intra-urban variations in accessibility to public transport opportunities: the example of Cardiff, Wales. Journal of Transport Geography 25, 1–14.
https://doi.org/10.1016/j.jtrangeo.2012.06.014
Lees, L., Slater, T., Wyly, E.K. (Eds.), 2010. The gentrification reader. Routledge, London; New York.
Manaugh, K., El-Geneidy, A., 2011. Validating walkability indices: How do different households respond to the walkability of their neighborhood? Transportation Research Part D: Transport and Environment 16, 309–315. https://doi.org/10.1016/j.trd.2011.01.009
Monson, M., 2009. Valuation Using Hedonic Pricing Models 14.
Mulley, C., Ma, L., Clifton, G., Yen, B., Burke, M., 2016. Residential property value impacts of proximity to transport infrastructure: An investigation of bus rapid transit and heavy rail networks in Brisbane, Australia. Journal of Transport Geography 54, 41–52.
https://doi.org/10.1016/j.jtrangeo.2016.05.010
Noland, R.B., DiPetrillo, S., Lahr, M.L., 2012. Residential Property Values and New Jersey Transit Village Program. Transportation Research Record 2276, 78–88. https://doi.org/10.3141/2276-10
Pagliara, F., Papa, E., 2011. Urban rail systems investments: an analysis of the impacts on property values and residents’ location. Journal of Transport Geography 19, 200–211. https://doi.org/10.1016/j.jtrangeo.2010.02.006 Pan, Q., 2013. The impacts of an urban light rail system on residential property
values: a case study of the Houston METRORail transit line. Transportation Planning and Technology 36, 145–169. https://doi.org/10.1080/03081060.2012.739311
Peter Moskowitz, 2017. How to Kill a City: Gentrification, Inequality, and the Fight for the Neighborhood. New York, NY: Nation Books.
Pivo, G., Fisher, J.D., 2011. The Walkability Premium in Commercial Real Estate Investments. Real Estate Economics 39, 185–219.
https://doi.org/10.1111/j.1540-6229.2010.00296.x
Saghapour, T., Moridpour, S., Thompson, R.G., 2016. Public transport accessibility in metropolitan areas: A new approach incorporating population density. Journal of Transport Geography 54, 273–285. https://doi.org/10.1016/j.jtrangeo.2016.06.019
Slater, T., 2006. The Eviction of Critical Perspectives from Gentrification Research. International Journal of Urban and Regional Research 30, 737– 757. https://doi.org/10.1111/j.1468-2427.2006.00689.x
Song, Y., Knaap, G.-J., 2003. New urbanism and housing values: a disaggregate assessment. Journal of Urban Economics 54, 218–238.
https://doi.org/10.1016/S0094-1190(03)00059-7
Zuk, M., Bierbaum, A.H., Chapple, K., Gorska, K., Loukaitou, A., Ong, P., Thomas, T., 2015. Gentrification, Displacement and the Role of Public Investment: A Literature Review.
Zuk, M., Bierbaum, A.H., Chapple, K., Gorska, K., Loukaitou-Sideris, A., 2018. Gentrification, Displacement, and the Role of Public Investment. Journal of Planning Literature 33, 31–44. https://doi.org/10.1177/0885412217716439