FOSS4G DATE FOR DSM GENERATION:
SENSITIVITY ANALYSIS OF THE
SEMI-GLOBAL BLOCK MATCHING PARAMETERS
L. Lastillaa, b,∗, R. Ravanellia, F. Fratarcangelia, M. Di Ritaa, A. Nascettic, M. Crespia, b a
Geodesy and Geomatics Division, DICEA - University of Rome “La Sapienza”, Rome, Italy b
Sapienza School for Advanced Studies, Rome, Italy
cGeoinformatics Division, Department of Urban Planning and Environment -KTH Royal Institute of Technology, Stockholm, Sweden
<lorenzo.lastilla, roberta.ravanelli, francesca.fratarcangeli, martina.dirita, mattia.crespi>@uniroma1.it [email protected]
KEY WORDS:DSM generation, High Resolution Optical Satellite Imagery, Semi-Global Matching, Free and Open Source Software for Geospatial
ABSTRACT:
DATE (Digital Automatic Terrain Extractor) is a Free and Open Source Software for Geospatial (FOSS4G), which combines pho-togrammetric and computer vision algorithms in order to automatically generate DSMs from multi-view SAR and optical high resolu-tion satellite imagery, following an iterative and pyramidal workflow in order to refine a coarse DSM used as reference. Consequently, DATE is able to face both the issues of DSM generation and epipolar resampling of satellite imagery. The aim of this work is to evaluate DATE performance, by carrying out a sensitivity analysis based on the dense matching parameters. In particular, DATE imple-ments the Semi-Global Block Matching (SGBM) algorithm, a modified version of Semi-Global Matching method: thus, the sensitivity analysis aims at assessing how SGBM parameters - namely, the difference between maximum and minimum disparity (ndisparities), the minimum disparity value (minimumDisp) and the matched block size (SADWindowSize) - affect the efficiency of the disparity map computation and the final DSM accuracy. The analysis focuses on the case study of Trento and of the Adige Valley, which was chosen due to its geomorphological heterogeneity and complexity, allowing to perform an accuracy evaluation on four tiles, characterized by specific roughness frequencies and morphologies (thus having different effects on disparity variations). Several practical indications on the optimal and critical parameter combinations were retrieved; in addition to this, this work highlighted the most influential parameters both in terms of accuracy (minimumDisp) and computation time (ndisparities), paving the way to further principal component analyses. Finally, the obtained results showed no clear relationship between the area morphology and the solution structure.
1. INTRODUCTION
Digital Surface Models (DSMs) play a role of primary impor-tance in several processes, disciplines and research fields, since they are a numeric representation of the elevation of the first re-flective surface of the Earth, which can be easily studied and automatically processed in an efficient way. Several surveying and remote sensing technologies allow for retrieving data use-ful to DSM generation, such as terrestrial and airborne LiDAR and photogrammetry, SAR and optical satellite imagery. Among them, satellite photogrammetry can offer a compromise among preprocessing and processing time and costs, accuracy and area covered. Nevertheless, satellite images are characterized (if com-pared to terrestrial ones) by significant distortions, due to optical-geometric sensor characteristics and to atmospheric refraction. For this kind of images, thus, the epipolar geometry, which is useful to the photogrammetric process, is quite challenging to achieve; in other words, the epipolar resampling represents a dif-ficult issue to solve (Kim, 2000). Several studies have been car-ried out in order to define the epipolar model for satellite sensors and how to actually achieve epipolar image resampling (Koh and Yang, 2016).
The software involved in this study, DATE - Digital Automatic Terrain Extractor -, aims at innovatively facing exactly the afore-mentioned issues, that is epipolar resampling of satellite images and DSM generation. Indeed, DATE is an open source plugin (FOSS4G) of OSSIM, a wider tool able to handle and process
∗Corresponding author.
a large amount of images; it can be downloaded from GitHub repository athttps://github.com/Geod-Geom/opencv_dsm. To the present state-of-art, DATE mixes photogrammetric and computer vision algorithms in order to refine a coarse DSM au-tomatically, starting from multi-view SAR and optical high res-olution satellite imagery, according to an iterative and pyramidal workflow (Di Rita et al., 2017),(Di Rita et al., 2018).
An important part of this process consists of the generation of a disparity map, which relies on a matching algorithm; in partic-ular, DATE implements a version of the Semi-Global Matching (SGM) algorithm (Hirschm¨uller, 2005), that is the Semi-Global Block Matching (SGBM), whose parameters have been analyzed in this work; as a matter of fact, a sensitivity analysis was per-formed, and the impact of the SGBM parameters on the efficiency of the disparity maps computation and final DSM accuracy was evaluated.
Specifically, the accuracy assessment consisted of a 2.5D com-parison between DSMs generated from optical satellite images, and an already available reference DSM produced with LiDAR technology. The case study chosen for this analysis was the site of Trento and Adige valley, due to its geomorphological hetero-geneity and complexity. Indeed, the sensitivity analysis was per-formed for the purpose of finding the most significant SGBM pa-rameters in terms of accuracy and computational efficiency, but also of investigating the relationship existing between matching parameters and area morphology. The optical dataset consisted of a pair of two along-track Pl´eiades-HR1 images acquired in Au-gust 2012, with a 20×20 km2footprint.
2. DATE WORKFLOW AND SEMI-GLOBAL MATCHING STRATEGY
From what has been previously recalled, DATE is able to auto-matically refine a coarse DSM starting from multi-view optical or SAR high resolution satellite imagery. Because the first type only was involved in the sensitivity analysis performed in this work, just the main aspects of DATE workflow concerning op-tical satellite images will be hereinafter summarized. First, it is important to stress the fact that DATE uses a set of optical images and a coarse DSM as input and produces orthorectified images and a finer DSM (having the required resolution) in output. 2.1 DATE core procedure
DATE core process can be summarized as follows:
1. raw images are projected in a ground geometry through the coarse DSM and thanks to rational polynomial coefficients (RPCs) provided by the vendors along with the images; 2. because we are far from the perfect knowledge of the area
morphology and of image orientation (linked to DSM and RPCs accuracy respectively), the ground images are affected by local pixel disparities lined up in a prevailing direction. In order to achieve a quasi-epipolar geometry, a preliminary rotation for both images is firstly estimated by means of the RPCs, with the aim of aligning them in the disparity prevail-ing direction. DSMs errors can cause also transversal paral-laxes with respect to disparity prevailing direction; this de-viation from the quasi-epipolar geometry has to be avoided as much as possible, by choosing an appropriate ground im-age spatial resolution; the results of this procedure are the so-called Ground quasi-Epipolar Images (GrEI);
3. once the quasi-epipolar geometry has been achieved, it is possible to carry out dense image matching exploiting the epipolar geometry search strategy, with the aim of generat-ing a disparity map (shargenerat-ing the DSM reference frame); in particular, disparity map calculation is demanded to Semi-Global Matching method;
4. since disparities are computed in the object space, it is suffi-cient to sum them (previously converted into height correc-tions) to the coarse DSM exploited as a reference for the ini-tial projection, in order to get the final DSM. The disparity-to-height conversion procedure is based on the computation of a conversion factorCf actor.
This procedure can be iteratively repeated by adopting a coarse-to-fine pyramidal scheme – which is based on a multi-resolution imagery approach –, that is the possibility to use the DSM re-sulting from theithstep as a priori DSM of the(i+ 1)thone. Therefore at each step the a priori DSM contains finer and finer details, reducing the parallax error and thus allowing to progres-sively increase the ground image resolution (which is increased by a factor of 4 at each step).
2.2 Semi-Global Matching
As far as concerns the matching strategy, a more detailed de-scription is given, due to its central role in this work. The Semi-Global Matching (SGM) method successfully combines concepts of global and local stereo methods for accurate, pixel-wise match-ing at low runtime, offermatch-ing a very good tradeoff between these two aspects (Hirschm¨uller, 2011). The SGM final result is a dis-parity image, which is produced on the basis of two fundamental issues:
1. the need to define metrics to evaluate the difference between corresponding pixels, i.e. a pixel-wise matching cost: the SGM first implementation was based on Mutual Information (Hirschm¨uller, 2005), but following studies concluded that Census is the most robust matching cost for stereo vision (Hirschm¨uller and Scharstein, 2009);
2. the importance of a strategy to prevent excessive and unreal-istic neighboring disparity changes (smoothness constraint).
The pixel-wise cost and the smoothness constraints are expressed by defining an energy functionE(D), that depends on the dis-parity imageD. The stereo matching problem can thus be solved by finding the disparity imageDwhich minimizesE(D). Be-cause a 2D minimization is NP-complete for many discontinu-ity preserving energies, though, the energy function is minimized along individual rows: in order to avoid the problems related to 1D minimization (streaking), the Semi-Global Matching method proposes to aggregate matching costs in 1D from all directions equally.
The SGM version implemented by cv::StereoSGBM, that is the OpenCV class exploited by DATE for disparity map computation, is slightly different from the Hirschm¨uller one (cv::StereoSGBM Class Reference, 2018). One of the most important differences is that the algorithm does not match individual pixels, but pixel windows with a fixed size. The OpenCV class contains several members and variables; hereinafter just the parameters evaluated in the sensitivity analysis are presented:
• minimum disparity value (minimumDisp);
• difference between maximum and minimum disparity ( ndis-parities): it is always greater than zero and it must be divis-ible by 16 in the current implementation;
• matched window size (SADWindowSize), which must be an odd natural number and is usually chosen in the range3−11.
3. CASE STUDY
The analyzed region includes Trento and the Adige valley (North-ern Italy); its latitude ranges from46.024◦to46.09◦N, while its longitude from 11.058◦ to 11.165◦. This area was chosen as case study because it shows a great variety in terms of land cov-ers and land uses (such as urban areas, agricultural ones, forested hills and mountains), slope and altitude (which ranges from 200 to 1500 m). The area heterogeneity is strictly related to variations in terms of frequency of surface irregularities (such as buildings, isolated trees and so on) and, consequently, to disparity changes between consecutive pixels.
The optical dataset consists of a couple of along-track Pl´eiades-HR1 images, acquired in August 2012 in North-South scan direc-tion and provided with respective RPCs and metadata (an image of the stereo pair is shown in Figure 1) . The average incidence angles in along-track direction are13◦and−19◦with respect to the nadir (the resulting intersection angle is equal to32◦), while the angles in across-track direction are close to zero. The native mean GSD varies between 0.72 and 0.78 m, depending on the viewing direction; however, the images were oversampled and supplied to the user with a 0.50 m GSD. The stereo pair covers a ground area of20×20km2.
As far as concerns the coarse DSM employed in the first step of DATE pyramidal process, a tile of the SRTM digital model (4.1
Figure 1: Pl´eiades-HR1 image Corner Longitude(◦) Latitude(◦) Upper Left 9.9995836 50.0004170 Lower Left 9.9995836 44.9995837 Upper Right 15.0004170 50.0004170 Lower Right 15.0004170 44.9995837 Table 1: Geographic coordinates of SRTM tile corners version) was used. The tile corner coordinates are shown in Table 1.
In order to assess DSMs accuracy, once their generation had been completed, a LiDAR DSM was used as reference; it was freely provided by “Provincia autonoma di Trento” and characterized by a grid dimension of1.0×1.0m and by a mean elevation accuracy of 0.25 m.
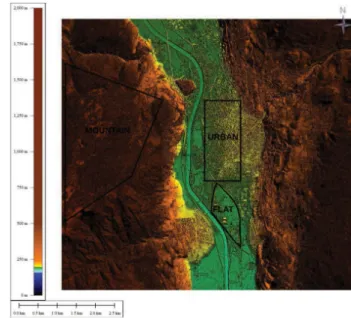
The generated DSMs and LiDAR one have been cut in order to completely overlap. Moreover, three tiles, having specific proper-ties in terms of morphology and land use, were selected out of the analyzed area, in order to locally evaluate the effect of SGBM pa-rameters variation. An urban area (where we expected significant disparity changes due to the alternation of buildings and narrow streets), a flat area (where small disparity differences are more likely) and a mountain and forested area (characterized by high slopes) were selected.
The LiDAR DSM used as reference and the three tiles are visible in Figure 2.
4. SENSITIVITY ANALYSIS
From what has been previously recalled, the sensitivity analy-sis performed in this work conanaly-sisted of the evaluation of some DSM generation process indicators and of their dependence on the three aforementioned SGBM parameters, particularly:
• statistical quality indicators related to the elevation differ-ence between the generated DSMs and the referdiffer-ence one; • a measure of the time required to produce a disparity map
through SGBM algorithm.
Figure 2: LiDAR reference DSM and analyzed tiles The SGBM parameters choice moved within the rules expressed by the OpenCV Class Reference. Because of this, initially ndis-paritiesvalues were chosen within the array{32,64,96,128}, which contains multiples of 16 only;minimumDispwas set equal to an integer in the array{−32,−16,0}, thus excluding highly negative values, whereasSADWindowSize, which should range from 3 to 11 assuming odd values only, was chosen equal either to 1, 3, 7 or 11 from trial to trial.
These sets of choices resulted in 48 combinations; after a first analysis of the statistical indicators calculated for the whole area of interest, a trend was noticed for tests having the following char-acteristics:
• a negativeminimumDispvalue; • ndisparities>|minimumDisp|.
In order to achieve a better comprehension of this trend and of possible relationships between SGBM parameters, another series of four tests was performed, keepingndisparitiesfixed to128and minimumDispto−64.
It is worth mentioning that, in all cases, the final DSM grid cell – related to GrEI spatial resolution – was set to1.0×1.0m2, the same as LiDAR DSM one, because optimal with respect to raw image resolution and to epipolar resampling process, allow-ing to exploit all the radiometric information content of satellite imagery. This choice was also useful to pixel-wise compare the reference DSM and the generated ones.
5. ACCURACY ASSESSMENT AND RESULTS In order to evaluate the global and local accuracy of the generated DSMs, the whole area and the three tiles were all compared to the corresponding LiDAR ones, by computing a pixel-wise elevation difference∆Zi=ZDSM,i−ZREF,i. The differences obtained
in this way underwent the following statistical analysis: first of all, a threshold∆Z = 100m was set, with the aim of eliminating the values out of the range(−100,100), mainly outliers related to non-reconstructed areas.
1. mean elevation difference, which was calculated as∆¯Z = 1
n
Pn
i=1∆Zi, wherenis the sample size;
2. standard deviation, useful to assess DSM precision, was cal-culated asσ∆Z= q Pn i=1(∆Zi− ¯ ∆Z)2 n ;
3. RMSE, that was used to assess DSM accuracy and was cal-culated asRM SE= q ¯ ∆Z2+σ2 ∆Z= p1 n Pn i=1∆Zi2;
4. Linear Error 95 (LE95), which identifies a range( ¯∆Z − LE95,∆¯Z+LE95)containing the95%of sample values.
Therefore it was possible to distinguish immediately the best and the worst SGBM parameters combination, in terms of reconstruc-tion accuracy, for all tiles. In Table 2 these combinareconstruc-tions are dis-played, accompanied by the respective RMSE values.
Table 2 suggests that aminimumDispvalue of−16is ideal and that combination{32,−16,11}produces the most accurate re-sults for local tiles; on the other hand, it emerges that the couple {32,−32}is particularly critical.
The whole tile error map and discrepancy histogram (both for the best and the worst case), shown in Figure 3 and Figure 4, are useful to get a better comprehension of the error sources and distribution.
Even for the best DSM obtained, it is clear the influence of sys-tematic errors in Figure 3(a), because the geomorphological fea-tures of the area are immediately evident. Indeed, the highest errors occur in the mountain and urban areas, respectively char-acterized by the presence of shadows and occlusions, which can significantly decrease the efficiency of the matching process. The worst combination produces a completely biased model with a highly positive mean error: this is clearly shown by Figure 4(b), where the discrepancy histogram has a significant tail.
However, if we consider the whole set of tests carried out, the considerations drawn from Table 2 are confirmed: first of all, the optimal value ofminimumDispis always−16, no matter which tile we are considering. This aspect is shown clearly by the plot represented in Figure 5(a), which refers to the whole tile and keepsndisparitiesfixed to128, whileminimumDispand SAD-WindowSizevary. It is worth noticing that the RMSE reflects important variations, thus it is reasonable to state that the mini-mumDispparameter highly affects the final accuracy. The same trends would figure in similar plots with a different value of ndis-paritiesand for a different tile. On the other hand, the other two parameters have a small impact on the DSM accuracy - an exam-ple of this is visible in Figure 5(b) and Figure 5(c), both related to the whole tile: they show RMSE variations with respect to ndis-paritiesandSADWindowSizeparameters, assuming the optimal situation of minimumDisp =−16.
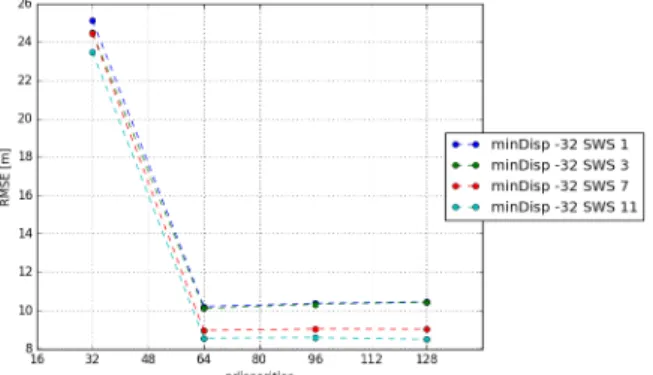
The second general conclusion – i.e. independent from the con-sidered tile – which can be drawn (confirming what suggested by Table 2) is that the worst results are obtained having simultane-ouslyndisparities=32andminimumDisp=−32. The choice to set this couple of parameters is critical because it forces disparity to assume negative values only. As an example, Figure 6 shows that RMSE even doubles for DSMs generated with combination {32,−32}, rising up to an error higher than 20 m.
For the local tiles, instead, even if RMSE changes in absolute value from tile to tile, the solution structure is stable and seems not depending on geomorphological features and land cover (as
it was expected initially); this makes the SGBM algorithm more user-friendly, because the parameter choice is not reliant on site characteristics.
The main consideration which can be drawn is that the global tile and the local ones share the best and worst combinations of pa-rameters, but, having chosen the optimal value ofminimumDisp, the influence ofndisparitiesandSADWindowSizeslightly differs. As far as concerns the other indicator, that is the computing time requested to SGBM to generate a disparity map, it is mainly af-fected byndisparitiesparameter, with a trend that can be con-sidered nearly linear, as it is shown by Figure 7 (where mini-mumDispis set to the optimal value, but the same trend would be visible for other values of this parameter).
6. CONCLUSIONS AND OUTLOOK
The aim of this work was to evaluate the influence of Semi-Global Matching parameters on DATE performance, more specifically on generated DSMs accuracy and on disparity map processing time, for the case study of Trento and of the Adige valley, due to its geomorphological heterogeneity. The sensitivity analysis was carried out for4tiles (a global and three local ones), characterized by specific roughness frequency and morphology.
As a matter of fact, the main goal was accomplished, because some practical indications were retrieved, such as:
• the optimal value – in terms of RMSE – ofminimumDisp, equal to−16;
• the worst combination, with respect to the same accuracy indicator, ofndisparitiesandminimumDisp, particularly the {32,−32};
• the existence of a nearly linear relationship between ndis-paritiesand computing time.
However, this work highlighted, more than anything else, that the most influent parameter in terms of accuracy is theminimumDisp one, paving the way to further principal component analyses, which will exclude exactlyminimumDisp and test other set of variables, in order to find which other has the greatest effect on the result.
On the other hand, since the solution structure does not seem de-pending on the tile characteristics, it was not possible to define a specific ideal combination of parameters for the desired morphol-ogy. Nevertheless, the inclusion in the analyses of further vari-ables such as image resolution, which conditions the area rough-ness frequency, could help for a better comprehension of the rela-tionship existing between SGBM parameters and area morphol-ogy.
Another aspect which could be taken into account in future stud-ies could be the stereo pair intersection angle (depending on im-ages off-nadir angles), which has a direct influence, for exam-ple, onndisparities(difference between maximum and minimum value of disparity).
REFERENCES
cv::StereoSGBM Class Reference, 2018. https://docs. opencv.org/trunk/d2/d85/classcv_1_1StereoSGBM. html. Online; accessed October, 2018.
Tile Best combination RMSE(m) Worst combination RMSE(m) Whole {128,−16,3} 6.85 {32,−32,1} 25.12 Flat {32,−16,11} 2.86 {32,−32,1} 26.31 Urban {32,−16,11} 6.76 {32,−32,1} 25.86 Mountain {32,−16,11} 6.49 {32,−32,7} 25.36 Table 2: Best and worst combinations with respective RMSE values for all tiles
(a) Best parameter combination - whole tile (b) Worst parameter combination - whole tile
Figure 3: Error maps
(a) Best parameter combination - whole tile (b) Worst parameter combination - whole tile
Figure 4: Discrepancy histograms
(a) RMSE variation with respect to minimumDisp and SADWindowSize (ndisparities = 128, whole tile)
(b) RMSE variation with respect to ndisparities and SADWindowSize (minimumDisp = -16, whole tile)
(c) RMSE variation with respect to SADWindowSize and ndisparities (minimumDisp = -16, whole tile)
Figure 6: RMSE variation with respect to ndisparities and SAD-WindowSize (minimumDisp = -32, whole tile)
Figure 7: Processing time for optimal value of minimumDisp Di Rita, M., Nascetti, A. and Crespi, M., 2017. FOSS4G DATE assessment on the ISPRS optical stereo satellite data: a bench-mark for DSM generation. The International Archives of Pho-togrammetry, Remote Sensing and Spatial Information Sciences 42, pp. 635.
Di Rita, M., Nascetti, A. and Crespi, M., 2018. FOSS4G DATE for DSMs generation from tri-stereo optical satellite images: de-velopment and first results. European Journal of Remote Sensing 51(1), pp. 472–485.
Hirschm¨uller, H., 2005. Accurate and efficient stereo processing by semi-global matching and mutual information. In: Computer Vision and Pattern Recognition, 2005. CVPR 2005. IEEE Com-puter Society Conference on, Vol. 2, IEEE, pp. 807–814. Hirschm¨uller, H., 2011. Semi-global matching-motivation, devel-opments and applications. In: Photogrammetric Week, Vol. 11, Wichmann Verlag Heidelberg, Germany, pp. 173–184.
Hirschm¨uller, H. and Scharstein, D., 2009. Evaluation of stereo matching costs on images with radiometric differences. IEEE transactions on pattern analysis and machine intelligence 31(9), pp. 1582–1599.
Kim, T., 2000. A study on the epipolarity of linear pushbroom images. Photogrammetric engineering and remote sensing 66(8), pp. 961–966.
Koh, J.-W. and Yang, H.-S., 2016. Unified piecewise epipolar resampling method for pushbroom satellite images. EURASIP Journal on Image and Video Processing 2016(1), pp. 11.