Projects and Programs Evaluation. Risks, resources,
activities, portfolio and project management
IT PROJECT METRICS
Ion IVAN1PhD, University Professor, Department of Economic Informatics University of Economics, Bucharest, Romania
Author of more than 25 books and over 75 journal articles in the field of software quality management, software metrics and informatics audit. His work focuses on the analysis of quality of software applications.
E-mail: [email protected] , Web page: http://www.ionivan.ro Adrian VISOIU2
PhD Candidate, Assistant Lecturer, Economic Informatics Department, University of Economics, Bucharest, Romania
E-mail: [email protected] Dragos PALAGHITA3
4th year student, University of Economics, Bucharest, Romania
E-mail: [email protected]
Abstract: The objectives of IT projects are presented. The quality requirements that these
projects must fulfill are established. Quality and evaluation indicators for running IT projects are built and verified. Project quality characteristics are presented and discussed. Model refinement for IT project metrics is treated and a software structure is proposed. For an IT project which is designed for software development, quality evaluation and project implementation mode metrics are used.
Key words:IT metrics; IT projects; quality; quality characteristics
1. IT projects
They represent an important category of projects and their management implies specific particularities because:
- Their unique character; informatics systems and software are developed only one
time to bring in new solutions;
- The reproduction of the resulted products is defined by costs nearing zero,
determined by the possibility to make copies on modern storage devices;
- The work force used to develop the IT project is highly qualified and represents,
in most cases, over 85% of the projects value;
- The development cycle of an IT project must include without question solution
improvement stages to bring in the latest technologies in the field; neglecting these new technologies will lead to an old solution which may be rejected by the beneficiaries and the informatics market;
Projects and Programs Evaluation. Risks, resources,
activities, portfolio and project management
- The structure of the development cycle is adapted the pursued objective, the allocated resources, which leads to decisions regarding the continuance or abandonment of the projects, when the reviewed efficiency criterion suggest one of the two choices; this explains the fact that of 100 projects, over 50 are abandoned in the development process, only 10 projects get in maintenance and only 2-3 go in to the reengineering process;
- In the context of an evolving information and knowledge based society, all IT projects must be oriented to be user friendly, in order to grant free access to broader categories of information to every citizen.
IT project imply vast amounts of money. For projects in constructions, the amount of money needed range between thousands and millions of euros, and the resulting product is tangible, it becomes functional and is directly perceived.
For IT projects the amount of money needed starts from ten thousands euros and finally the result can only be seen in computers and networks, which are no more than 15% of the projects value. The hidden part of 85% must prove its efficiency through functionality, in time. This is why it is necessary building IT project metrics, to measure:
- How are the resources used;
- Which are the products’ performances;
- How efficient will the products be in exploitation;
- Which are the risks of not finishing the project or to compensate deviations from the project.
Currently there are numerous metrics for every software typology, for every quality characteristic and for cost estimation.
It is important these metrics are analyzed and a practical approach for using quantitative methods is developed such that in the IT field the grounds of decisions will change the structure of projects and make the number of projects that get reengineered to increase.
2. Quality characteristics of IT projects
The IT projects quality characteristics form a dynamical, complex and optimal system.
The systemic character is given by the interdependences between characteristics. At a given time t, a quality characteristic of a project positively influences the level of another characteristic at time t+1. Also, that characteristic has a negative influence on the level of another quality characteristic.
The dynamic character is linked to the fact that interdependence intensity between characteristics varies in time. More, the importance of quality characteristics changes from one IT project to another, from user to user or even inside the project, the modification occurs from one stage of the project to another.
The complex character resides in the large number of quality characteristics, in the number of interdependencies, and mostly in the directions in which they manifest. The accumulated experience in elaborating and implementing projects shows that the characteristics system becomes more complex as the objectives are better pursued and the level of performance is higher.
Projects and Programs Evaluation. Risks, resources,
activities, portfolio and project management
The optimality of the quality characteristics system oversees the quantitative side of costs that the tendency to plan and complete projects with a higher quality level generates.
There is a solution of the quality optimization model that shows the moment in which the improvement of quality is no longer sustained through costs, which are far grater than the costs needed to fix the corresponding defects of a lower quality level of the IT project.
If M is considered the number of the quality characteristics C1, C2, ..., CMof the projects, for each characteristic must be stated:
- the content ;
- the factors of influence; - the associated models
- the use of indicators in taking decisions; - the indicators aggregation.
Complexity is the characteristic used in differentiating projects. A project Ai is more
complex than a project Aj if:
- the type number of resources used is grater;
- the number of stages through which the project is finished is grater; - the number of machines used is grater;
- the number of different operations done by each machine is grater; - the qualification needed by workers to operate the machines is higher; - the number of links between stages is grater;
- the execution time is grater; - the organizational effort is grater;
- the density of execution procedures is higher.
A graph is associated to the project Ai in which the nodes are either stages or activities, and the arcs are the ones that set the precedence. If:
- ni
1 – the number of nodes of the graph G(Ai) for the project Ai - ni
2 – the number of arcs which link the nodes of the graph G(Ai) the complexity CP of the project Aiin a Halstead way is given by:
CP(Ai)=ni1 log2 ni1 + ni1 log2 ni2
A project Aiis more complex than a project Ajif and only if:
CP(Ai)>CP(Aj) Meaning ji i ji i n j n i n j n i
n
n
n
n
2 2 1 1)
(
)
(
)
(
)
(
2 2 1 1⋅
>1If in time in an organization projects are implemented of which a project Akis considered a model, the relative complexities of the projects CR(A1), CR(A2), …, CR(AM) are obtained from:
(Ai) CR(Ai) =──
Projects and Programs Evaluation. Risks, resources,
activities, portfolio and project management
The project model has the relative complexity CR(Ak) =1.
The K completeness of project K is a quality characteristic which refers to two aspects:
Ko – the completeness of the offer regarding the content of the document which is under evaluation
Ki – the completeness of the implementation regarding the stages developing process and the completeness of the process
If p1 is the percentage of the elaboration stage of the offer and p2 is the percentage of the developing of the project p1+p2 = 1 and p1, p2
∈
(0,1) it results that the level of completeness KP of project Aiis given by:KP= p1*Ko+p2*Ki.
The level of completeness K of any construction regards:
np – the number of parts imposed to consider the construction accepted
nr – the number of parts effectively realized and the relation is obtained:
K =
}
,
max{
}
,
min{
nr
np
nr
np
A project contains:- eligibility criterion to which variables that belong to {0,1} are associated to; if in the project the imposed requirements are respected the value 1 is given to a criterion Cri; if a project must fulfill L eligibility criterions the indicator IL =
∏
= L i i 1
α
is calculated where αi is the level of the Cri criterion, αi
∈
{0,1};- the technical side definition, in which definitions are given, processes are described, models are built; the completeness refers to the degree in which these descriptions include all the components known by specialists; the descriptions must offer a suggestive picture in connection with what is going on in the actual choused domain; there must not be a lack of elements which by their absence:
o prove that the authors do not have a grasp on the domain;
o show that the authors of the project do not have knowledge of materials,
equipment, processes, operations, effects and models.
The specialists that analyze a new project have a clear image about the structure that includes mandatory parts, minimum requirements and by comparison see what is missing or what has been treated shallow.
Clarity is a very important characteristic not only for the offer made for a project but
also to the development process.
The offer is a text. The implemented project is a product, a service, an action. The clarity of text Ti associated with project Aiis analyzed in the following manner: - the text Ti is decomposed in parts ai1, ai1, ..., air;
- each part aij, j = 1,2,…,r, is connected with resources, actions and equipments; - the logic content of aij with the logic of the process development;
Projects and Programs Evaluation. Risks, resources,
activities, portfolio and project management
If the pairs parts of text – resources are completely defined then the text T is clear. If parts of text or resources are not paired, the project does not have a good clarity level. The clarity is influenced in a negative way by pairs in which for different parts of text the same resources come up.
The necessity of defining probabilities which are associated with the pairs (aij, rp) also has a negative influence on clarity.
Correctness is quality characteristic of a project, through which the ones that make the offer ant participate in the development of the project ensure:
- the concordance between theory and practice
- the use of results obtained by other specialists, results that were verified in practice;
- the use of concepts as they were defined, maintaining the context unaltered; - respecting the defined procedures for executing operations;
- through all the means used, that the requirements imposed by obtaining a high level of quality for the product or service in its final form, are respected.
The correctness of a project offer is demonstrated, and the correctness of a product or the execution of a service is pointed out either by analysis, or by establishing the effects the product or service will generate. A product or a service is correctly or incorrectly realized.
If it is accepted that the product or service is partially correct, the correctness measuring indicator moves from the values 0 or 1 to the interval [0,1].
The problem of correctness in calculating costs and efficiency regards: - the hypothesis on the basis of which the efficiency calculations are made;
- establishing the expenses levels for each chapter by pointing out quantities, unitary price, and interval limitation;
- using the calculation models as they were defined;
- bounding the variables regarding specific consumes through comparative analysis with projects already implemented;
- respecting the control keys;
- respecting the inequalities regarding the expense structure in conditions of the impossibility of not transmitting from one capital to another of the expenses. For the definition of IT projects the following are defined:
- the criterions Cr1, Cr2, …, Crh ;
- the domains of variation measured for each criterion [a1, b1], [a2, b2], …, [ah, bh]. If for criterion Cri the level xi is measured, then the correctness of the project is given by: CG =
∏
= h i 1 xi∏
= h i 1 ai ≤ CG ≤∏
= h i 1 bi.The correctness norm is realized by defining the relation:
∏
= h i i ib
a
1 ≤ CGN =∏
= h i i ib
x
1 ≤ 1Projects and Programs Evaluation. Risks, resources,
activities, portfolio and project management
There are numerous cases in which the relative correctness of a criterion Cri is obtained using a report like:
CRi = i i
h
A
Where:A – the number o fulfilled sub criterions
h – the total number of subcriterions In this case the global correctness is
CG= h h i i
CR
1 1)
(
∏
=Consistency is a quality characteristic which is used to point out to what extent an
IT project is built respecting precise rules, without including components which have the role of annihilating what was prior executed.
The text of the project includes stages, chapters developed in ascendant order with the next components being constructed based on the ones before.
A project is under defined if the text or the product doesn’t contain those elements that insure its functionality.
The project is over defined if it includes a lot more components than necessary. The numerous details make it hard to accomplish, and the function for which it is constructed is lost among many other functions, some having nothing in common with the initial objective.
Only a defined project, in which every component has its role well established, is a consistent project.
A project structure, SP, is considered, having the complexity C (SP), structure which corresponds to projects, products or IT services considered to be functional, which exist and have a degree of satisfaction at user level grater than 0.8, the degree of satisfaction is given by:
GS=NF/NT
Where
NF – the number of users that have successfully finished the problem for which they used the resources of the project;
NT – the total number of users that accessed the resources belonging to the project. The consistency CO for the project Ai is given by:
CO =
)}
(
),
(
max{
)}
(
),
(
min{
i iA
C
SP
C
A
C
SP
C
Ability to complete is another characteristic that all evaluators take in consideration and it is influenced by:
- the experience of the team which proposes a solution for an IT problem; - the estimation of resources used for implementing the solution;
- the estimated duration of the project;
Projects and Programs Evaluation. Risks, resources,
activities, portfolio and project management
The practice of elaborating an offer and implementing it presume: - knowledge of technologies;
- rigorous knowledge of duration and minimal and maximal consumptions necessary to complete activities;
- the correct defining of precedence;
- identifying the operations needed to prepare; - building a timeline for activities;
- regrouping the activities such that the equipment and highly qualified workforce are efficiently used.
If in a project are identified:
NA – number of activities;
Di – time to complete activity i;
Ki – number of resources necessary for completing activity i;
xij – resource consumption j for completing activity i;
tsi – start time for activity i;
tfi – end time for activity i;
The planned and effective levels are established.
For the planned levels mark p will be used; the planned level for activity xxx will be
xxxp.
For the effective level the mark e will be used, such that variable xxx will have the effective level xxxe.
The indicator IUR regarding the use of resources is built using the relation:
IUR =
∑
∑∑
= = = NA i i NA i ki j ijk
1 1 1α
where αij =⎪⎩
⎪
⎨
⎧
=
rest
the
for
x
x
e ij p ij,
0
,
1
The ability to complete is seen also compared to optimistic or pessimistic attitude manifested by those who make an offer or implement a project.
If the planned level for a resource is xijp, the minimal consumption for completing operation xijmin, and the maximal consumption for a resource is xijmax the level realistic approach is built as the indicator IR given by:
IR =
∑
∑∑
= = = NA i i NA i ki j ijk
1 1 1β
WhereProjects and Programs Evaluation. Risks, resources,
activities, portfolio and project management
βij =
⎪⎩
⎪
⎨
⎧
=
=
rest
the
for
x
x
sau
x
x
p ij ij ij p ij,
1
,
0
min maxReliability is quality characteristic of IT projects which states the degree in which
the stages in the life cycle of the project are developing successfully The life cycle of an IT project includes:
E1- the offer elaboration stage
E2- project implementation stage
E3- the current use of the product resulted after… through the project
E4- the maintenance process
E5- using the product post maintenance
E6- taking the product out of use
Each of these stages has associated an importance coefficient pi, i={1,2,3,4,5,6}. Each stage Ei is characterized by a duration D(Ei).
The physical duration norm of the life cycle of the project is given by:
DFN=
∑
= 6 1 i D(Ei)The corrected duration norm of the project is given by:
DFNC=
∑
= 6 1 i p iD(Ei) DFNC<DFN because pi∈ (0,1)∑
= 6 1 ipi=1 resulting that D(Ei)>piD(Ei) for i=1,2,3,4,5,6.
In the background of every stage processes are running. If a process θj is stopped because of various causes, the duration of the process DP(θj) increases with Δ(θj’) which increase depends on:
− the complexity of the cause that determined the interruption;
− the ability of the team to eliminate the cause;
− the resources that are redirected to eliminate the cause;
− the place where the cause was spotted; as a cause is spotted later, the resources used and durations are increasing;
The physical running cycle norm of the project is identical with the effective duration if and only if Δ(θj)=0
∀
j
∈
N
. In reality, throughout the lifetime there are recorded interruptions of specific stages Δ(Ei), such that the effective duration of the cycle:DFE=
∑
=Δ
+
n i i iE
E
D
1))
(
)
(
(
The norm reliability of the project P,f(P) is given by:
f(P)=
DFE
DFN
Projects and Programs Evaluation. Risks, resources,
activities, portfolio and project management
fc(P)=
DFEC
DFNC
where DFEC=∑
=Δ
+
n i i i i iE
h
E
D
p
1)]
(
)
(
[
where hi i=1,2,3,4,5,6 are the fractions associated to the importance which is given to the duration of process delaying from the stages Ei, i=1,2,..6.Compared to other products or services in which reliability is characterized by quality in use, at the beneficiary, giving the degree in which the product or service accomplishes the set objective, in case of the IT projects, the reliability of a project is mistaken with the reliability of the life cycle because:
− in all the stages the workforce plays an important role, representing more then 85% of the production costs;
− the successful functioning of the finite product strictly depends on the operating of each subsystem; the offer lays down the conceptual foundation and resource allocation; the elaboration of the offer is a stage of the life cycle of the IT project; the offer elaboration process reliability is essential to the entire product;
− the eventual deploying of an reengineering process is meant to redefine basic elements of the offer, and the multiple mobilization effect of the new structure of an IT project is limited to all the other stages that follow.
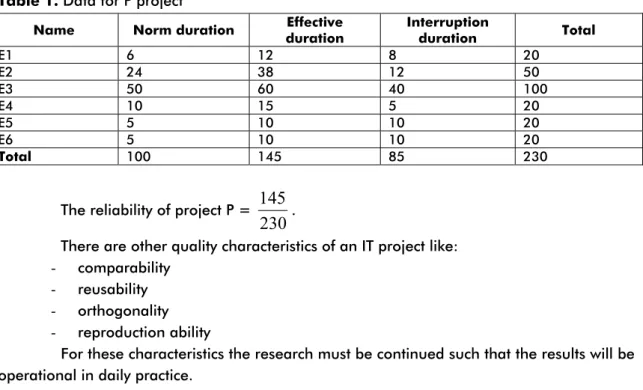
It is important to identify in the existing projects in the databases those variables with the help of which the levels of difference Δ(Ei) are calculated to help compute the effective reliabilities of these projects in the norm version and most of all in the corrected version. Given the Project P in the table 1 below,
Table 1. Data for P project
Name Norm duration duration Effective Interruption duration Total
E1 6 12 8 20 E2 24 38 12 50 E3 50 60 40 100 E4 10 15 5 20 E5 5 10 10 20 E6 5 10 10 20 Total 100 145 85 230
The reliability of project P =
230
145
.
There are other quality characteristics of an IT project like: - comparability
- reusability - orthogonality - reproduction ability
For these characteristics the research must be continued such that the results will be operational in daily practice.
Projects and Programs Evaluation. Risks, resources,
activities, portfolio and project management
3. IT project model quality refinement
Models are built starting from a model of hypothesis. It is necessary to go on to the stage of refining the models. The refinement process consists of:
- Reducing the number of variables;
- Decreasing as much as possible the degree of incorporated nonlinearity ; - Guaranteeing minimal loss of information by using simplified models.
The refinement of IT projects assumes:
- Taking in consideration only the data that is collected usually for elaborating the offer and running the projects;
- Retaining in the indicator stricture the variables that decisively influence the evolution of the project from a practical point of view;
Refinement is made on two levels:
- At the first level, from the set of indicators I1, I2, ..., IMa subset is retained formed by the indicators Ii, Ii+1, ..., Ii+K, K<<M.
- At the second level, the retained indicators operate with the variables Xi, Xi+1, …,
Xi+H, H<<L instead of using the variables X1, X2, ..., XL.
It means that instead of analyzing M characteristics, a number of K characteristics is analyzed.
Instead of L variables, the refined indicators operate with H variables.
The effort must be reduced without significant loss of information obtained from using the metrics. The decisions taken based on the refined metrics of the IT projects must lead to maintaining the process of implementation in the limits recognized acceptability.
IT projects metrics refinement must allow the use of existent data bases, and the implementation of simplified indicators must not be affected by the defined data structures, without requiring new data structures or data reorganization.
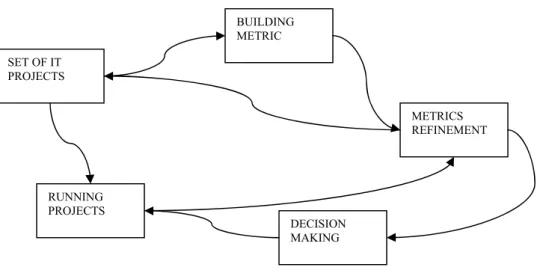
The IT project metrics refinement process is carried on like in figure 1.
Figure 1. Usage of refined models
SET OF IT PROJECTS RUNNING PROJECTS BUILDING METRIC METRICS REFINEMENT DECISION MAKING
Projects and Programs Evaluation. Risks, resources,
activities, portfolio and project management
The refinement process is customizable by defining limits referring to: - the minimum list of variables that defines the indicators;
- the accepted loss of in formation level.
Under the conditions the indicators I1, I2, ..., IK are considered in which the variables
X1, X2, ..., XLare used, through refinement it is imposed: - the maximum number of indicators to be Mmax; - the maximum number of variables to be Hmax; - the error level must not be higher than E.
Refinement presumes:
P1- definition of the initial solution for the refinement process which includes all the K
indicators, all the L variables and the criterion through the measurements are made;
P2- taking the data bases that regard IT projects that have frequent definition classes and best implementation, known as successful projects.
P3- evaluation of indicators I1,I2,…Ik with the data taken from the data bases for the L
variables
P4- calculating the aggregated error criterion
P5- elimination of the xi variable from the indicators
P6- evaluation of the indicators
P7- calculation of the criterion
P8- building the Er i array
P9- repeating the steps P5- P8 to eliminate the variable xi+1 from the list
P10- after building the array Er1,Er2,…ErL it is sorted in descending order and the variables for which the error has the smallest value are eliminated
P11- the steps P5- P10 are repeated until the given error level is obtained; it is possible this level is reached in the first iteration and the refinement process stops;
Once the variable list is refined, the refinement of indicators starts.
P12- the list I1,I2,…IK of indicators and the list of refined variables X1,X2,…XH are considered;
P13- the indicators are calculated using the relation and are considered an initial solution for the aggregate performance indicator
IP0= j H j j
I
p
∑
=1 where pj- weight and a certain level is obtainedP14- the indicator Ik ,k=1…. is eliminated
P15- IP is calculated and a vector α1,α1,… is built
P16- steps P14- P15 are repeated until the indicators are eliminated one by one
P17- α1,α 2,… are ordered decreasing
P18- the indicator which has the smallest error difference with IP0 is eliminated
P19- the steps P14- P18 are repeated until the maximum admitted number for indicators is reached
Projects and Programs Evaluation. Risks, resources,
activities, portfolio and project management
The refinement activity is a repeating process convergent to a stabile process. To complete the refinement simulation methods and genetic algorithms and neuronal networks are built.
4. Software for implementing IT metrics
The software product for evaluating IT projects assumes:
− building a list with K quality characteristics KAL 1, KAL 2, …, KAL k
− building a list of indicators I 1,I 2,…I k
− building a list with M variables
− making the connection between the M variables and fields in the data base
− launching the refinement process
− obtaining a sublist of characteristics with a sublist of indicators which are obtained with a sublist of variables
− validating the sublist of indicators as a metric of IT projects
The software product designed to implement IT metrics is a complex construction which:
− must be accessed off the internet;
− has user authentication ;
− accepts definitions of data bases;
− takes fields from the data base and constitutes the series that make estimations;
− allows the selection of structures of initial indicators I1,I2,…Ik;
− offers a list of performance criterion for selecting indicators and variables;
− generate indicator structures for the refinement process;
− calculates the level of refined indicators on request or periodically to fundament decisions.
The software product has the functions:
− user authentication;
− the management of data sets that correspond to the problems to solve;
− estimation of model coefficients;
− model refinement;
− model structure generation;
− aggregation level calculation to fundament decisions;
− options, parameters and solutions are saved if the data sets are valid;
− adding of information and identification data. The software structure is given in figure 2.
Projects and Programs Evaluation. Risks, resources,
activities, portfolio and project management
Figure 2. Software structure for IT project metrics implementation
The software product is taking numerous elements that constitute a modelbase. The modelbase is a complex construction in which lists are included with: - dependent variables and independent variables;
- linear and nonlinear models structures; - registered data sets and generated data sets;
- implementation of the coefficients estimation algorithms; - procedures for the hypothesis verification;
- procedures for the estimated values calculation; - models hierarchizing procedures.
These very important components are elements with which the modelbase is populated. For the modelbase to become operational, an administration system has to exist.
First of all, the administration system has to operate distinctly with data sets, with the procedures and with the models structures.
Second of all, the administration system functions have to effectuate the fast finding of the data sets, of the models structures and of the procedures in order to secure the processes development in concordance with the demands of the analyst economist.
Third of all, the administration system has to be equipped with functions which permit the data sets adding, the models adding and the procedures adding. The perspective has to be changed, through which the modelbase bringing up to date implied data / models / procedures deleting or changing of some parts of these with new sequences.
The acceptance of the bringing up to date function exclusive through adding comes to bring a concordance between the natural way of understanding the evolution with the corresponding reflection of it on informatics level.
IT projects datasets Base module Solution management Model management IT projects data management User authentication Model estimation Model generation Model building
Projects and Programs Evaluation. Risks, resources,
activities, portfolio and project management
The modelbase administration system operates with non homogenous entities, important aspect in securing the flows consistency.
Fourth of all, an open character is secured, the users having at their disposal the possibility of defining personal algorithms for interpolation and extrapolation, for pseudoaleatory numbers generation, for the coefficients estimation, for implementing personal models selection criteria.
Fifth of all the, defining of the specific concepts regarding the finding, selection, extraction, targets the triplets (data, models structures, procedures), which group complex proceedings.
Sixth of all, a growth of the generalization degree for the transaction concept is produced, which in case of the modelbase implies the traversing of some flows in which it is operated simultaneously with data sets, with data structures and with procedures.
The new conglomerate, more complex than the object structure that includes the operands and operators, develops a new projection on the philosophy of designing an administration system, the administration system of the modelbase, in which new typologies specific to the implemented processes in the field of artificial intelligence are included besides the already usual proceedings.
Utilizations of the modelbase imply activations of some sequences of procedures from the modelbase.
The administration system of the modelbase is a construction with a very high complexity degree. The users must have the possibility of starting a small diversity of economic analysis projects.
For example, the coefficients estimation of a model on the basis of a data set consists of:
- the specification of the exogenous variables number and of the endogenous variables number;
- the specification of the data series terms number; - the insertion of the data table;
- the delimitation of the variables list corresponding to the data series position. Also, some results regarding the estimations quality are displayed.
This procedure is specific to the situation in which the user has a clear image on the phenomenon and this one’s analysis is already a routine activity.
Model generators are software applications taking as input datasets and information regarding model nature, structure and complexity and produce different models from a certain model class.
Linear model generators take as input a dataset containing a number of independent variables and a dependent variable and produce linear models combining influence factors.
Linear model generators with lagged arguments allow the elaboration of constructions which permit the modeling of the cases when a variation in an influence factor has a delayed effect on the dependent variable. The generator produces combinations of both influence factors and lags, identifying best models.
Standard nonlinear model generators use predefined analytical forms for generating models. General nonlinear model generators build automatically analytical expressions containing influence factors.
Projects and Programs Evaluation. Risks, resources,
activities, portfolio and project management
Model complexity is assessed by measures based on Halstead metrics, taking into account the number of operators and operands. Complexity measures help comparing models and building performance indicators.
The quantitative study of phenomena is encouraged by the volume of historically recoded information. Its purpose is to take decisions leading to continuous improving of performance indicators for subsequent projects.
Modelbases are complex software constructions offering functions for:
− defining, retrieving and updating models;
− modeling applications management;
− estimation and validation of coefficients;
− automated model generation from existing datasets;
− dataset management.
Model generators are modelbase instruments that build model structures from a given class using variables found in the dataset given as input. Model classes group models with the same structure, e.g. linear models, linear models with lagged variables, nonlinear models. For each class a model generator is developed. Each dataset contains data series for the recorded variables. The endogenous variable is specified and the generator builds analytical expressions using influence factors. For each model structure, coefficients are estimated and a performance indicator is computed. The resulting model list is ordered by the performance indicator. The analyst chooses between the best models an appropriate form that later will be used in estimating the studied characteristic.
In the context of model generation, the refinement process is described as follows. Consider the dataset S and a model generator G. The set of models generated by
G to fit the dataset S is LM. The model set LM is characterized by the following:
− the number of models is large;
− models have a variety of values for the performance criterion ranging from the worst fitting model to the best fitting model;
− models have a variety of values for the complexity, ranging from the most simple expressions to very complex ones;
− the best fitting models are not compulsory the most complex ones, and also, the simplest models are not the worst in explaining the studied phenomenon.
The refinement process using model generators is described by the following diagram shown in figure 3.
Projects and Programs Evaluation. Risks, resources,
activities, portfolio and project management
Figure 3. The model refinement process
The refinement process takes the following steps:
- the dataset is built; it contains data series for the dependent variable and independent variables;
- using variable names found in the dataset, model structures are generated; the list of generated model structures is denoted by LG and contains a large number of models, also depending on the constrains or type of the generation algorithm;
- for each model structure in LG, coefficients are estimated, along with statistical performance indicators, obtaining the list of estimated models, LE;
- for each model found in LE, an aggregated performance indicator is computed; the
LE list is ordered by this performance indicator and an arbitrary number of models is chosen, forming LR list, the refined list of models;
- the refined list of models is saved into a modelbase and then used by the human analyst to choose one or more models to be used in estimating the studied phenomenon.
5. Conclusions
Taking into consideration the importance of IT projects the continuance of the study is mandatory:
− Quality characteristics; − Identifying new indicators;
− Making the data collection and metrics calculation an automatic process;
− Recording reaction to the decision quality to see what are the indicators which need perfecting.
In current time there are instruments used to assist elaboration processes of IT projects. These instruments are meant to ensure the completeness of IT projects.
If the following are built:
- activity lists; Dataset D1,D2,...
Analytical
expression
generation
Parameter
estimation
Model
list
ordering
model
variables
list of
model
structures
Modelbase
M1,M2,...
list of
models
list of
refined
models
Projects and Programs Evaluation. Risks, resources,
activities, portfolio and project management
- resource lists; - job lists.
and for each the number of elements is established from the list, as an instrument is meant to impose:
− the complete description of the elements in each list;
− the correlation of elements between lists;
− the aggregation of data from the generated matrices by the combination of lists. If a series of relations are imposed regarding:
− the structure of the offer text;
− the expense structure;
− the activity precedence ;
− the rates of financing. the instruments are meant to:
− verify if the structure is respected;
− generate the parts of structure;
− reduce the number of repeats from one component to the other;
− control the levels of complexity;
− include aggregated levels;
− eliminate abbreviations introducing the elements clearly;
− ensures the qualitative level of the criterions;
− evaluate the level of allocated resources;
− use correct words from a specialty vocabulary.
For a data base in which the records regarding the evolution of a project are saved, the dates must be complete and correct.
If data is taken from several projects the following are calculated:
− differences between the consumption or normed duration;
− The interval belonging frequencies and consumption variation;
− The probability that a variable will follow a certain repartition law.
The complete image over an IT project is obtained only through the implementation of a correctly constructed metric, refined and completely validated.
Bibliography
Boja, C., Ivan, I. Metode statistice în analiza software, Ed. ASE, Bucharest, 2004 Ivan, I., Boja, C. Managementul calitatii proiectelor TIC, Ed. ASE, Bucharest, 2005
Ivan, I., Nosca, Gh., Popa, M. Managementul calitatii aplicatiilor informatice, Ed. ASE, Bucharest, 2006.
Ivan, I., Popescu, M. Metrici software, INFOREC Publishing House, Bucharest, 1999 Ivan, I., Ungureanu, D. Project Complexity, INFOREC Publishing House, Bucharest, 2002 Ivan, I., Visoiu, A. Baza de modele economice, Ed. ASE, Bucharest, 2005
Jalote, P. Software Project Management in Practice, Addison Wesley, 2002
Toma, C., Ivan, I., Popa, M., Boja, C. Data Metrics Properties, Proceedings of International Symposium October 22-23, 2004, Iassy, Romania, pp. 45-56
Projects and Programs Evaluation. Risks, resources,
activities, portfolio and project management
Visoiu, A. Performance Criteria for Software Metrics Model Refinement, Journal of Applied Quantitative Methods, Vol. 2, No. 1, March 30, 2007
Visoiu, A., Garais, G. Nonlinear model structure generator for software metrics estimation, The 37th International Scientific Symposium of METRA, Bucharest, May, 26th - 27th, 2006, Ministry of National Defence, published on CD
Visoiu, A., Ivan, I. Rafinarea metricilor software, Economistul, supliment “Economie teoretica si aplicativa”, no.1947(2973), August 29, 2005
1 Ion IVAN has graduated the Faculty of Economic Computation and Economic Cybernetics in 1970, he holds a PhD
diploma in Economics from 1978 and he had gone through all didactic positions since 1970 when he joined the staff of the Bucharest University of Economics, teaching assistant in 1970, senior lecturer in 1978, assistant professor in 1991 and full professor in 1993. Currently he is full Professor of Economic Informatics within the Department of Economic Informatics at Faculty of Cybernetics, Statistics and Economic Informatics from the University of Economics. He is the author of more than 25 books and over 75 journal articles in the field of software quality management, software metrics and informatics audit. His work focuses on the analysis of quality of software applications. He is currently studying software quality management and audit, project management of IT&C projects. He received numerous diplomas for his research activity achievements. For his entire activity, the National University Research Council granted him in 2005 with the national diploma, Opera Omnia.
He has received multiple grants for research, documentation and exchange of experience at numerous universities from Greece, Ireland, Germany, France, Italy, Sweden, Norway, United States, Holland and Japan.
He is distinguished member of the scientific board for the magazines and journals like:
- Economic Informatics; - Economic Computation and Economic Cybernetics Studies and Research; - Romanian Journal of Statistics
He has participated in the scientific committee of more than 20 Conferences on Informatics and he has coordinated the appearance of 3 proceedings volumes for International Conferences.
From 1994 he is PhD coordinator in the field of Economic Informatics.
He has coordinated as a director more than 15 research projects that have been financed from national and international research programs. He was member in a TEMPUS project as local coordinator and also as contractor in an EPROM project.
2 Adrian Visoiu graduated the Bucharest University of Economics, the Faculty of Cybernetics, Statistics and Economic
Informatics. He has a master degree in Project Management. He is a PhD student at Doctoral School of Bucharest University of Economics in the field of Economic Informatics.
He is an assistant lecturer in the Economic Informatics Department of the Bucharest University of Economics. He published 7 articles and he is coauthor of “Baza de modele economice” book.
3 Dragos Palaghita is a 4th year student in the University of Economics, Bucharest, Cybernetics Statistics and
Economic Informatics faculty, Economic Informatics section. He is programming in C++ and C# and his main areas of interest are Informatics Security and Software Quality Management.